
Figure 2. Personal Health Care Spending in the United States by Age, Sex, and Aggregated Condition Category, 2013.
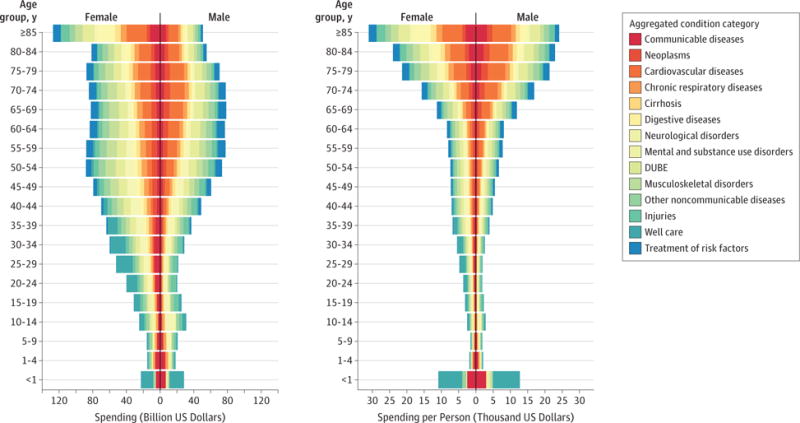
DUBE indicates diabetes, urogenital, blood, and endocrine diseases. Reported in 2015 US dollars. Panel A, illustrates health care spending by age, sex, and aggregated condition category. Panel B, illustrates health care spending per capita. Increases in spending along the x-axis show more spending.
Communicable diseases included nutrition and maternal disorders. Table 3 lists the aggregated condition category in which each condition was classified.