

Abstract
Context
Quantitative changes of salivary proteins due to acute stress were detected.
Objective
To explore protein markers of stress in saliva of eight medical residents who performed emergency medicine simulations.
Materials and methods
Saliva was collected before the simulations, after the simulations, and following morning upon waking. Proteins were separated by SDS-PAGE, identified by MS, and relatively quantified by densitometry.
Results
Salivary alpha-amylase and S–type cystatins significantly increased, while the ~26 kDa and low-molecular weight (<10 kDa) SDS-PAGE bands exhibited changes after stress.
Discussion and conclusion
Alpha-amylase and cystatins are potential salivary markers of acute stress, but further validation should be performed using larger sample populations.
Keywords: saliva, stress, mass spectrometry, gel electrophoresis, amylase, cystatins
1. Introduction
The use of saliva for biomarker discovery and monitoring has become a popular area of research. Saliva can be analyzed for biomarkers as it reflects many local and systemic physiological and biochemical processes, and its secretion is regulated by the autonomic nervous system (Amado et al., 2005, Al-Tarawneh et al., 2011, Brandão et al., 2014). Overall, saliva is a mixture of electrolytes, proteins, small organic compounds, and nucleic acids (Vitorino et al., 2004, Millea et al., 2007, Brandão et al., 2014). The predominant salivary protein families include amylases, mucins, cystatins, histatins, acidic proline-rich proteins, and basic proline-rich proteins (Denny et al., 2008, Scarano et al., 2010, Castagnola et al., 2011, Castagnola et al., 2012, Amado et al., 2013, Wu et al., 2014).
One commonly investigated salivary biomarker is cortisol for which correlation to chronic and acute psychological stress has been shown (Soo-Quee Koh and Choon-Huat Koh, 2007, Marrelli et al., 2014, Naumova et al., 2014). However, different types of stress exist in various demanding occupations including those in the medical and military fields for which monitoring potential biomarkers could prove beneficial. Preliminary studies have already been conducted to detect high levels of stress in specific occupational settings. The performance of health care professionals is affected by stress with the potential to impair the treatment of patients (Valentin et al., 2015). In this study, an increase in salivary alpha-amylase in paramedics and EMS physicians performing emergency scenarios was detected. Additionally, increases in cortisol and salivary alpha-amylase have been observed in Army nurses performing a combat casualty stress scenario (McGraw et al., 2013). Increases in salivary alpha-amylase, interleukin-6, and secretory IgA have also been detected in response to police officers performing simulations (Groer et al., 2010, Strahler and Ziegert, 2015). Furthermore, orexin A has been associated with stress and cognitive performance (Deadwyler et al., 2007, Strawn et al., 2010, Hagen et al., 2013). While preliminary studies have assayed biomarkers of stress, the application of new methodologies to analyze biomarkers of acute stress is important. Consequently, whether and how stress correlates with human performance is also an important question with broad social and economic implications, whose answer has not been fully elucidated.
The aim of this work is to begin addressing this question by using proteomics to determine how salivary proteins change in order to elucidate potential biomarkers of acute stress. The present study utilized gel electrophoresis, liquid chromatography, and mass spectrometry to analyze whole saliva collected from medical residents who performed emergency medicine simulations in hospital settings with computerized mannequins that have realistic features and respond appropriately to interventions. It has been shown that simulations can create realistic psychological challenges with high fidelity which will result in similar human performance as in a real situation (Müller et al., 2009, Clarke et al., 2014). Therefore, the simulations placed the residents into a brief stressed condition, providing an opportunity to analyze saliva composition dynamics and to assist in the identification of salivary protein biomarkers of acute stress.
2. Methods
2.1 Materials
Ammonium persulfate, glacial acetic acid and HPLC-grade acetonitrile were obtained from Fisher Scientific (Pittsburgh, PA). Ammonium bicarbonate, β-mercaptoethanol, trypsin from bovine pancreas, trifluoroacetic acid (TFA), formic acid (FA), dithiothreitol, iodoacetamide, and LC-MS-grade water were purchased from Sigma (St. Louis, MO). Bio-Safe Coomassie Brilliant Blue G-250 stain and 2x Laemmli sample buffer were from Bio-Rad (Hercules, CA). For polyacrylamide gel casting, 30% acrylamide/bis solution (29:1), 1.5 M Tris-HCl (pH 8.8), 0.5 M Tris-HCl (pH 6.8), and N,N,N’,N’-tetramethylelthylenediamine (TEMED) were also obtained from Bio-Rad. Monoclonal histatin-3 antibody (4G9) was purchased from Novus Biologicals (Littleton, CO). Histatin antibody (H-40), rabbit polyclonal IgG, was obtained from Santa Cruz Biotechnology. Synthetic histatin-3 was from Genemed Synthesis Inc. (San Antonio, TX). A salivary alpha-amylase kinetic enzyme assay kit was purchased from Salimetrics (State College, PA).
2.2 Methodology
2.2.1 Ethics approval
This study and the collection of saliva samples were approved by the University of Toledo Biomedical Institutional Review Board (IRB #108200). Consent was obtained from all participants of this study.
2.2.2 Emergency medicine case simulation paradigm
As part of their educational overview in Emergency Medicine residents are trained in basic and advanced life-saving skills (e.g., pediatric advanced life support, advanced cardiovascular life support, advanced trauma life support), standard emergency medicine procedures, case management issues, and are introduced into the day-to-day workings of the emergency department. This is achieved in part by training and assessment in scenarios utilizing high-fidelity simulators in the Immersive Interdisciplinary Simulation Center (IISC) at the University of Toledo Medical Center (Toledo, OH). Specific emergency medicine patient scenarios are created by a faculty member from the Department of Emergency Medicine. These scenarios are then incorporated into the computerized technology of the high-fidelity patient simulators. For the current study, residents were briefed as to the workings of the IISC, how the simulators function, and how the residents, as part of a two-person team, are to interact with the simulators (i.e., “patients”). After obtaining informed consent, eight first-year Emergency Medicine residents (postgraduate year 1) with no in-depth training in emergency medicine case simulation and within the first month of their residency program were acclimated to the simulation process with initial cases designed to be basic, uncomplicated and not requiring any sense of urgency on the part of the care-giver. Each case was followed by a debriefing during which the residents assess themselves and receive targeted education from faculty. However, during the testing period the cases were more acute and stressful. Each case replicated a true emergency and involved a crisis of airway, breathing and/or circulation that had to be managed immediately (e.g., seizures, tension pneumothorax, traumatic shock, overdose, etc.). The cases were novel, involved multiple complications that required prioritization and immediate correction, and involved a “family member” who added further complications and complexities to the residents’ management of the patient.
2.2.3 Saliva collection
Saliva was collected from eight first-year medical residents (four male and four female, 24–30 years old, average 27.5 years old, Table 1) at the University of Toledo Medical Center. Whole saliva was collected via the passive drool method into 1.5 mL cryotubes. The residents were asked to refrain from eating or drinking for at least 20 minutes prior to sample collection. Additionally, one of the residents was fasting from sunrise to sunset during the study. The first saliva sample was collected immediately prior to performing the emergency medicine simulation around 9:00 am at the IISC. A second saliva sample was collected shortly after completing the simulation, which was within three hours of collecting the first sample. A third sample was collected upon waking the following morning before eating, drinking or brushing their teeth (Figure 1). The saliva samples preceding the simulation were stored on ice until the completion of the simulation and the obtainment of the second saliva sample. These samples were transported back to the lab on ice and aliquoted to avoid multiple freeze-thaw cycles prior to being frozen at −80 °C. Although protease inhibitors were not added to these saliva samples, a study by de Jong et al. showed that the abundance of salivary peptides was stable without the addition of protease inhibitors for short periods of time before the saliva was frozen (de Jong et al., 2011). Before analysis, the saliva samples were thawed and centrifuged at 986 × g for 15 minutes to pellet any debris present.
Table 1.
Demographics of the first-year medical residents participating in the study
| Resident | Gender | Age | Post-Simulation a | Wake a |
|---|---|---|---|---|
| 1 | Male | 26 | 11:18 AM | 6:45 AM |
| 2 | Female | 24 | 9:51 AM | 7:00 AM |
| 3 | Female | 29 | 10:57 AM | 6:50 AM |
| 4 | Female | 28 | 9:51 AM | 6:50 AM |
| 5 | Male | 28 | 11:19 AM | 6:45 AM |
| 6 | Female | 28 | 10:56 AM | 6:00 AM |
| 7 | Male | 27 | 11:48 AM | 6:40 AM |
| 8* | Male | 30 | 11:47 AM | 7:30 AM |
Fasting from sunrise to sunset
Refers to time at which saliva was collected
Figure 1.
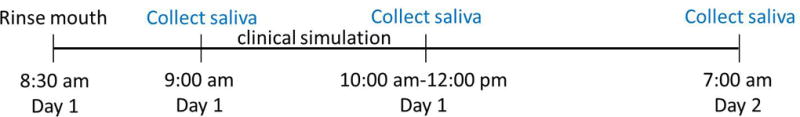
Overview of the time course of saliva collection with the emergency medicine simulation
2.2.4 SDS-PAGE
Samples were prepared in two comparable manners in which equal volumes of saliva from each time point were loaded in the gels for SDS-PAGE. One manner combined 30 µL of the saliva samples with 30 µL of buffer consisting of 19:1 (v:v) Laemmli sample buffer: β-mercaptoethanol for a total sample volume of 60 µL, of which 25 µL was loaded on the gel. For increased sensitivity of the low-molecular weight band, 20 µL of the saliva samples were combined with 10 µL of buffer for a total sample volume of 30 µL, whose entirety was loaded on the gel. Before loading, the samples were heated at ~90 °C for five minutes to denature the proteins. Salivary proteins were separated using 12% polyacrylamide gels run at 120 V. For each sample preparation method, the samples were run in duplicate to ensure reproducibility. The proteins were visualized with Bio-Safe Coomassie Brilliant Blue G-250 solution. Additionally, a commercially obtained histatin-3 protein (200 and 300 ng aliquots) was analyzed on the gels for comparison with the low-molecular weight salivary protein band.
2.2.5 In-gel digestion and peptide mass fingerprinting
Protein bands were subjected to a standardized in-gel digestion protocol (Shevchenko et al., 2007). Briefly, protein bands were excised from the gel. The gel pieces were destained using 1:1 (v:v) 100 mM ammonium bicarbonate: acetonitrile. The pieces were further destained and dehydrated by adding neat acetonitrile. Next, the liquid was removed, and 50 µL of a 13 ng/µL solution of trypsin in 10 mM ammonium bicarbonate was added to completely cover the pieces. The samples were kept in the fridge for two hours to allow trypsin to fully saturate the gel. Afterwards, 100 mM ammonium bicarbonate was added to the gel pieces prior to transferring the tubes to a 37 °C water bath where they were incubated overnight (~16 hours).
For matrix-assisted laser desorption/ionization mass spectrometry (MALDI-MS) analyses of the digests, alpha-cyano-4-hydroxycinnamic acid (CHCA) matrix was obtained from Bruker Daltonics (Bremen, Germany) and used without further purification. Bruker’s MALDI-TOF/TOF UltrafleXtreme (equipped with a pulsed Smartbeam II Nd:YAG 355 nm laser) was used to analyze the samples. FlexControl (version 3.4, Bruker Daltonics) software was used to acquire mass spectra. Calibration of the instrument was performed prior to data acquisition using peptide standards obtained from Bruker Daltonics containing angiotensin II, angiotensin I, substance P, bombesin, ACTH fragment 1–17, ACTH fragment 18–39, and somatostatin.
The trypsin-digested protein bands were identified using peptide mass fingerprinting (PMF). Briefly, 1 µL of the digest was co-spotted with 1 µL of 10 mg/mL CHCA matrix in 60:40 (v:v) acetonitrile:0.1% TFA onto a MTP 384 ground steel target plate (Bruker Daltonics) using the dried droplet method. MALDI-MS analysis was performed in positive ion reflectron mode from mass-to-charge ratio (m/z) 600 to m/z 3500. Mass spectra were analyzed using FlexAnalysis software (version 3.3, Bruker). A MASCOT (Matrix Science) search was performed using the SwissProt database of the tryptic peptides (Perkins et al., 1999). The taxonomy was set to Homo sapiens. One missed cleavage was typically allowed with methionine oxidation set as a variable modification, and a 0.2 Da mass tolerance was permitted. However, two missed cleavages were typically permitted for bands with molecular weight (MW) < 10 kDa. The threshold for confident protein identification was a score equal to or greater than 56 corresponding to p < 0.05. Furthermore, proteins were verified as salivary proteins by searching UCLA Dental Research Institute’s Salivary Proteome Knowledge Base (UCLA Dental Research Institute, 2005, Yan et al., 2009).
2.2.6 Densitometry and statistical analyses
Coomassie stained proteins bands of interest were subjected to densitometric analyses using ImageJ (NIH) software. The stained gels were scanned using a desktop scanner (HP ScanJet 6300C) at its maximum resolution (1200 dpi) before being imported into ImageJ. A few gels that contained 30 µL of sample per well were omitted from statistical analyses due to slight protein migration into adjacent lanes. To account for run to run differences, the 50 kDa MW ladder band was used for normalization as it was sufficiently stained on all the gels. The area of each protein band of interest was divided by the volume of the sample (25 or 30 µL) and by the area of the 50 kDa MW ladder band. The ratios of normalized protein band areas at post-emergency medicine simulation to wake, post-emergency medicine simulation to pre-emergency medicine simulation and wake to pre-emergency medicine simulation were determined. The ratios for multiple runs were averaged and subjected to the Wilcoxon signed-rank test using Minitab (Minitab Inc.) software to determine if the differences between salivary protein abundances at different time points were significant. The Holm-Bonferroni correction method was used to control for the multiple comparisons made for each SDS-PAGE protein band. An adjusted p-value of less than 0.05 was considered significant.
2.2.7 In-solution enzymatic digestion of salivary proteins
Proteins in whole saliva samples from the three collection time points were reduced, alkylated, and digested using trypsin. For reduction of disulfide bonds, a 10 µL aliquot of saliva was combined with 7.5 µL of 100 mM ammonium bicarbonate and 1.25 µL of 200 mM dithiothreitol followed by incubation at 60 °C for one hour. In order to alkylate the reduced cysteine residues, 1.25 µL of 200 mM iodoacetamide was added, and the sample was left in the dark for one hour at room temperature. Afterwards, 1.25 µL of 200 mM dithiothreitol was added. Again, the sample was left for one hour in the dark. Finally, 150 µL of water, 50 µL of 100 mM ammonium bicarbonate, and 0.9 µg of trypsin in 10 µL of 50 mM acetic acid were added. The samples were incubated overnight (~16 hours) at 37 °C. The enzymatic digestion was halted by adding 2 µL of TFA.
Synthetic histatin-3 was used for comparison to the salivary histatin-3 for additional confirmation studies. The synthetic protein was digested with trypsin in-solution. As histatin-3 does not contain any cysteine residues, the reduction and alkylation steps were omitted. Instead, 10 µL of 1 µg/µL histatin-3 in deionized water was combined with 50 µL of 100 mM ammonium bicarbonate and 20 µL of 50 mM acetic acid containing 100 ng of trypsin. This sample was incubated overnight (~16 hrs) at 37 °C, at which point the digestion was halted by the addition of 2 µL of TFA.
2.2.8 LC-ESI-MS/MS of salivary peptides
To confirm the protein identification of SDS-PAGE bands of interest by PMF, peptides were extracted from the digested gel bands for further nano-HPLC-electrospray ionization (ESI) tandem mass spectrometry (MS/MS) analyses using an ESI-Orbitrap Fusion Tribrid mass spectrometer (Thermo Fisher, Waltham, MA) equipped with a nanospray source (Senko et al., 2013). Extraction of tryptic peptides was performed as described by Shevchenko et al. (Shevchenko et al., 2007). In addition, the trypsin-digested whole saliva samples were analyzed by nano-HPLC-ESI-MS/MS.
The peptides were separated using a Dionex Ultimate 3000 HPLC RSLCnano system equipped with an Acclaim® PepMap RSLC C18 column (75 µm × 15 cm, 2 µm particles, 100 Å pore size). The flow rate was 300 nL/min, and the column oven temperature was 35 °C. Mobile phase A was 0.1% FA in water, and mobile phase B was 0.08% FA in 80:20 (v:v) acetonitrile: water. Using an autosampler, 2 µL injections were made using 0.05% TFA in 98:2 (v:v) water: acetonitrile. The peptides were loaded on a precolumn for a five-minute desalting step prior to separation on the C18 column held at 4% B. For the separation of extracted SDS-PAGE band peptides, a linear gradient from 4–55% B over 60 minutes was used. To separate the complex peptide mixture of the whole saliva digest, the linear gradient was extended to 4–55% B over 120 minutes. Then, the solvent composition was ramped to 100% B in 0.5 minute for 10 minutes, followed by re-equilibration at 4% B.
After separation, eluted peptides were detected using a UV-Vis nanoHPLC detector set at 214 nm. Then, the peptides were analyzed by the ESI-Orbitrap Fusion MS operated in data-dependent mode. A positive spray voltage of 1800 V and an ion transfer tube temperature of 275 °C were used without sheath or auxiliary gas. The MS and MS/MS cycle time was 3 seconds. Full MS scans were acquired from m/z 400 to m/z 1600 using quadrupole isolation and orbitrap detection at a resolution of 120,000. MS/MS selection was performed using “monoisotopic precursor selection” of ions having charge states from 2+ to 4+ with an ion intensity threshold of 5.0e3 and a most intense precursor priority. Collision-induced dissociation (CID) MS/MS was performed in the linear ion trap using a collision energy of 35%. The spectra were analyzed by Proteome Discoverer (version 1.4, Thermo). A SEQUEST HT search of the tryptic peptides was performed using the SwissProt database downloaded in September of 2014. The taxonomy was set to Homo sapiens. Two missed cleavages were allowed with methionine oxidation and phosphorylation of serine, threonine or tyrosine set as variable modifications for the gel band peptides. For the whole saliva digest, which was subjected to reduction and alkylation, carbamidomethylation was set as a fixed modification of cysteine. The maximum Delta correlation (Cn) was set to 0.05 with a precursor mass tolerance of 10 ppm and a fragment mass tolerance of 0.6 Da. Results were run through percolator for validation based on q-values with a relaxed target false discovery rate (FDR) of 0.05 and a strict FDR of 0.01 (Käll et al., 2008). As with MALDI-MS peptide mass fingerprinting, the protein identifications were verified as known salivary proteins by searching UCLA Dental Research Institute’s Salivary Proteome Knowledge Base (UCLA Dental Research Institute, 2005, Yan et al., 2009).
2.2.9 Salivary alpha-amylase kinetic enzyme assay
The remaining saliva samples were subjected to a salivary alpha-amylase kinetic enzyme assay, which was performed according to the manufacturer’s instructions. A 1:10 dilution was prepared for most of saliva samples by diluting 10 µL of saliva with 90 µL of the alpha-amylase diluent. However, 5 µL of saliva was used to prepare the 1:10 dilutions in the case of a few saliva samples whose remaining volume was limited (< 10 µL). Next, a 1:200 dilution of saliva was prepared by diluting 10 µL of the 1:10 dilution with 190 µL of the alpha-amylase diluent with brief mixing. Then, 8 µL of the 1:200 dilution of the saliva was placed in the 96 well plate supplied in the kit. A 320 µL aliquot of the alpha-amylase substrate warmed to 37 °C was added to each well. The 96 well plate was promptly placed in a plate reader at 37 °C and was mixed at 500–600 rpm. The optical density of the sample at 405 nm was read at exactly 1 minute and 3 minutes. The alpha-amylase activity was calculated according to an equation provided with the kit. For the samples that used 5 µL of saliva to prepare initial 1:10 dilution, the result was multiplied by a factor of two.
3. Results
3.1 SDS-PAGE and peptide mass fingerprinting
Equal volumes of the saliva samples from eight medical residents for each of the three time points (Figure 1) were prepared and loaded onto 12% polyacrylamide SDS-PAGE gels for protein separation (Figures 2 and S1–S2). The SDS-PAGE analyses were performed in duplicate for each of the two sample preparation methods used, which respectively involved loading 25 µL (gel images shown in Figures S1–S2) and 30 µL of the samples on the gels (gel images omitted except for the one shown in Figure 2).
Figure 2.
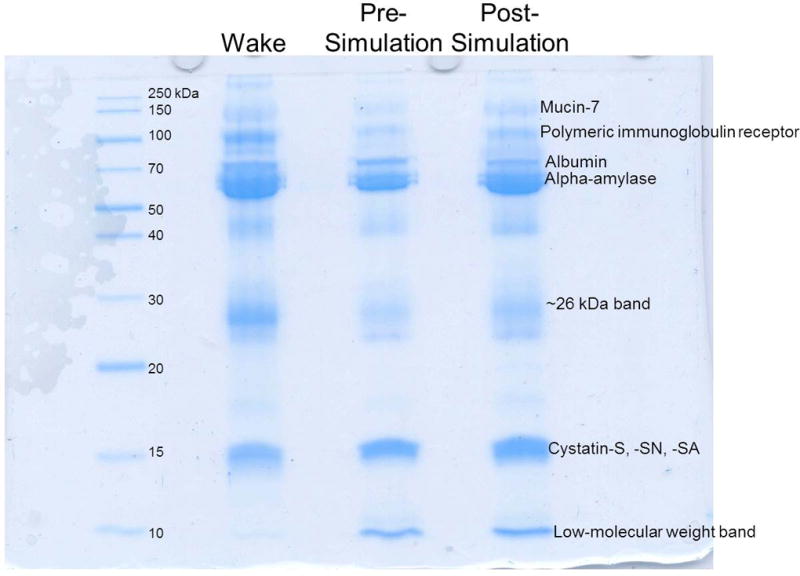
Representative SDS-PAGE of salivary protein samples (30 µL loading volumes) obtained from waking, prior to the emergency medicine simulation (pre), and after the emergency medicine simulation (post) time points. The gel is labeled with some of the more prevalent proteins identified by peptide mass fingerprinting.
Protein bands were excised and subjected to in-gel trypsin digestion followed by peptide mass fingerprinting for protein identification. Figure 2 shows a representative gel image labeled with the most prevalent identified proteins. A few proteins were detected by Coomassie staining. Alpha-amylase was identified as the most prominent band seen on the gels. Several high molecular weight proteins were also identified, including mucin-7 and polymeric immunoglobulin receptor. The cystatin type S family (cystatin-S, cystatin-SN, and cystatin-SA) was another prominent group of salivary proteins on the gels (Figure 2), which was readily identified by MALDI-MS (Figure S-3). Additionally, PMF analysis of the low-molecular weight (< 10 kDa) band indicated that the small protein, histatin-3 was present (Figure S-4). A complete listing of proteins identified by MALDI-MS peptide mass fingerprinting is provided in Table 2.
Table 2.
Salivary proteins identified by MALDI-MS peptide mass fingerprinting
| Accession | Protein Name | Mass (kDa) |
Score a | No. Peptides b |
Seq. Coverage |
Residents c |
|---|---|---|---|---|---|---|
| P02768 | Serum albumin | 66.5 | 186 | 26 | 34% | 1 to 7 |
| P04745 | Alpha-amylase 1 | 55.9 | 314 | 34 | 62% | 1 to 8 |
| P19961 | Alpha-amylase 2B | 55.9 | 304 | 34 | 59% | 1 to 8 |
| P04746 | Pancreatic alpha-amylase | 55.9 | 242 | 30 | 50% | 1 to 8 |
| P01037 | Cystatin-SN | 14.3 | 141 | 14 | 76% | 1 to 8 |
| P01036 | Cystatin-S | 14.1 | 155 | 13 | 92% | 1 to 8 |
| P09228 | Cystatin-SA | 14.3 | 86 | 11 | 53% | 1,3,4,5,8 |
| P15516 | Histatin-3 | 4.1 | 103 | 6 | 84% | 1,2,4,7 |
| P01876 | Ig alpha-1 chain C region | 37.6 | 66 | 12 | 24% | 2,5,8 |
| P01877 | Ig alpha-2 chain C region | 36.5 | 67 | 11 | 22% | 2,5,7,8 |
| O43790 | Keratin, type II cuticular Hb6 | 53.5 | 72 | 13 | 28% | 5 |
| P61626 | Lysozyme C | 14.7 | 65 | 9 | 45% | 2,4 |
| Q8TAX7 | Mucin-7 | 36.8 | 74 | 10 | 21% | 2,4 |
| P01833 | Polymeric immunoglobulin receptor | 81.3 | 94 | 16 | 21% | 3,5 |
| P12273 | Prolactin-inducible protein | 13.5 | 87 | 7 | 57% | 7 |
| P18206 | Vinculin | 123.6 | 73 | 18 | 21% | 1,4,6 |
Protein scores greater than 56 are significant (p<0.05); highest score for digests given
Number of peptides in the mass spectrum matching the protein
Resident samples in which the protein was identified
3.2 Densitometry and statistical analyses
A few protein bands varied in amount from the wake and pre-emergency medicine simulation samples compared to the post-emergency medicine simulation samples (Figures S-1 and S-2). ImageJ was used to perform relative protein quantification of four bands: alpha-amylase, a ~26 kDa protein band, cystatin type-S family, and a low-molecular weight band. After importing the gel images into ImageJ, the peak area of each band was measured and normalized. For normalization, the area of the band was divided by the volume of sample loaded on the gel and by the area of the 50 kDa MW ladder band to account for run to run differences (Tables S-1 and S-2). For example, the wake alpha-amylase band for the first run of resident 1 saliva had an arbitrary unit area of 22,225. This area was divided by 25 for its sample volume and by 27,413 for the arbitrary unit area of the 50 kDa ladder band, resulting in a normalized band area of 0.032430. Ratios of each protein band areas for post-simulation to wake, post-simulation to pre-simulation, and wake to pre-simulation time points were determined for each medical resident (Table 3). For the alpha-amylase, ~26 kDa, and cystatin bands, the ratios from the two 25 µL-sample SDS-PAGE runs were averaged. For the low-molecular weight band, data from one of the SDS-PAGE analyses employing 30 µL of loaded sample (run #4 in Table S-2) were used due to missing data (i.e., undetected low-molecular weight band) in the other samples. Other data from the 30 µL of loaded samples (Tables S-1 and S-2) were omitted due to slight protein migration in adjacent lanes and larger variability in the band areas compared to the 25 µL of loaded sample, as determined using Minitab.
Table 3.
Averaged ratios of the relative amounts of the protein bands subjected to densitometric analyses
| Resident | Amylase Post to Wake |
Amylase Post to Pre |
Amylase Wake to Pre |
~26 kDa Post to Wake |
~26 kDa Post to Pre |
~26 kDa Wake to Pre |
|---|---|---|---|---|---|---|
| 1 | 2.145 | 2.014 | 0.9400 | 2.247 | 1.780 | 0.8391 |
| 2 | 1.027 | 1.888 | 1.922 | 0.8680 | 1.521 | 1.768 |
| 3 | 2.523 | 1.532 | 0.6071 | 1.896 | 1.585 | 0.8355 |
| 4 | 4.805 | 1.371 | 0.7672 | 0.8096 | 1.537 | 1.984 |
| 5 | 1.918 | 2.190 | 1.158 | 0.8620 | 1.559 | 1.817 |
| 6 | 1.858 | 2.126 | 1.153 | 2.095 | 1.754 | 0.8390 |
| 7 | 2.322 | 2.143 | 0.9747 | 1.310 | 1.549 | 1.387 |
| 8 | 0.5630 | 0.8751 | 1.715 | 0.2732 | 0.8357 | 3.684 |
| Resident | Cystatin Post to Wake | Cystatin Post to Pre | Cystatin Wake to Pre | Low MW Post to Wake | Low MW Post to Pre | Low MW Wake to Pre |
| 1 | 1.599 | 2.487 | 1.457 | 3.123 | 10.87 | 3.481 |
| 2 | 1.410 | 1.646 | 1.181 | 3.849 | 2.707 | 0.7033 |
| 3 | 2.381 | 1.623 | 0.6820 | n/a | n/a | n/a |
| 4 | 2.756 | 1.676 | 0.6081 | 3.876 | 1.112 | 0.2870 |
| 5 | 1.534 | 1.792 | 1.170 | n/a | n/a | n/a |
| 6 | 4.065 | 2.457 | 0.6044 | n/a | n/a | n/a |
| 7 | 1.803 | 1.735 | 0.9878 | 3.796 | 1.844 | 0.4858 |
| 8 | 0.9643 | 1.692 | 1.733 | 1.216 | 0.9492 | 0.7807 |
Amylase: alpha-amylase protein band
Low MW: low molecular weight (<10 kDa) protein band
Post: saliva collected after the emergency medicine simulation
Pre: saliva collected prior to the emergency medicine simulation
Wake: saliva collected upon waking the morning after the emergency medicine simulation n/a: band absent or not sufficiently stained
Boxplots of the data were generated to gain insight into the distribution of the ratios of the protein bands at the various time points (Figure 3 and Table 3). The ratios between the post-simulation to the control time points were typically greater than 1 indicating an increase in the protein abundances after the emergency medicine simulation (post-simulation). The ratios of protein abundances at the non-stress time points were typically close to 1 indicating that there were no significant changes in the amounts of the studied proteins at wake and pre-simulation time points.
Figure 3.
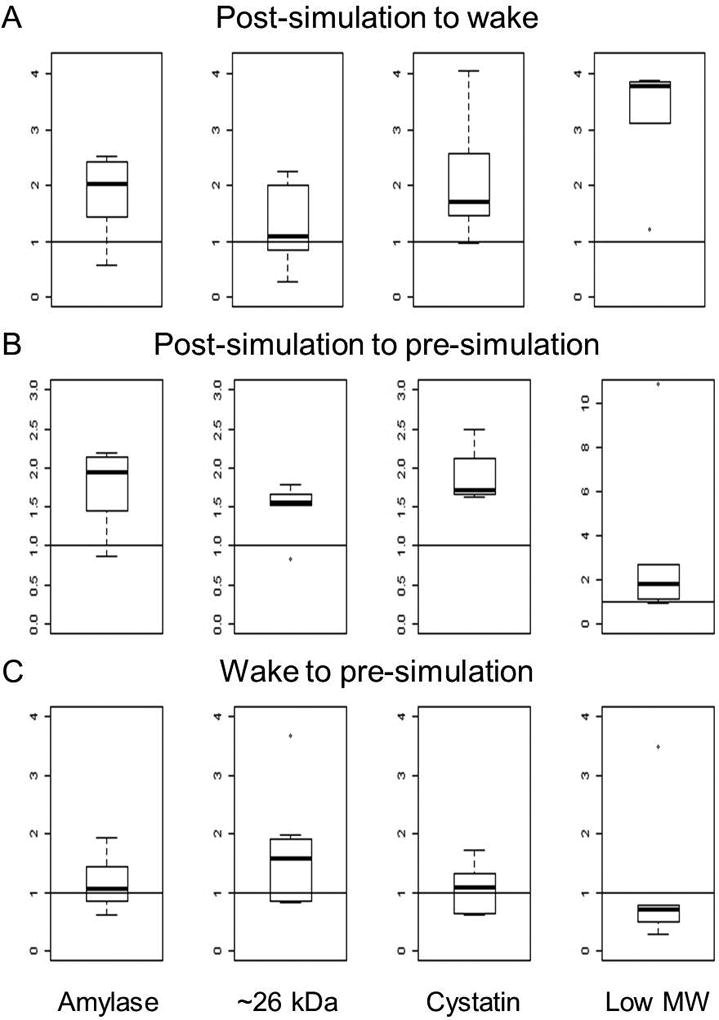
Boxplots of the relative ratios of alpha-amylase, the ~26 kDa, cystatin, and the low-molecular weight (low MW) protein bands. Panel A is the ratio of the protein band areas after the emergency medicine simulation (post-simulation) compared to waking the morning after the emergency medicine simulation (wake). Panel B is the ratio of the protein band areas post-simulation compared to prior to the emergency medicine simulation (pre-simulation). Panel C is the ratio of the protein band areas from wake to pre-simulation time points.
The non-parametric Wilcoxon signed-rank test was employed to determine if the median ratios between the quantities of alpha-amylase, cystatins, the ~26 kDa band, and the low-molecular weight band were significantly different from 1 comparing the three time points. The resulting p-values are summarized in Table 4. As multiple tests were employed for each protein band, the Holm-Bonferroni correction method was used, and the adjusted p-values are also included in Table 4. Specifically, for the alpha-amylase band, the band area ratios for the post-emergency medicine simulation to the wake time points as well as the post-emergency medicine simulation to the pre-emergency medicine simulation time points (Table 4) were determined to be significant as their Holm-Bonferroni adjusted p-values were less than 0.05 (0.0468 for both).
Table 4.
Summary of the relative quantification of the protein bands determined by Wilcoxon signed-rank test.
| Protein Band | Time point Ratio |
p-value | Adjusted p-value* |
|---|---|---|---|
| Alpha-amylase | Post to Wake | 0.0234 | 0.0468 |
| Post to Pre | 0.0156 | 0.0468 | |
| Wake to Pre | 0.641 | 0.641 | |
| ~26 kDa | Post to Wake | 0.383 | 0.383 |
| Post to Pre | 0.0156 | 0.0468 | |
| Wake to Pre | 0.109 | 0.218 | |
| Cystatin | Post to Wake | 0.0156 | 0.0312 |
| Post to Pre | 0.0078 | 0.0234 | |
| Wake to Pre | 0.844 | 0.844 | |
| Low-molecular weight | Post to Wake | 0.0625 | 0.188 |
| Post to Pre | 0.125 | 0.250 | |
| Wake to Pre | 0.625 | 0.625 |
p-value adjusted using the Holm-Bonferroni correction method, values less than 0.05 are considered significant
The ratio of the band areas for post-emergency medicine simulation to the wake time points of the ~26 kDa band was not significant (Holm-Bonferroni adjusted p-value of 0.383). However, the ratio of the band areas for post-emergency medicine simulation to the pre-emergency medicine simulation time points was significant (Holm-Bonferroni adjusted p-value of 0.0468) for the ~26 kDa protein band. Additionally, the type-S cystatins band had comparable results to the alpha-amylase band. The Holm-Bonferroni adjusted p-values from the ratios of the post-emergency medicine simulation to wake time points as well as the post-emergency medicine simulation to pre-emergency medicine simulation time points were determined to be significant (0.0312 and 0.0234, respectively) for the type-S cystatins band (Table 4).
The ratio of band areas for post-emergency medicine simulation to the wake time point as well as the ratio of band areas for the post- to pre-emergency medicine simulation time points for the low molecular weight band (Table 4) were not significant (Holm-Bonferroni adjusted p-values of 0.188 and 0.250, respectively). The ratios of the waking to pre-emergency medicine simulation time points for all four protein bands were not significant indicating that there is no major difference in protein amount between the non-stress time points.
3.3 Salivary alpha-amylase kinetic enzyme assay
The results of the salivary alpha-amylase kinetic enzyme assay are provided in Supplementary Table S-3 and Figure S-5. Five of the residents had the lowest salivary alpha-amylase activity in the sample obtained upon waking, and the remaining three residents had the lowest salivary alpha-amylase activity in the sample collected prior to the emergency medicine simulation. The greatest amount of alpha-amylase activity was observed in saliva collected after the emergency medicine simulation for seven of the medical residents. However, there was an insufficient amount of post-simulation saliva from resident #8, who was the resident that was fasting during the simulation, to perform the assay.
3.4 Additional salivary protein identification studies
Additional studies to ascertain the identity of the ~26 kDa and low-molecular weight SDS-PAGE bands were performed using Western blotting and nanoHPLC-ESI-MS/MS. The low-molecular weight band, which was identified as salivary histatin-3 by PMF, was also compared to a synthetic histatin-3 standard for confirmation. In short, neither synthetic nor salivary histatin-3 was detected by histatin-3 antibodies. Additionally, nanoHPLC-ESI-MS/MS did not confirm the identities of the ~26 kDa and low-molecular weight SDS-PAGE bands. Detailed results of these studies are provided in the supplementary data.
4. Discussion
In this study, equal volumes of saliva samples were loaded for SDS-PAGE separation instead of saliva samples with the same amount of total protein. This was done in light of future potential clinical applications in which an objective measurement of acute stress may be performed directly in the workplace or in a clinic to provide rapid results and to attempt to mitigate the stressor or any negative consequences of performing delicate tasks (e.g., medical and military tasks) when possible. It was noted previously that it is more practical to use equal volumes of saliva for analysis as many clinical environments do not routinely perform protein assays before analysis (Millea et al., 2007).
Overall, a few bands were detected by Coomassie staining. This finding is in accordance with a previous study in which SDS-PAGE of whole saliva detected approximately ten proteins (Bandhakavi et al., 2009). As expected, alpha-amylase was the most prominent band seen on the gels as it comprises approximately 60% of the proteins in saliva (Vitorino et al., 2004, Deutsch et al., 2008). The primary role of alpha-amylase in saliva is to initiate digestion as it hydrolyzes α-1,4-glycosidic bonds in starch (Soo-Quee Koh and Choon-Huat Koh, 2007, Denny et al., 2008, Schulz et al., 2013).
Alpha-amylase has been previously shown as a salivary marker of stress (Groer et al., 2010, Trueba et al., 2012, McGraw et al., 2013, Strahler and Ziegert, 2015, Valentin et al., 2015), and our results confirm such findings. It is evident from our densitometry (Table 4) and kinetic enzyme assay (Table S-3 and Figure S-5) data that the amount of salivary alpha-amylase is the highest after emergency medical simulations for all residents except for resident # 8, who was fasting and for whom kinetic enzyme assay data were not available. Additionally, the increase in salivary alpha-amylase due to stress is independent of salivary flow rate (Obayashi, 2013). This indicates that salivary alpha-amylase can be used as a marker of acute stress regardless of the salivary flow rate throughout the day. For detection, it should be noted that salivary alpha-amylase exists in many glycosylated forms (Vitorino et al., 2004, Hu et al., 2006).
Identification of the protein band at ~26 kDa remained elusive by PMF. It can be postulated that it contains proline-rich proteins (PRPs). This class of proteins is one of the most abundant classes of proteins found in saliva and is rich in proline residues making identification by trypsin digestion challenging (Beeley et al., 1991a, Amado et al., 2005). Previous studies noted that PRPs may be stained a pink-violet color, while the other proteins are stained blue, when using Coomassie R-250 (instead of Coomassie G-250 used in this study) and when organic solvent is omitted from the destaining solution (Beeley et al., 1991a, Beeley et al., 1991b, Amado et al., 2005, Hardt et al., 2005). However, due to the limited sample amounts, confirmation by this staining method was not performed. Based on previous reports, this ~26 kDa band could contain a basic PRP with mass of 23,462 Da as it has been noted that PRPs tend to migrate slower than expected due to their atypical amino acid sequence (Beeley et al., 1991b, Messana et al., 2008). However, neither PMF nor nanoLC-ESI-MS/MS confirmed presence of PRP in saliva samples analyzed in this study. In contrast, the presence of prolactin-inducible protein in this band, as identified by nanoHPLC-ESI-MS/MS (Table S-4), and its potential increase in response to acute stress would agree with a previous study (Trueba et al., 2012). Therefore, this band should be studied further as it significantly increased due to the acute stress of the simulation compared to the pre-simulation time point.
Besides alpha-amylase, it was found that another prominent SDS-PAGE band corresponding to cystatin-S, -SN, and –SA changes due to acute stress in saliva of medical residents. These members of the cystatin family have several commonalities including that they are cysteine protease inhibitors with molecular masses between 13 and 14 kDa and have two conserved disulfide bonds (Isemura et al., 1991, Lupi et al., 2003, Amado et al., 2005, Hu et al., 2005, Messana et al., 2008, Ryan et al., 2011, Sousa-Pereira et al., 2014). They also regulate salivary calcium and have antimicrobial activity (Sousa-Pereira et al., 2014).
Based on the Wilcoxon signed-rank test and Holm-Bonferroni correction method, the relative abundance of salivary cystatins increased in response to acute stress indicating that a band corresponding to cystatin S family is a putative acute stress biomarker. Previous studies identified cystatin-S as a potential marker of acute stress (Bosch et al., 2002, Trueba et al., 2012). Cystatin-S can be classified as either cystatin S1 or S2 which differ by their post-translational phosphorylation. Cystatin S1 is monophosphorylated at Ser23, and cystatin S2 is diphosphorylated at Ser21 and Ser23 (Lupi et al., 2003, Ryan et al., 2011). Conversely, cystatin-SA and –SN are not shown to be phosphorylated (Isemura et al., 1991). Cystatin-SA has been studied previously as a putative salivary biomarker of oral cancer (Ryan et al., 2011). Additionally, cystatins B, C, and D were identified in whole saliva of medical residents using nanoHPLC-ESI-MS/MS (Table S-5).
In-gel digestion of the low-molecular weight band followed by MALDI-MS PMF (Figure S-4) led to the identification of a small, 32-amino acid salivary protein histatin-3 (average MW= 4062.41 Da). Two missed cleavages of trypsin were allowed for the MASCOT search, which appears reasonable considering the small size and consecutive trypsin cleavage sites, lysine (K) and arginine (R), present in the amino acid sequence of histatin-3 (DSHAKRHHGY KRKFHEKHHS HRGYRSNYLY DN) (Sabatini and Azen, 1989, Ghafouri et al., 2003, Castagnola et al., 2004, Amado et al., 2005). Its small size is comparable to the size of the 33 amino acid protein orexin A, which has been shown to be associated with performance and post-traumatic stress disorder (Deadwyler et al., 2007, Strawn et al., 2010, Hagen et al., 2013). Histatin-3 is also known to exhibit antibacterial and antifungal activities. Specifically, it is effective against C. neoformans, C. albicans, and P. gingivalis (Tsai et al., 1996, Tsai and Bobek, 1997, Gusman et al., 2001). Consequently, changes in the amount of histatin-3 may indicate a response of the immune system after experiencing acute stress.
Statistical analyses indicated that the protein(s) in this band did not change significantly in medical resident saliva in response to acute stress due to the emergency medicine simulation. It also showed higher variability when comparing the boxplots of the ratio of the proteins at the various time points (Figure 3). This is likely a result of the limited number of samples (n=5) and variability of densitometry data obtained by scanning SDS-PAGE gels containing 30 µL of saliva samples (run #4). Therefore, the data presumptively indicates that while some changes occurred, they were not significant in this very small sample size, but this result should be confirmed using a larger sample size.
As with many other proteins, salivary alpha-amylase and histatin-3 exhibit circadian rhythms. Alpha-amylase’s maximum is in the late afternoon, and its minimum is in the morning (Soo-Quee Koh and Choon-Huat Koh, 2007). The secretion of histatins is similar, and it parallels the flow rate of saliva with a maximal peak occurring in the late afternoon (Dawes, 1972, Sabatini and Azen, 1989, Castagnola et al., 2002). These circadian rhythms were not expected to contribute greatly to present analyses though because the saliva was collected over a relatively short time period between pre- and post-emergency medicine simulation samples, minimizing any circadian rhythm influence.
This study further demonstrated that the excretion of salivary proteins can change due to stress as shown previously for salivary proteins such as alpha-amylase and cystatin-S (Bosch et al., 2002, Groer et al., 2010, Trueba et al., 2012, McGraw et al., 2013, Strahler and Ziegert, 2015, Valentin et al., 2015). Most of previous studies used assays to examine a small number of analytes and determine if occupational simulations cause stress. Trueba et al. observed an increase in salivary alpha-amylase and cystatin-S using a proteomics approach. The primary purpose of their study was to determine how stress affects people with asthma using Trier Social Stress Test, which is a laboratory-induced stressor. Present study employed proteomics to investigate how the salivary proteins of individuals in a high stress occupation change in response to acute stress, which was induced using a more realistic, emergency medicine scenario.
As expected, a small inter-person variability in the relative amount of the four protein bands at each time point was observed (Figure 3). Statistical analyses indicated that the amounts of alpha-amylase and cystatins significantly increased upon acute stress compared to both non-stress time points, while the ~26 kDa protein was significantly higher compared to the pre-emergency medicine simulation time point. The low-molecular weight band showed greater variability which may be significant, but the sample size for statistical analyses was extremely limited (n=5) for this protein band.
Furthermore, it was determined that the emergency medicine simulation induced acute stress in the medical residents by performing a salivary alpha-amylase kinetic enzyme assay. For all the samples that were analyzed (residents 1–7), the highest alpha-amylase activity was observed in the saliva collected after the emergency medicine simulation (Table S-3 and Figure S-5). For most of the residents, the alpha-amylase activity at the wake and pre-emergency medicine simulation time points was similar. Consequently, the salivary alpha-amylase assay indicated that the simulation resulted in a state of acute stress in this cohort of medical residents.
Overall, there was a decrease in salivary cortisol from the pre-simulation to post-simulation time point (Figure S-6 and Table S-6). In addition, the amount of cortisol upon waking the next morning was higher than after the simulation. The decrease in salivary cortisol and increase in salivary alpha-amylase for medical residents performing the simulations is in good agreement with a similar study in which high-fidelity simulations in pre-hospital emergency medicine training were used (Valentin et al., 2015). Consequently, it can be speculated that a panel of protein biomarkers of stress can be discovered in saliva and can be used in conjunction with salivary cortisol concentration to monitor acute stress, but such a hypothesis will need to be confirmed in a high-throughput study, potentially using LC-ESI-MS/MS quantitation and involving more human subjects undergoing stress.
It should be acknowledged that certain limitations existed in this preliminary proteomics study of the effect of acute stress on saliva. The major limitation is that only eight medical residents were able to be recruited for the study. The small sample size increases the possibility of false-positive results. Consequently, the statistically significant increase in the amount of salivary alpha-amylase and type-S cystatins needs to be confirmed in a larger population. Using a larger sample population will further validate that the increase in the given salivary proteins is due to acute stress and determine if the differences in protein amounts can be detected by devices that would enable monitoring in the workplace environment. Additionally, a larger cohort would enable the investigation of possible sex-specific differences in the expression of salivary proteins during the stressful scenarios. Moreover, the limited volume of saliva made additional studies, such as quantification of different forms of cystatin (cystatin-S, -SA, or -SN) and other proteins of interest, unfeasible. Furthermore, this study was not designed to explore how stress affects performance and how performance relates to salivary protein expression.
Additionally, to completely eliminate any circadian rhythm effects, an optimal control (i.e., non-stressed) sample would be collected on a day before or after the simulation when the residents do not perform a stressful task, but at the same time that they performed the emergency medicine simulation (~9:30 am). However, this paradigm was not possible in the current study due to interference with the residents’ daily schedule and training. This interference with their schedule also precluded the use of questionnaires that would allow for the comparison of the individuals’ perceived stress levels from performing the emergency medicine simulation and their correlation with changes in salivary proteins.
5. Conclusion
This study utilized a combination of gel electrophoresis, nanoHPLC, and mass spectrometry to examine salivary proteins from eight first-year medical residents participating in emergency medicine simulations to investigate potential biomarkers of acute stress. Densitometric analyses revealed changes in salivary alpha-amylase, a ~26 kDa band, cystatins, and a low-molecular weight (<10 kDa) band following the emergency medicine simulation. As indicated using the Wilcoxon signed-rank test and Holm-Bonferroni method, the relative abundances of alpha-amylase and type-S cystatins changed significantly after the emergency medicine simulations compared to both the pre-emergency medicine simulations and waking time points. The relative amount of the ~26 kDa protein band changed significantly when compared to the pre-emergency medicine simulation time point but not when compared to the waking time point. In conclusion, salivary alpha-amylase and type-S cystatins may be considered putative protein biomarkers of acute stress in medical residents.
Supplementary Material
Acknowledgments
The emergency medicine simulations were performed in the Interprofessional Immersive Simulation Center at the University of Toledo College of Medicine. Authors would like to thank Dr. Brent D. Cameron for providing samples of synthetic histatin-3 protein. Also thanked is Dr. White’s and Dr. Liu’s graduate statistics consulting class (MATH 6610, Statistical Consulting) for discussion of statistical data.
Funding
This work was supported by Air Force Office of Scientific Research Award # 13RSL135, NIH/NIDCR grant DE023418, and partial matching funds from the University of Toledo. The MALDI-MS instrument was acquired using funding from NSF-MRI grant 0923184. The ESI-Orbitrap Fusion Tribrid mass spectrometer and nanoHPLC were acquired using funding from the Air Force Office of Scientific Research DURIP 14RT0605 grant.
Footnotes
Disclosure of interest
The authors report no conflicts of interest.
Contributor Information
Rachel K. Marvin, University of Toledo, Department of Chemistry and Biochemistry, MS 602, 2801 W. Bancroft St., Toledo, Ohio, 43606, USA
Muncharie B. Saepoo, University of Toledo, Department of Neuroscience, MS 1007, 3000 Arlington Ave, Toledo, Ohio, 43614, USA
Simiao Ye, University of Toledo, Department of Mathematics and Statistics, 2801 W. Bancroft St., Toledo, Ohio, 43606, USA.
Donald B. White, University of Toledo, Department of Mathematics and Statistics, 2801 W. Bancroft St., Toledo, Ohio, 43606, USA
Rong Liu, University of Toledo, Department of Mathematics and Statistics, 2801 W. Bancroft St., Toledo, Ohio, 43606, USA.
Kenneth Hensley, Arkansas College of Osteopathic Medicine, Department of Biochemistry, Cellular and Molecular Biology, 7000 Chad Colley Blvd, Fort Smith, Arkansas, 72916, USA.
Paul Rega, University of Toledo, Department of Emergency Medicine, MS 1088, 3600 Arlington Ave, Toledo, Ohio 43614, USA.
Viviane Kazan, University of Toledo, Department of Emergency Medicine, MS 1088, 3600 Arlington Ave, Toledo, Ohio 43614, USA.
David R. Giovannucci, University of Toledo, Department of Neuroscience, MS 1007, 3000 Arlington Ave, Toledo, Ohio, 43614, USA
Dragan Isailovic, University of Toledo, Department of Chemistry and Biochemistry, MS 602, 2801 W. Bancroft St., Toledo, Ohio, 43606, USA.
References
- Al-Tarawneh SK, Border MB, Dibble CF, Bencharit S. Defining Salivary Biomarkers Using Mass Spectrometry-Based Proteomics: A Systematic Review. OMICS: A Journal of Integrative Biology. 2011;15:353–361. doi: 10.1089/omi.2010.0134. [DOI] [PMC free article] [PubMed] [Google Scholar]
- Amado FM, Vitorino RM, Domingues PM, Lobo MJ, Duarte JA. Analysis of the human saliva proteome. Expert Review of Proteomics. 2005;2:521–39. doi: 10.1586/14789450.2.4.521. [DOI] [PubMed] [Google Scholar]
- Amado FML, Ferreira RP, Vitorino R. One decade of salivary proteomics: Current approaches and outstanding challenges. Clinical Biochemistry. 2013;46:506–517. doi: 10.1016/j.clinbiochem.2012.10.024. [DOI] [PubMed] [Google Scholar]
- Bandhakavi S, Stone MD, Onsongo G, Van Riper SK, Griffin TJ. A Dynamic Range Compression and Three-Dimensional Peptide Fractionation Analysis Platform Expands Proteome Coverage and the Diagnostic Potential of Whole Saliva. Journal of Proteome Research. 2009;8:5590–5600. doi: 10.1021/pr900675w. [DOI] [PMC free article] [PubMed] [Google Scholar]
- Beeley JA, Khoo KS, Lamey P-J. Two-dimensional electrophoresis of human parotid salivary proteins from normal and connective tissue disorder subjects using immobilised pH gradients. Electrophoresis. 1991a;12:493–499. doi: 10.1002/elps.1150120707. [DOI] [PubMed] [Google Scholar]
- Beeley JA, Sweeney D, Lindsay JCB, Buchanan ML, Sarna L, Khoo KS. Sodium dodecyl sulphate-polyacrylamide gel electrophoresis of human parotid salivary proteins. Electrophoresis. 1991b;12:1032–1041. doi: 10.1002/elps.1150121207. [DOI] [PubMed] [Google Scholar]
- Bosch JA, Ring C, De Geus EJC, Veerman ECI, Nieuw Amerongen AV. International Review of Neurobiology. Academic Press; 2002. Stress and secretory immunity; pp. 213–253. [DOI] [PubMed] [Google Scholar]
- Brandão E, Soares S, Mateus N, De Freitas V. Human saliva protein profile: Influence of food ingestion. Food Research International. 2014;64:508–513. doi: 10.1016/j.foodres.2014.07.022. [DOI] [PubMed] [Google Scholar]
- Castagnola M, Cabras T, Denotti G, Fadda MB, Gambarini G, Lupi A, Manca I, Onnis G, Piras V, Soro V, Tambaro S, Messana I. Circadian Rhythms of Histatin 1, Histatin 3, Histatin 5, Statherin and Uric Acid in Whole Human Saliva Secretion. Biological Rhythm Research. 2002;33:213–222. [Google Scholar]
- Castagnola M, Cabras T, Iavarone F, Fanali C, Nemolato S, Peluso G, Bosello SL, Faa G, Ferraccioli G, Messana I. The human salivary proteome: a critical overview of the results obtained by different proteomic platforms. Expert Review of Proteomics. 2012;9:33–46. doi: 10.1586/epr.11.77. [DOI] [PubMed] [Google Scholar]
- Castagnola M, Cabras T, Vitali A, Sanna MT, Messana I. Biotechnological implications of the salivary proteome. Trends in Biotechnology. 2011;29:409–418. doi: 10.1016/j.tibtech.2011.04.002. [DOI] [PubMed] [Google Scholar]
- Castagnola M, Inzitari R, Rossetti DV, Olmi C, Cabras T, Piras V, Nicolussi P, Sanna MT, Pellegrini M, Giardina B, Messana I. A Cascade of 24 Histatins (Histatin 3 Fragments) in Human Saliva: Suggestions for a Pre-Secretory Sequential Cleavage Pathway. Journal of Biological Chemistry. 2004;279:41436–41443. doi: 10.1074/jbc.M404322200. [DOI] [PubMed] [Google Scholar]
- Clarke S, Horeczko T, Cotton D, Bair A. Heart rate, anxiety and performance of residents during a simulated critical clinical encounter: a pilot study. BMC Medical Education. 2014;14:1–8. doi: 10.1186/1472-6920-14-153. [DOI] [PMC free article] [PubMed] [Google Scholar]
- Dawes C. Circadian rhythms in human salivary flow rate and composition. The Journal of Physiology. 1972;220:529–545. doi: 10.1113/jphysiol.1972.sp009721. [DOI] [PMC free article] [PubMed] [Google Scholar]
- De Jong EP, Van Riper SK, Koopmeiners JS, Carlis JV, Griffin TJ. Sample collection and handling considerations for peptidomic studies in whole saliva; implications for biomarker discovery. Clinica Chimica Acta. 2011;412:2284–2288. doi: 10.1016/j.cca.2011.08.023. [DOI] [PMC free article] [PubMed] [Google Scholar]
- Deadwyler SA, Porrino L, Siegel JM, Hampson RE. Systemic and Nasal Delivery of Orexin-A (Hypocretin-1) Reduces the Effects of Sleep Deprivation on Cognitive Performance in Nonhuman Primates. The Journal of Neuroscience. 2007;27:14239–14247. doi: 10.1523/JNEUROSCI.3878-07.2007. [DOI] [PMC free article] [PubMed] [Google Scholar]
- Denny P, Hagen FK, Hardt M, Liao L, Yan W, Arellanno M, Bassilian S, Bedi GS, Boontheung P, Cociorva D, Delahunty CM, Denny T, Dunsmore J, Faull KF, Gilligan J, Gonzalez-Begne M, Halgand F, Hall SC, Han X, Henson B, Hewel J, Hu S, Jeffrey S, Jiang J, Loo JA, Ogorzalek Loo RR, Malamud D, Melvin JE, Miroshnychenko O, Navazesh M, Niles R, Park SK, Prakobphol A, Ramachandran P, Richert M, Robinson S, Sondej M, Souda P, Sullivan MA, Takashima J, Than S, Wang J, Whitelegge JP, Witkowska HE, Wolinsky L, Xie Y, Xu T, Yu W, Ytterberg J, Wong DT, Yates JR, Fisher SJ. The Proteomes of Human Parotid and Submandibular/Sublingual Gland Salivas Collected as the Ductal Secretions. Journal of Proteome Research. 2008;7:1994–2006. doi: 10.1021/pr700764j. [DOI] [PMC free article] [PubMed] [Google Scholar]
- Deutsch O, Fleissig Y, Zaks B, Krief G, Aframian DJ, Palmon A. An approach to remove alpha amylase for proteomic analysis of low abundance biomarkers in human saliva. Electrophoresis. 2008;29:4150–4157. doi: 10.1002/elps.200800207. [DOI] [PubMed] [Google Scholar]
- Ghafouri B, Tagesson C, Lindahl M. Mapping of proteins in human saliva using two-dimensional gel electrophoresis and peptide mass fingerprinting. Proteomics. 2003;3:1003–1015. doi: 10.1002/pmic.200300426. [DOI] [PubMed] [Google Scholar]
- Groer M, Murphy R, Bunnell W, Salomon K, Van Eepoel J, Rankin B, White K, Bykowski C. Salivary Measures of Stress and Immunity in Police Officers Engaged in Simulated Critical Incident Scenarios. Journal of Occupational and Environmental Medicine. 2010;52:595–602. doi: 10.1097/JOM.0b013e3181e129da. [DOI] [PubMed] [Google Scholar]
- Gusman H, Travis J, Helmerhorst EJ, Potempa J, Troxler RF, Oppenheim FG. Salivary Histatin 5 Is an Inhibitor of Both Host and Bacterial Enzymes Implicated in Periodontal Disease. Infection and Immunity. 2001;69:1402–1408. doi: 10.1128/IAI.69.3.1402-1408.2001. [DOI] [PMC free article] [PubMed] [Google Scholar]
- Hagen J, Lyon W, Chushak Y, Tomczak M, Naik R, Stone M, Kelley-Loughnane N. Detection of Orexin A Neuropeptide in Biological Fluids Using a Zinc Oxide Field Effect Transistor. ACS Chemical Neuroscience. 2013;4:444–453. doi: 10.1021/cn300159e. [DOI] [PMC free article] [PubMed] [Google Scholar]
- Hardt M, Thomas LR, Dixon SE, Newport G, Agabian N, Prakobphol A, Hall SC, Witkowska HE, Fisher SJ. Toward Defining the Human Parotid Gland Salivary Proteome and Peptidome: Identification and Characterization Using 2D SDS−PAGE, Ultrafiltration, HPLC, and Mass Spectrometry. Biochemistry. 2005;44:2885–2899. doi: 10.1021/bi048176r. [DOI] [PubMed] [Google Scholar]
- Hu S, Loo JA, Wong DT. Human body fluid proteome analysis. Proteomics. 2006;6:6326–6353. doi: 10.1002/pmic.200600284. [DOI] [PMC free article] [PubMed] [Google Scholar]
- Hu S, Xie Y, Ramachandran P, Ogorzalek Loo RR, Li Y, Loo JA, Wong DT. Large-scale identification of proteins in human salivary proteome by liquid chromatography/mass spectrometry and two-dimensional gel electrophoresis-mass spectrometry. Proteomics. 2005;5:1714–1728. doi: 10.1002/pmic.200401037. [DOI] [PubMed] [Google Scholar]
- Isemura S, Saitoh E, Sanada K, Minakata K. Identification of full-sized forms of salivary (S-type) cystatins (cystatin SN, cystatin SA, cystatin S, and two phosphorylated forms of cystatin S) in human whole saliva and determination of phosphorylation sites of cystatin S. The Journal of Biochemistry. 1991;110:648–54. doi: 10.1093/oxfordjournals.jbchem.a123634. [DOI] [PubMed] [Google Scholar]
- Käll L, Storey JD, Maccoss MJ, Noble WS. Assigning Significance to Peptides Identified by Tandem Mass Spectrometry Using Decoy Databases. Journal of Proteome Research. 2008;7:29–34. doi: 10.1021/pr700600n. [DOI] [PubMed] [Google Scholar]
- Lupi A, Messana I, Denotti G, Schininà ME, Gambarini G, Fadda MB, Vitali A, Cabras T, Piras V, Patamia M, Cordaro M, Giardina B, Castagnola M. Identification of the human salivary cystatin complex by the coupling of high-performance liquid chromatography and ion-trap mass spectrometry. Proteomics. 2003;3:461–467. doi: 10.1002/pmic.200390060. [DOI] [PubMed] [Google Scholar]
- Marrelli M, Gentile S, Palmieri F, Paduano F, Tatullo M. Correlation between Surgeon’s Experience, Surgery Complexity and the Alteration of Stress Related Physiological Parameters. Plos One. 2014;9:1–8. doi: 10.1371/journal.pone.0112444. [DOI] [PMC free article] [PubMed] [Google Scholar]
- Mcgraw LK, Out D, Hammermeister JJ, Ohlson CJ, Pickering MA, Granger DA. Nature, correlates, and consequences of stress-related biological reactivity and regulation in Army nurses during combat casualty simulation. Psychoneuroendocrinology. 2013;38:135–144. doi: 10.1016/j.psyneuen.2012.05.009. [DOI] [PubMed] [Google Scholar]
- Messana I, Inzitari R, Fanali C, Cabras T, Castagnola M. Facts and artifacts in proteomics of body fluids. What proteomics of saliva is telling us? Journal of Separation Science. 2008;31:1948–1963. doi: 10.1002/jssc.200800100. [DOI] [PubMed] [Google Scholar]
- Millea KM, Krull IS, Chakraborty AB, Gebler JC, Berger SJ. Comparative profiling of human saliva by intact protein LC/ESI-TOF mass spectrometry. Biochimica et Biophysica Acta - Proteins and Proteomics. 2007;1774:897–906. doi: 10.1016/j.bbapap.2007.04.017. [DOI] [PubMed] [Google Scholar]
- Müller MP, Hänsel M, Fichtner A, Hardt F, Weber S, Kirschbaum C, Rüder S, Walcher F, Koch T, Eich C. Excellence in performance and stress reduction during two different full scale simulator training courses: A pilot study. Resuscitation. 2009;80:919–924. doi: 10.1016/j.resuscitation.2009.04.027. [DOI] [PubMed] [Google Scholar]
- Naumova EA, Sandulescu T, Bochnig C, Khatib PA, Lee W-K, Zimmer S, Arnold WH. Dynamic changes in saliva after acute mental stress. Scientific Reports. 2014:4. doi: 10.1038/srep04884. [DOI] [PMC free article] [PubMed] [Google Scholar]
- Obayashi K. Salivary mental stress proteins. Clinica Chimica Acta. 2013;425:196–201. doi: 10.1016/j.cca.2013.07.028. [DOI] [PubMed] [Google Scholar]
- Perkins DN, Pappin DJ, Creasy DM, Cottrell JS. Probability-based protein identification by searching sequence databases using mass spectrometry data. Electrophoresis. 1999;20:3551–67. doi: 10.1002/(SICI)1522-2683(19991201)20:18<3551::AID-ELPS3551>3.0.CO;2-2. [DOI] [PubMed] [Google Scholar]
- Ryan CM, Souda P, Halgand F, Wong DT, Loo JA, Faull KF, Whitelegge JP. Confident assignment of intact mass tags to human salivary cystatins using top-down Fourier-transform ion cyclotron resonance mass spectrometry. Journal of the American Society for Mass Spectrometry. 2011;21:908–917. doi: 10.1016/j.jasms.2010.01.025. [DOI] [PMC free article] [PubMed] [Google Scholar]
- Sabatini LM, Azen EA. Histatins, a family of salivary histidine-rich proteins, are encoded by at least two loci (HIS1 and HIS2) Biochemical and Biophysical Research Communications. 1989;160:495–502. doi: 10.1016/0006-291x(89)92460-1. [DOI] [PubMed] [Google Scholar]
- Scarano E, Fiorita A, Picciotti PM, Passali GC, Calo L, Cabras T, Inzitari R, Fanali C, Messana I, Castagnola M, Paludetti G. Proteomics of saliva: personal experience. Acta Otorhinolaryngol Ital. 2010;30:125–30. [PMC free article] [PubMed] [Google Scholar]
- Schulz BL, Cooper-White J, Punyadeera CK. Saliva proteome research: current status and future outlook. Critical Reviews in Biotechnology. 2013;33:246–59. doi: 10.3109/07388551.2012.687361. [DOI] [PubMed] [Google Scholar]
- Senko MW, Remes PM, Canterbury JD, Mathur R, Song Q, Eliuk SM, Mullen C, Earley L, Hardman M, Blethrow JD, Bui H, Specht A, Lange O, Denisov E, Makarov A, Horning S, Zabrouskov V. Novel Parallelized Quadrupole/Linear Ion Trap/Orbitrap Tribrid Mass Spectrometer Improving Proteome Coverage and Peptide Identification Rates. Analytical Chemistry. 2013;85:11710–11714. doi: 10.1021/ac403115c. [DOI] [PubMed] [Google Scholar]
- Shevchenko A, Tomas H, Havlis J, Olsen JV, Mann M. In-gel digestion for mass spectrometric characterization of proteins and proteomes. Nature Protocols. 2007;1:2856–2860. doi: 10.1038/nprot.2006.468. [DOI] [PubMed] [Google Scholar]
- Soo-Quee Koh D, Choon-Huat Koh G. The use of salivary biomarkers in occupational and environmental medicine. Occupational and Environmental Medicine. 2007;64:202–210. doi: 10.1136/oem.2006.026567. [DOI] [PMC free article] [PubMed] [Google Scholar]
- Sousa-Pereira PD, Abrantes J, Pinheiro A, Colaço B, Vitorino R, Esteves PJ. Evolution of C, D and S-Type Cystatins in Mammals: An Extensive Gene Duplication in Primates. Plos One. 2014;9:e109050. doi: 10.1371/journal.pone.0109050. [DOI] [PMC free article] [PubMed] [Google Scholar]
- Strahler J, Ziegert T. Psychobiological stress response to a simulated school shooting in police officers. Psychoneuroendocrinology. 2015;51:80–91. doi: 10.1016/j.psyneuen.2014.09.016. [DOI] [PubMed] [Google Scholar]
- Strawn JR, Pyne-Geithman GJ, Ekhator NN, Horn PS, Uhde TW, Shutter LA, Baker DG, Geracioti TD., Jr Low cerebrospinal fluid and plasma orexin-A (hypocretin-1) concentrations in combat-related posttraumatic stress disorder. Psychoneuroendocrinology. 2010;35:1001–1007. doi: 10.1016/j.psyneuen.2010.01.001. [DOI] [PubMed] [Google Scholar]
- Trueba AF, Mizrachi D, Auchus RJ, Vogel PD, Ritz T. Effects of psychosocial stress on the pattern of salivary protein release. Physiology & Behavior. 2012;105:841–849. doi: 10.1016/j.physbeh.2011.10.014. [DOI] [PubMed] [Google Scholar]
- Tsai H, Bobek LA. Human salivary histatin-5 exerts potent fungicidal activity against Cryptococcus neoformans. Biochimica et Biophysica Acta - General Subjects. 1997;1336:367–369. doi: 10.1016/s0304-4165(97)00076-7. [DOI] [PubMed] [Google Scholar]
- Tsai H, Raj PA, Bobek LA. Candidacidal activity of recombinant human salivary histatin-5 and variants. Infection and Immunity. 1996;64:5000–7. doi: 10.1128/iai.64.12.5000-5007.1996. [DOI] [PMC free article] [PubMed] [Google Scholar]
- UCLA Dental Research Institute. Salivary Proteome Knowledge Base [online] 2005 http://hspp.dent.ucla.edu/cgi-bin/hspmscgi-bin/search_pro_c.cgi [5/10/2016]
- Valentin B, Grottke O, Skorning M, Bergrath S, Fischermann H, Rortgen D, Mennig MT, Fitzner C, Muller MP, Kirschbaum C, Rossaint R, Beckers SK. Cortisol and alpha-amylase as stress response indicators during pre-hospital emergency medicine training with repetitive high-fidelity simulation and scenarios with standardized patients. Scandinavian Journal of Trauma, Resuscitation, and Emergency Medicine. 2015;23:31. doi: 10.1186/s13049-015-0110-6. [DOI] [PMC free article] [PubMed] [Google Scholar]
- Vitorino R, Lobo MJC, Ferrer-Correira AJ, Dubin JR, Tomer KB, Domingues PM, Amado FML. Identification of human whole saliva protein components using proteomics. Proteomics. 2004;4:1109–1115. doi: 10.1002/pmic.200300638. [DOI] [PubMed] [Google Scholar]
- Wu S, Brown JN, Tolić N, Meng D, Liu X, Zhang H, Zhao R, Moore RJ, Pevzner P, Smith RD, Paša-Tolić L. Quantitative analysis of human salivary gland-derived intact proteome using top-down mass spectrometry. Proteomics. 2014;14:1211–1222. doi: 10.1002/pmic.201300378. [DOI] [PubMed] [Google Scholar]
- Yan W, Apweiler R, Balgley BM, Boontheung P, Bundy JL, Cargile BJ, Cole S, Fang X, Gonzalez-Begne M, Griffin TJ, Hagen F, Hu S, Wolinsky LE, Lee CS, Malamud D, Melvin JE, Menon R, Mueller M, Qiao R, Rhodus NL, Sevinsky JR, States D, Stephenson JL, Than S, Yates JR, Yu W, Xie H, Xie Y, Omenn GS, Loo JA, Wong DT. Systematic comparison of the human saliva and plasma proteomes. Proteomics - Clinical Applications. 2009;3:116–134. doi: 10.1002/prca.200800140. [DOI] [PMC free article] [PubMed] [Google Scholar]
Associated Data
This section collects any data citations, data availability statements, or supplementary materials included in this article.