

Abstract
Saliva, a biological fluid, is a promising candidate for novel approaches to prognosis, clinical diagnosis, monitoring and management of patients with both oral and systemic diseases. However, to date, saliva has not been widely investigated as a biomarker for radiation exposure. Since white blood cells are also present in saliva, it should theoretically be possible to investigate the transcriptional biomarkers of radiation exposure classically studied in whole blood. Therefore, we collected whole blood and saliva samples from eight head and neck cancer patients before the start of radiation treatment, at mid-treatment and after treatment. We then used a panel of five genes: BAX, BBC3, CDKN1A, DDB2 and MDM2, designated for assessing radiation dose in whole blood to evaluate gene expression changes that can occur during radiotherapy. The results revealed that the expression of the five genes did not change in whole blood. However, in saliva, CDKN1A and DDB2 were significantly overexpressed at the end, compared to the start, of radiotherapy, and MDM2 was significantly underexpressed between mid-treatment and at the end of treatment. Interestingly, CDKN1A and DDB2 expressions also showed an increasing monotonic relationship with total radiation dose received during radiotherapy. To our knowledge, these results show for the first time the ability to detect gene expression changes in saliva after head and neck cancer radiotherapy, and pave the way for further promising studies validating saliva as a minimally invasive means of biofluid collection to directly measure radiation dose escalation during treatment.
INTRODUCTION
Biological markers of radiation response may be an important tool in the management of radiation therapy as well as for triage of potentially exposed populations in a radiation mass casualty event. The dicentric chromosomal assay is currently the gold standard in biodosimetry (1). However, this approach is time consuming and highly technique dependent, and detection of very low or high dose is limited. Because of these limitations, studies published over the past several years have suggested the development of gene expression profiles in biological fluid, especially in blood, as an alternative approach for identifying exposed individuals and assessing absorbed dose (2–8). These studies have shown promising results indicating that distinctive gene expression patterns could be highly correlated with different radiation doses. Although blood is the primary body fluid studied, saliva is also highly desirable for biomarker development (9). Indeed, saliva testing carries many advantages over blood: collection is easy, with the possibility of self-collection, while blood sampling often requires highly trained phlebotomists; the procedure is noninvasive, with minimal discomfort to subjects, allowing repeated sampling and facilitating approval from ethical committees; samples are safer to handle, ship and store; the procedure is economical, since saliva is easily collected, shipped and stored, resulting in decreased overall cost to patients and health care providers (10).
Despite these advantages, saliva has not been widely investigated in the context of radiation exposure (11). In two recent studies, salivary biochemical markers were investigated after total-body irradiation (TBI) in small animals. Soni et al. analyzed electrolytes, total protein, urea and amylase as potential acute toxicity parameters (12). Moreover, Laiakis et al. conducted global metabolomics profiling to identify radiation and dose-specific biomarkers (13). Moore et al. used a 90-analyte protein assay panel to identify three proteins (MCP-1, IL8 and ICAM-1) and demonstrated radiation responsiveness in saliva samples collected from patients before and after TBI, however, few other studies have been performed in humans (14).
Saliva samples contain buccal cells and leucocytes, so in addition to secreted proteins and electrolytes, it should theoretically be possible to investigate the transcriptional biomarkers of exposure classically studied in blood lymphocytes, as long as enough cells can be collected (11). Throughout the literature there is significant divergence on the number of leukocytes in normal saliva, ranging from 2 to 136,000 cells/ml, and in patients with inflammation of the oral cavity, this number was found to reach up to 1.1′ 106/ml (15). Several studies revealed that mouthwash or whole saliva samples are superior to buccal swabs for obtaining high molecular weight DNA, suggesting that blood cells may be an important source of high-quality genetic material in saliva (16–18). Moreover, the use of transcriptomic techniques, such as quantitative PCR (qPCR), microarray analysis and deep sequencing analysis, demonstrated the feasibility to detect and define the salivary transcriptome in whole saliva as well as cell-free saliva (19, 20).
Here we performed a pilot study to determine if some detectable gene expression changes can occur in saliva during radiotherapy in head and neck cancer patients, using a radiation-responsive gene signature developed in white blood cells.
MATERIALS AND METHODS
Patient Recruitment
Eight primary head and neck squamous cell cancer patients receiving radiotherapy and/or chemotherapy were recruited from January to July 2015. Patient characteristics are summarized in Table 1. Three-dimensional treatment planning with 3D-CRT or IMRT was performed in all patients. Treatment planning was based on a computed tomography (CT) scan of the head and neck region, with a slice thickness of 2.5 mm (Lightspeed Big Bore; General Electric, Fairfield, CT). Patients were immobilized with a custom-made thermoplastic head-neck-shoulder mask. The Varian Eclipse™ 11.1 planning system was used for the treatment planning (Varian Medical Systems Inc., Palo Alto, CA). Patients receiving 3D-CRT were treated with 6-MV photons from a linear accelerator (Varian iX, 120 MLC). IMRT was based on the volumetric modulated arc therapy (VMAT) approach with two arc 6-MV beams. The planning strategy was to cover 100% of the planning target volume (PTV) with 95% of the prescribed dose. The mean dose given to at least one parotid gland was limited to 26 Gy without compromising the PTV. The maximum dose to the spinal cord was 45 Gy. Irradiation planning was performed in accordance with the Commission on Radiation Units and Measurements (ICRU Report Nos. 50 and 62). Planning, performance and quality assurance were undertaken according to ICRU Report No. 83. Conventional fractionation schedules were used: 1.8–2.0 Gy/day, 5 days per week. Each patient received a total dose of 64–70 Gy (median 67.5 Gy). Overall treatment time was between 41 to 54 days (median 47.4 days). Patients who received concurrent chemotherapy were prescribed weekly intravenous cisplatin 40 mg/m2, except for patient 2 who received 100 mg/m2. Overall chemotherapy time was between 31 to 58 days (median 51 days). Some patients developed relevant grade 3 radiation toxicity, such as oral mucositis and xerostomia, based on the Common Terminology Criteria for Adverse Events, version 4.0 (CTCAE v4.0) (Table 1). Patients with radiotoxicity received artificial saliva (OraPharma NeutraSalt: Bridgewater, NJ), mouthwash (magic mouthwash) and/or cevimeline hydrochloride (Evoxac).
TABLE 1.
Clinicopathological Characteristics of Eight Head and Neck Cancer Patients
| Patient ID | Sex | Age (years) | Cancer site | RT dose (Gy) |
Chemotherapy | Chemotherapy length (days) | Oral mucositis | Xerostomia | Treatment against radiotoxicity | HPV status | |
|---|---|---|---|---|---|---|---|---|---|---|---|
| Mid-poin | End-point | ||||||||||
| 1 | M | 64 | Tonsil | 30 | 70 | Yes | 58 | Yes | Yes | Mouthwash, cevimeline hydrochloride | No testing completed |
| 2 | M | 66 | Tonsil | 32 | 66 | Yes | 42 | Yes | Yes | Mouthwash | Positive P16 |
| 3 | M | 73 | Tongue | 34 | 66 | No | NA | Yes | Yes | Mouthwash | No testing completed |
| 4 | F | 58 | Nose | 34 | 60 | No | NA | No | No | – | No testing completed |
| 5 | M | 59 | Tonsil | 30.6 | 71 | Yes | 51 | Yes | Yes | Mouthwash | No testing completed |
| 6 | M | 72 | Tonsil | 30.6 | 69 | Yes | 51 | Yes | Yes | Mouthwash, artificial saliva | Positive P16 |
| 7 | M | 70 | Lymph node | 30 | 66 | Yes | 31 | Yes | Yes | Mouthwash, artificial saliva | Positive P16 |
| 8 | M | 64 | Tonsil | 30 | 70 | No | NA | No | No | Mouthwash, artificial saliva | Positive P16 |
Note. M = male; F = female; NA = not applicable.
Five healthy subjects were also recruited for blood specimen collection under an internal IRB protocol (SHC-IRB-2010-027). All healthy subjects were females between 25 and 50 years old.
Biospecimen Collection and Processing
All blood and saliva biospecimen collections for this study were approved by the Honor Heath IRB (Protocol SHC IRB no. 2014-002) and performed at the Honor Health Research Institute (Shea Campus, Scottsdale, AZ).
Saliva sample collection and processing
Unstimulated saliva samples (up to 4 ml) were collected by spitting into a plastic receptacle at three different times: before radiotherapy, at mid-treatment and after the final radiation treatment. Mid-treatment saliva samples were collected within less than 5 min postirradiation. Ice cubes were given to some patients to stimulate salivation, especially for samples collected during or after radiotherapy. Cell lysis and stabilization buffer (DxCollect®; Rancho Vista, CA) were directly added to the saliva samples with a 2:1 ratio. Samples were transferred to cryotubes and stored at −80°C until analysis.
Blood sample collection and processing
Whole blood samples (up to 5–10 ml) were collected at three different times from head and neck cancer patients concurrently with saliva sample collections: before the start of treatment, at mid-treatment and immediately after the final radiation treatment. Whole blood was collected in BD Vacutainer® citrate tubes (San Jose, CA). Samples were stabilized by adding DxCollect stabilization buffer with a 1:2 ratio and immediately stored at −80°C until analysis.
Whole blood samples were also collected from five healthy subjects. A total of 4 ml of whole blood were collected in sodium heparin tubes and were then immediately irradiated with 1.5, 3 and 6 Gy LINAC photons at a rate of 500 cGy/min. After irradiation, whole blood samples were diluted 1:1 with RPMI 1640 media (Invitrogen™, Carlsbad, CA) supplemented with 10% heat inactivated fetal bovine serum and 1% penicillin/streptomycin (Invitrogen) and incubated for 24 h at 37°C in a humidified shaker incubator with 5% CO2. After incubation, blood culture mix was stabilized by adding DxCollect stabilization buffer with a 1:2 ratio and immediately stored at −80°C until analysis.
Gene Expression Assay: Chemical Ligation-Dependent Probe Amplification (CLPA)
A commercially available assay chemistry test (CLPA; DxTerity Diagnostics Inc.) was used for multiplex gene expression analysis that combines a robust chemical ligation process and a sample stabilization method (http://dxterity.com/). For each reaction, a 50-μl master mix containing CLPA buffer and probes was added to the 100-μl sample and placed in a thermal cycler for the ligation step (5 min at 55°C, 10 min at 80°C, then 55 min at 55°C). When hybridization was complete, 5 μl of Dynabeads™ M-270 Streptavidin were added to each sample and incubated for 5 min at 55°C. Three washes were then performed using a magnetic block for 30 s and 200 μl CLPA wash buffer. A complete PCR mix was prepared (10 μl per reaction) by combining equal volumes of DirectTaq and REDI-Prime (DxTerity Diagnostics Inc.). After the final wash, the beads were resuspended in 10 μl CLPA complete PCR solution and the PCR was performed using the following cycling conditions: 95°C for 2 min followed by 30 cycles (95°C for 10 s, 57°C for 20 s and 72°C for 20 s). Each sample was run in triplicate. PCR product (1 μl) was used to perform the analysis on the capillary electrophoresis (CE) system (ABI 3130xl instrument; Life Technologies, Grand Island, NY). Each PCR product was assayed in duplicate.
Statistical Analysis
Gene expression levels were normalized by nonradiation-responsive MRPS5, MRPS18, CDR2 genes. Signal intensity was determined by the ratio of candidate gene fluorescence value to geometric mean fluorescence value of the three housekeeping genes. Gene expression levels were compared among different radiation doses in samples of healthy subjects using the paired t test [the sample size (n = 5) was too small for the nonparametric test] and among different collection times in head and neck cancer patients using the nonparametric Wilcoxon signed-rank test. The Spearman’s rank correlation coefficient was used to assess dose dependence of the gene expression levels. All tests were two-sided and performed at the 5% level of significance. Analyses were performed with GraphPad Prism version 7.00 for Windows (GraphPad Software Inc., La Jolla, CA).
RESULTS
In multiple microarray studies investigating cellular response to ionizing radiation in whole blood, several genes have been identified whose expression is correlated with total radiation dose (4–7, 21). Despite differing experimen tal protocols (time points, dose, etc.), these biodosimetry studies frequently highlighted a correlation between total radiation dose and the expression level of ten promising candidate genes that were selected for this study: BAX, BBC3, CEPBPB, CDKN1A, DDB2, DEDD, H2AFV, HIST1H3D, MDM2 and TRIB2 (Supplementary Table S1; http://dx.doi.org/10.1667/RR14707.1.S1). To confirm the radiation responsiveness of these genes and validate our gene expression assay, whole blood samples were collected from five healthy individuals, and received a dose of 1.5, 3 or 6 Gy ex vivo irradiation. After 24 h cell culture, multiplex gene expression analysis was performed. Seven genes (BAX, BBC3, CDKN1A, DDB2, DEDD, HIST1H3D and MDM2) were upregulated by radiation exposure compared to the nonirradiated samples (Supplementary Fig. S1; http://dx.doi.org/10.1667/RR14707.1.S1). Among these seven genes, expression of BAX, BBC3, CDKN1A, DDB2 and MDM2 was significantly increased for all received doses of radiation compared to the nonirradiated samples. Interestingly, these five genes were dose-dependently induced. Indeed, the expression of BAX, BBC3, CDKN1A, DDB2 and MDM2 genes showed a monotonic relationship with the radiation dose as shown by the Spearman’s rank correlation, r = 0.7988 (P < 0.0001), r = 0.7911 (P < 0.0001), r = 0.8066 (P < 0.0001), r = 0.9462 (P < 0.0001) and r = 0.8686 (P < 0.0001), respectively (Supplementary Fig. S2; http://dx.doi.org/10.1667/RR14707.1.S1). Therefore, these five genes were then selected for the remainder of the study.
Expression analysis was performed for BAX, BBC3, CDKN1A, DDB2 and MDM2 genes in blood samples of eight head and neck cancer patients. Patient characteristics are summarized in Table 1. Samples were collected for each patient before the start of treatment, at mid-treatment and immediately after the final radiation treatment. Results showed no significant difference in expression of the five genes at the different time points (Fig. 1). We performed the same analysis on unstimulated saliva samples collected from the same eight patients at the same time points. In these results, BAX and BBC3 expression was not altered during radiotherapy (Fig. 2A–B). However, CDKN1A and DDB2 were significantly upregulated over the course of radiotherapy, and their expression from start to finish of radiotherapy was increased by a fold change up to 2.68 (P = 0.0156) and 1.78 (P = 0.0313), respectively (Fig. 2C–D). Analysis at individual levels revealed various patterns and, with the exception of patient 7 and to a lesser extent patient 1, patients showed different expression profiles for each gene (Supplementary Fig. S3; http://dx.doi.org/10.1667/RR14707.1.S1). Although the difference is only significant between the start and the end of radiotherapy, CDKN1A and DDB2 showed a linear increase in expression level with the dose received during radiotherapy, similar to ex vivo irradiated whole blood from healthy individual, where their expression was significantly increased according to the received dose. Indeed, the Spearman’s rank correlation showed an increasing monotonic trend between the expression level of both CDKN1A (r = 0.5515; P = 0.0052) and DDB2 (r = 0.5129; P = 0.0146) and the total dose received over the radiation treatment course (Fig. 3). Moreover, MDM2 was significantly underexpressed (P = 0.0469) between mid-treatment and at the end of treatment by a fold change up to 1.57 (Fig. 2E). Unfortunately, correlation analysis did not show any monotonic relationship between MDM2 expression level and the total dose received over the radiation treatment course (Supplementary Fig. S4; http://dx.doi.org/10.1667/RR14707.1.S1).
FIG. 1.
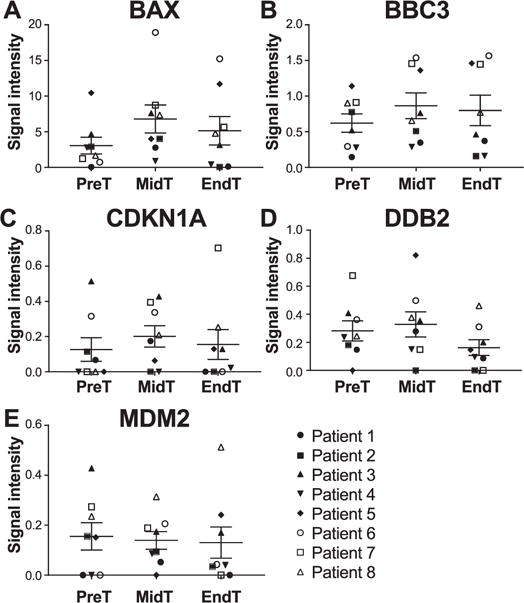
CLPA gene expression profile of BAX (panel A), BBC3 (panel B), CDKN1A (panel C), DDB2 (panel D) and MDM2 (panel E) from whole blood samples of eight head and neck cancer patients. Whole blood samples were collected before the start of treatment (PreT), at mid-treatment (MidT) and at the end of treatment (EndT), and were analyzed with the CLPA assay. The transcript level of the five genes was normalized to the geometric mean of three housekeeping genes (MRPS5, MRPS18, CDR2). Values represent mean ± SEM. *P < 0.05 by Wilcoxon signed-rank test.
FIG. 2.
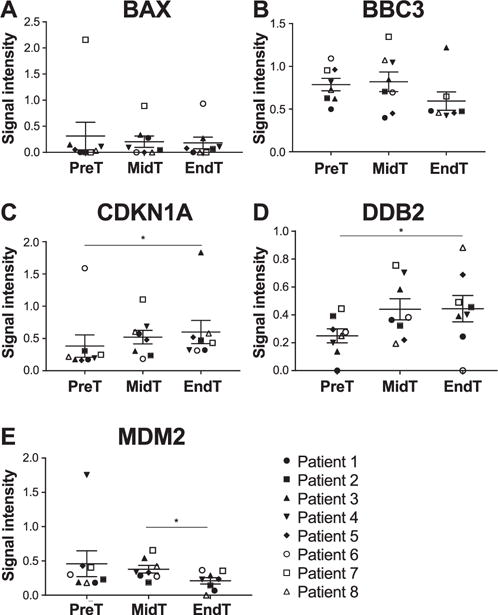
CLPA gene expression profile of BAX (panel A), BBC3 (panel B), CDKN1A (panel C), DDB2 (panel D) and MDM2 (panel E) from saliva samples of eight head and neck cancer patients. Saliva samples were collected before the start of treatment (PreT), at mid-treatment (MidT) and at the end of treatment (EndT), and were analyzed with the CLPA assay. The transcript level of the five genes was normalized to the geometric mean of three housekeeping genes (MRPS5, MRPS18, CDR2). Values represent mean ± SEM. *P < 0.05 by Wilcoxon signed-rank test.
FIG. 3.
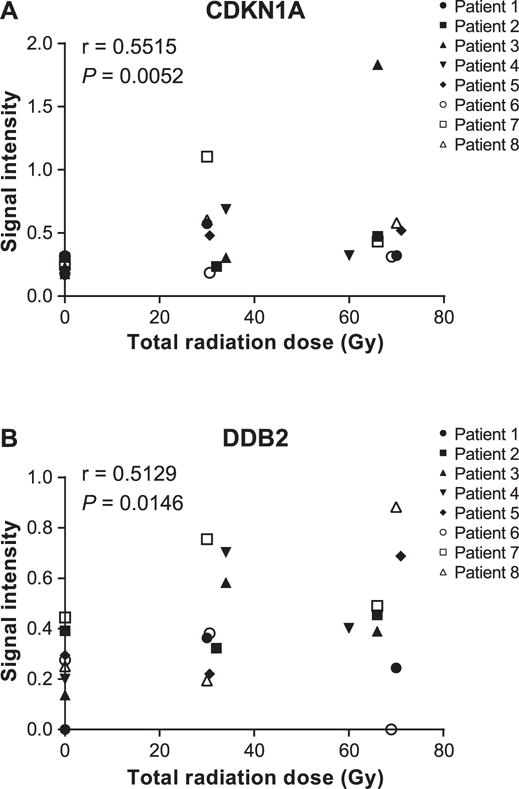
Spearman’s rank correlation between expression level of CDKN1A (panel A) and DDB2 (panel B) in saliva samples of head and neck cancer patients, as represented by normalized intensity values and the total dose received during radiotherapy.
DISCUSSION
In this pilot study, we used five genes (BAX, BBC3, CDKN1A, DDB2 and MDM2) known to be radiation responsive in blood to assess gene expression changes in saliva of eight head and neck cancer patients undergoing radiotherapy. We first assessed the expression level of these five genes in whole blood collected from these patients. Unfortunately, no significant changes in gene expression level during radiotherapy were observed. However, the dose delivered to the head and neck cancer patients’ blood after localized irradiation is low, which may explain why changes were not significant at this level. Although differences are not significant, expression levels are modified during radiotherapy. Thus, further complementary analysis is needed to correlate these genetic patterns with the absorbed dose and possibly highlight significant modifications. Because both protocols widely differ (e.g., ex vivo vs. in vivo irradiation; single 5 Gy dose vs. fractionated 30/60 Gy doses; blood collection 24 h postirradiation vs. collection during a two-month course of radiotherapy), these results do not precisely fit with the whole blood ex vivo irradiation from healthy individuals. We mainly used the ex vivo irradiation experiment to validate the suitability of the selected genes for assessing the total absorbed radiation dose.
Because genetic material from white blood cells is easily accessible in saliva, we then performed the same analysis on saliva samples. Results indicated that CDKN1A and DDB2 were upregulated over the course of radiotherapy. Moreover, even if MDM2 expression level is not correlated with the total radiation dose during radiotherapy; it is underexpressed between mid-treatment and at the end of treatment. To our knowledge, these results highlight for the first time the ability to detect gene expression changes in saliva after localized irradiation for head and neck cancer and the potential of such assays for assessing the absorbed radiation dose. The cyclin-dependent kinase inhibitor 1A (CDKN1A) and DNA damage-binding protein 2 (DDB2) play essential roles in the DNA damage response, by inducing cell cycle arrest and by regulating the nucleotide excision repair (NER), respectively, both induced by p53. Interestingly, CDKN1A expression is regulated by DDB2 to facilitate apoptosis induction in the late phase of the response to severe damage (22). Ionizing radiation activates their transcription and this observation fits with our results. The murine double minute 2 (MDM2) gene encodes a negative regulator of the p53 tumor suppressor (23). The level of MDM2 expression determines the extent to which radiation induces an increase in the activity of the p53 tumor suppressor and so makes MDM2 a critical component of the cellular response to radiation (24). As such, expression of MDM2 is induced in response to DNA damage, and the resulting high levels of MDM2 protein are thought to shorten the length of the cell cycle arrest established by p53 in the radiation response. Our results do not support this observation; we observed a decrease in MDM2 expression level between mid-treatment and at the end of treatment. However, there is evidence that the factors controlling the magnitude of induction of MDM2 differ from those that control the magnitude of induction of other p53 target genes. For example, CDKN1A shows clear dependency on the dose rate of ionizing radiation, whereas MDM2 does not (25). Therefore, we cannot exclude a different in vivo cellular response due to the complex radiotherapy protocol despite the fact that all these genes are primarily overexpressed in response to radiation.
It should be noted that a large number of oral microorganisms are present in saliva and so can be collected by spitting (26). However, the CLPA assay has been designed only for humans and therefore, microbiome genetic material did not distort the analysis. By collecting saliva with this method, we should also have avoided collecting a large quantity of buccal cells. However, most patients experienced oral mucositis and xerostomia involving an important loss of squamous epithelial cells. Those cells were probably present in the samples and so can explain the difference between saliva and blood samples. Moreover, gene expression patterns can also be modified by radiation- or chemotherapy-induced mucositis (27, 28). Therefore, at this stage, it is difficult to say if the gene expression modification that we observed could have been influenced by the development of radiotoxicity. However, neither CDKN1A, DDB2 nor MDM2 seem to be active in the development of oral mucositis, but conversely, are particularly involved in the radiosensitivity status. Gene expression can also be modified by specific drugs or drug combinations (29, 30). Since five out of the eight patients studied here received concomitant chemotherapy with radiotherapy, we could not exclude an effect of chemotherapy drugs on our preliminary data, but due to the small sample size we were not able to analyze each group independently. Additional studies should take into account this potentially confounding factor and clearly distinguish chemoradiotherapy and radiotherapy groups. Furthermore, due to the fractionated nature of the radiotherapy, we cannot conclude with certainty whether the observed changes in gene expression resulted from the accumulating dose of radiation or from increasing time after exposure or both.
A sound knowledge of the adequate dose to prevent toxicity to normal tissues is a fundamental aspect in head and neck cancer radiotherapy and contributes to radio-protection of patients. Thus, a gene expression assay in saliva may be a prompt and reliable test for optimizing the administered of radiotherapy. Moreover, such assays may have potential for estimating the radiation dose received by victims of a mass casualty radiation event. This pilot study shows that salivary gene biomarkers can be detected and their expression modified during head and neck radiotherapy. We show that expression of two genes in particular, CCDKN1A and DDB2, increases during radiation treatment, and is correlated with the cumulative received dose. However, with a number of potentially confounding factors, such as concomitant chemotherapy or the development of oral radiation toxicity, we cannot conclusively ascertain the precise radiation dosimetry role of these genes. Moreover, our low sample size could also explain the moderate correlation that we found between gene expression level and total radiation dose. Therefore, further studies with a greater patient cohort are needed to validate the use of salivary gene biomarkers as an accurate biodosimetric tool. Finally, we selected only five genes previously identified as radiation responsive in blood, but since gene expression changes are measurable in saliva after irradiation, another study allowing greater transcriptomic screening to identify new saliva biomarkers of radiation exposure may also be conceivable.
Supplementary Material
Table S1. List of 10 genes known to be radiation responsive in blood and selected for this study, with their symbol and biological processes.
Fig. S1. CLPA gene expression profile from ex vivo irradiated blood samples. Whole blood samples were collected from five volunteers and irradiated at the doses indicated and analyzed with the CLPA assay.
Fig. S2. Spearman’s rank correlation among expression levels of BAX, BBC3, CDKN1A, DDB2 and MDM2 in whole blood, as represented by normalized intensity values, and the ex vivo radiation dose.
Fig. S3. Saliva gene expression profiles for eight head and neck cancer patients from samples collected before treatment, at mid-treatment and at the end of radiotherapy and analyzed with the CLPA assay.
Fig. S4. Spearman’s rank correlation between expression levels of MDM2 in saliva, as represented by normalized intensity values, and the total radiation dose received during radiotherapy.
Acknowledgments
We thank the members of the Center for Applied Nanobioscience and Medicine for their participation in discussing some of the prior art, especially Dr. Jianing Yang. We also thank Nicole Hank (Imaging Endpoints at Honor Health, Scottsdale, AZ) for providing all clinical data. We are also grateful for the support of the team of research nurses and clinical coordinators at Honor Health Research Institute for their assistance in collecting biospecimens. The authors are appreciative to DxTerity Diagnostics for supplying the CLPA reagents. The authors received financial support from the Center for High-Throughput Minimally-Invasive Radiation Biodosimetry (National Institute of Allergy and Infectious Diseases, grant no. U19 AI067773).
Footnotes
Editor’s note. The online version of this article (DOI: 10.1667/RR14707.1) contains supplementary information that is available to all authorized users.
References
- 1.Blakely WF, Carr Z, Chu MC-M, Dayal-Drager R, Fujimoto K, Hopmeir M, et al. WHO 1st consultation on the development of a global biodosimetry laboratories network for radiation emergencies (BioDoseNet) Radiat Res. 2009;171:127–39. doi: 10.1667/RR1549.1. [DOI] [PubMed] [Google Scholar]
- 2.Amundson SA, Do KT, Shahab S, Bittner M, Meltzer P, Trent J, et al. Identification of potential mRNA biomarkers in peripheral blood lymphocytes for human exposure to ionizing radiation. Radiat Res. 2000;154:342–6. doi: 10.1667/0033-7587(2000)154[0342:iopmbi]2.0.co;2. [DOI] [PubMed] [Google Scholar]
- 3.Amundson SA, Grace MB, McLeland CB, Epperly MW, Yeager A, Zhan Q, et al. Human in vivo radiation-induced biomarkers: gene expression changes in radiotherapy patients. Cancer Res. 2004;64:6368–71. doi: 10.1158/0008-5472.CAN-04-1883. [DOI] [PubMed] [Google Scholar]
- 4.Ghandhi SA, Smilenov LB, Elliston CD, Chowdhury M, Amundson SA. Radiation dose-rate effects on gene expression for human biodosimetry. BMC Med Genomics. 2015;8:22. doi: 10.1186/s12920-015-0097-x. [DOI] [PMC free article] [PubMed] [Google Scholar]
- 5.Paul S, Amundson SA. Development of gene expression signatures for practical radiation biodosimetry. Int J Radiat Oncol Biol Phys. 2008;71:1236–44. doi: 10.1016/j.ijrobp.2008.03.043. [DOI] [PMC free article] [PubMed] [Google Scholar]
- 6.Paul S, Barker CA, Turner HC, McLane A, Wolden SL, Amundson SA. Prediction of in vivo radiation dose status in radiotherapy patients using ex vivo and in vivo gene expression signatures. Radiat Res. 2011;175:257–65. doi: 10.1667/RR2420.1. [DOI] [PMC free article] [PubMed] [Google Scholar]
- 7.Knops K, Boldt S, Wolkenhauer O, Kriehuber R. Gene expression in low- and high-dose-irradiated human peripheral blood lymphocytes: possible applications for biodosimetry. Radiat Res. 2012;178:304–12. doi: 10.1667/rr2913.1. [DOI] [PubMed] [Google Scholar]
- 8.Macaeva E, Saeys Y, Tabury K, Janssen A, Michaux A, Benotmane MA, et al. Radiation-induced alternative transcription and splicing events and their applicability to practical biodosimetry. Sci Rep. 2016;6:19251. doi: 10.1038/srep19251. [DOI] [PMC free article] [PubMed] [Google Scholar]
- 9.Majem B, Rigau M, Reventós J, Wong DT. Non-coding RNAs in saliva: emerging biomarkers for molecular diagnostics. Int J Mol Sci. 2015;16:8676–98. doi: 10.3390/ijms16048676. [DOI] [PMC free article] [PubMed] [Google Scholar]
- 10.Yoshizawa JM, Schafer CA, Schafer JJ, Farrell JJ, Paster BJ, Wong DTW. Salivary biomarkers: toward future clinical and diagnostic utilities. Clin Microbiol Rev. 2013;26:781–91. doi: 10.1128/CMR.00021-13. [DOI] [PMC free article] [PubMed] [Google Scholar]
- 11.Pernot E, Cardis E, Badie C. Usefulness of saliva samples for biomarker studies in radiation research. Cancer Epidemiol Biomark Prev Publ Am Assoc Cancer Res Cosponsored Am Soc Prev Oncol. 2014;23:2673–80. doi: 10.1158/1055-9965.EPI-14-0588. [DOI] [PubMed] [Google Scholar]
- 12.Soni S, Agrawal P, Kumar N, Mittal G, Nishad DK, Chaudhury NK, et al. Salivary biochemical markers as potential acute toxicity parameters for acute radiation injury: A study on small experimental animals. Hum Exp Toxicol. 2016;35:221–8. doi: 10.1177/0960327115579433. [DOI] [PubMed] [Google Scholar]
- 13.Laiakis EC, Strawn SJ, Brenner DJ, Fornace AJ. Assessment of saliva as a potential biofluid for biodosimetry: a pilot metabolomics study in mice. Radiat Res. 2016;186:97–7. doi: 10.1667/RR14433.1. [DOI] [PMC free article] [PubMed] [Google Scholar]
- 14.Moore HD, Ivey RG, Voytovich UJ, Lin C, Stirewalt DL, Pogosova-Agadjanyan EL, et al. The human salivary proteome is radiation responsive. Radiat Res. 2014;181:521–30. doi: 10.1667/RR13586.1. [DOI] [PMC free article] [PubMed] [Google Scholar]
- 15.Thiede C, Prange-Krex G, Freiberg-Richter J, Bornha¨user M, Ehninger G. Buccal swabs but not mouthwash samples can be used to obtain pretransplant DNA fingerprints from recipients of allogeneic bone marrow transplants. Bone Marrow Transplant. 2000;25:575–7. doi: 10.1038/sj.bmt.1702170. [DOI] [PubMed] [Google Scholar]
- 16.Endler G, Greinix H, Winkler K, Mitterbauer G, Mannhalter C. Genetic fingerprinting in mouthwashes of patients after allogeneic bone marrow transplantation. Bone Marrow Transplant. 1999;24:95–8. doi: 10.1038/sj.bmt.1701815. [DOI] [PubMed] [Google Scholar]
- 17.García-Closas M, Egan KM, Abruzzo J, Newcomb PA, Titus-Ernstoff L, Franklin T, et al. Collection of genomic DNA from adults in epidemiological studies by buccal cytobrush and mouthwash. Cancer Epidemiol Prev Biomark. 2001;10:687–96. [PubMed] [Google Scholar]
- 18.Hansen TvO, Simonsen MK, Nielsen FC, Hundrup YA. Collection of blood, saliva, and buccal cell samples in a pilot study on the Danish Nurse Cohort: comparison of the response rate and quality of genomic DNA. Cancer Epidemiol Prev Biomark. 2007;16:2072–6. doi: 10.1158/1055-9965.EPI-07-0611. [DOI] [PubMed] [Google Scholar]
- 19.Lee Y-H, Zhou H, Reiss JK, Yan X, Zhang L, Chia D, et al. Direct saliva transcriptome analysis. Clin Chem. 2011;57:1295–302. doi: 10.1373/clinchem.2010.159210. [DOI] [PubMed] [Google Scholar]
- 20.Spielmann N, Ilsley D, Gu J, Lea K, Brockman J, Heater S, et al. The human salivary RNA transcriptome revealed by massively parallel sequencing. Clin Chem. 2012;58:1314–21. doi: 10.1373/clinchem.2011.176941. [DOI] [PubMed] [Google Scholar]
- 21.El-Saghire H, Thierens H, Monsieurs P, Michaux A, Vandevoorde C, Baatout S. Gene set enrichment analysis highlights different gene expression profiles in whole blood samples X-irradiated with low and high doses. Int J Radiat Biol. 2013;89:628–38. doi: 10.3109/09553002.2013.782448. [DOI] [PubMed] [Google Scholar]
- 22.Li H, Zhang X-P, Liu F. Coordination between p21 and DDB2 in the cellular response to UV radiation. PLoS One. 2013;8:e80111. doi: 10.1371/journal.pone.0080111. [DOI] [PMC free article] [PubMed] [Google Scholar]
- 23.Iwakuma T, Lozano G. MDM2, an introduction. Mol Cancer Res. 2003;1:993–1000. [PubMed] [Google Scholar]
- 24.Perry ME. Mdm2 in the Response to Radiation. Mol Cancer Res. 2004;2:9–19. [PubMed] [Google Scholar]
- 25.Amundson SA, Lee RA, Koch-Paiz CA, Bittner ML, Meltzer P, Trent JM, et al. Differential responses of stress genes to low dose-rate gamma irradiation1 1 DOE Grant ER62683. Mol Cancer Res. 2003;1:445–52. [PubMed] [Google Scholar]
- 26.Dawes C. Estimates, from salivary analyses, of the turnover time of the oral mucosal epithelium in humans and the number of bacteria in an edentulous mouth. Arch Oral Biol. 2003;48:329–36. doi: 10.1016/s0003-9969(03)00014-1. [DOI] [PubMed] [Google Scholar]
- 27.Sonis S, Haddad R, Posner M, Watkins B, Fey E, Morgan TV, et al. Gene expression changes in peripheral blood cells provide insight into the biological mechanisms associated with regimen-related toxicities in patients being treated for head and neck cancers. Oral Oncol. 2007;43:289–300. doi: 10.1016/j.oraloncology.2006.03.014. [DOI] [PubMed] [Google Scholar]
- 28.Talwar S, House R, Sundaramurthy S, Balasubramanian S, Yu H, Palanisamy V. Inhibition of caspases protects mice from radiation-induced oral mucositis and abolishes the cleavage of RNA-binding protein HuR. J Biol Chem. 2014;289:3487–500. doi: 10.1074/jbc.M113.504951. [DOI] [PMC free article] [PubMed] [Google Scholar]
- 29.Kang H, Kiess A, Chung CH. Emerging biomarkers in head and neck cancer in the era of genomics. Nat Rev Clin Oncol. 2015;12:11–26. doi: 10.1038/nrclinonc.2014.192. [DOI] [PubMed] [Google Scholar]
- 30.Parissenti AM, Hembruff SL, Villeneuve DJ, Veitch Z, Guo B, Eng J. Gene expression profiles as biomarkers for the prediction of chemotherapy drug response in human tumour cells. Anticancer Drugs. 2007;18:499–523. doi: 10.1097/CAD.0b013e3280262427. [DOI] [PubMed] [Google Scholar]
Associated Data
This section collects any data citations, data availability statements, or supplementary materials included in this article.
Supplementary Materials
Table S1. List of 10 genes known to be radiation responsive in blood and selected for this study, with their symbol and biological processes.
Fig. S1. CLPA gene expression profile from ex vivo irradiated blood samples. Whole blood samples were collected from five volunteers and irradiated at the doses indicated and analyzed with the CLPA assay.
Fig. S2. Spearman’s rank correlation among expression levels of BAX, BBC3, CDKN1A, DDB2 and MDM2 in whole blood, as represented by normalized intensity values, and the ex vivo radiation dose.
Fig. S3. Saliva gene expression profiles for eight head and neck cancer patients from samples collected before treatment, at mid-treatment and at the end of radiotherapy and analyzed with the CLPA assay.
Fig. S4. Spearman’s rank correlation between expression levels of MDM2 in saliva, as represented by normalized intensity values, and the total radiation dose received during radiotherapy.