Abstract
Abnormalities in the human Nav1.5 (hNav1.5) voltage-gated sodium ion channel (VGSC) are associated with a wide range of cardiac problems and diseases in humans. Current structural models of hNav1.5 are still far from complete and, consequently, their ability to study atomistic interactions of this channel is very limited. Here, we report a comprehensive atomistic model of the hNav1.5 ion channel, constructed using homology modeling technique and refined through long molecular dynamics simulations (680 ns) in the lipid membrane bilayer. Our model was comprehensively validated by using reported mutagenesis data, comparisons with previous models, and binding to a panel of known hNav1.5 blockers. The relatively long classical MD simulation was sufficient to observe a natural sodium permeation event across the channel’s selectivity filters to reach the channel’s central cavity, together with the identification of a unique role of the lysine residue. Electrostatic potential calculations revealed the existence of two potential binding sites for the sodium ion at the outer selectivity filters. To obtain further mechanistic insight into the permeation event from the central cavity to the intracellular region of the channel, we further employed “state-of-the-art” steered molecular dynamics (SMD) simulations. Our SMD simulations revealed two different pathways through which a sodium ion can be expelled from the channel. Further, the SMD simulations identified the key residues that are likely to control these processes. Finally, we discuss the potential binding modes of a panel of known hNav1.5 blockers to our structural model of hNav1.5. We believe that the data presented here will enhance our understanding of the structure–property relationships of the hNav1.5 ion channel and the underlying molecular mechanisms in sodium ion permeation and drug interactions. The results presented here could be useful for designing safer drugs that do not block the hNav1.5 channel.
Keywords: sodium ion channel, voltage-gated sodium channel, steered molecular dynamics, cardiotoxicity, hNav1.5, channel blockers
Introduction
Voltage-gated sodium ion channels (VGSCs) are presumably one of the most important macromolecules in the human body. They regulate several physiological functions. Disorders related to these channels have been implicated in many diseases.1 There are nine known members of the VGSCs that have been characterized so far (hNav1.1–hNav1.9), and the tenth member (hNavX) has been identified as a closely related protein.2 VGSCs are responsible for initiating the action potential in all excitable cells, and many isoforms of VGSCs are spread all throughout the body. VGSCs are usually present with high propensities in certain organs, forming tissue-specific distributions. For example, the major VGSC isoform on the heart is called the hNav 1.5 ion channel.3 A functioning unit of a normal VGSC is called the α-subunit and is usually expressed together with one or more auxiliary subunits, defined in the literature as β-subunits. The α-subunit (the pore-forming subunit) is capable of forming a fully functional channel and can generate electrical pulses independent from the β-subunits. Incorporating a β-subunit within the hNav1.5 can modify the channel’s gating kinetics and voltage dependence. Moreover, the β-subunits are responsible for hNav1.5 localization and interaction with cell adhesion biomolecules as well as with the intracellular and extracellular matrices.2
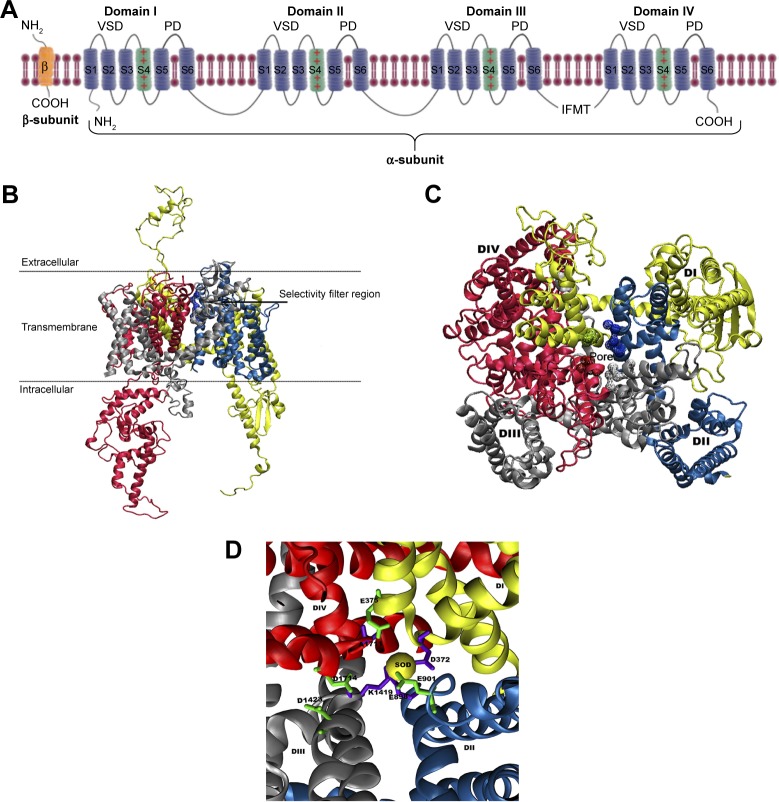
Architecturally, all eukaryotic VGSCs have been shown to possess a similar overall folding pattern. The α-subunit is organized into four domains (DI–DIV) and is covalently or non-covalently attached to β-subunits through the N and C-termini.4 Figure 1A shows a schematic representation of a complete VGSC, demonstrating the relative orientations of the four domains, the location of α and β subunits, as well as the inactivation gate at the intracellular (DIII–DIV) connection. Each domain is composed of two sub-domains: a cytoplasmic sub-domain and a transmembrane sub-domain. The short intracellular helix that connects DIII and DIV is called the inactivation gate (hinged lid).5 This loop folds toward the intracellular opening of the pore during the fast inactivation phase of the channel.
Figure 1.
(A) A schematic representation of the α- and β-subunits of a complete VGSC model. The figure depicts all the four domains (I–IV), with each domain including a VSD and a PD. The positively charged S4 helical segments of the VSDs, which connect with the respective PD, are shown as green helices and the location of inactivation gate is also marked. The 3D structure of the homology model of hNav1.5 ion channel is shown as (B) side-view and (C) top-view representations. The locations of the SFs residues are given in (D) and colored green (outer SF, EEDD) and violet (inner SF, DEKA). A trapped sodium ion is shown as a yellow van derWaals sphere. The four domains, DI, DII, DIII, and DIV, are shown in yellow, blue, silver, and red, respectively.
Abbreviations: PD, pore domain; SF, selectivity filter; VSD, voltage-sensing domain.
In the human heart, human Nav1.5 (also known as the cardiac sodium ion channel; hNav1.5) is responsible for initiating the myocardial action potential.3 Mutations in hNav1.5 have been associated with a wide range of cardiac diseases, such as long QT syndrome 3 (LQT3), Brugada syndrome 1 (BRGDA1), and sudden infant death syndrome (SIDS).6,7 So far, a complete experimentally determined 3D structure of the hNav1.5 is unavailable. Thus, computational modeling methods have been predominantly employed to fill this gap and to develop insights into the structure–function relationships of the channel. Until late 2011, the scarcity of X-ray crystal and/or NMR structures that can be used as templates has been a significant limiting factor in studying hNav1.5 structures. However, with the release of the first and most complete structure – an NavAB (Arcobacter butzleri) bacterial sodium channel with a high resolution of 2.7Å8 – many models of cardiac ion channels started to emerge. These models, however, did not include the extracellular loops, intracellular domains, and voltage-sensing domains (VSDs).9,10 Despite being incomplete, these models provided an invaluable guide to understand several experimentally observed phenomena related to hNav1.5.
Starting from late 2011, almost all reported structural models for human VGSCs, including hNav1.5, exploited the X-ray crystal structure of the bacterial NavAB as a template.8,11 These models seemed to be “purpose-specific”, meaning that the generated models have been developed to focus on a certain property in isolation from other important properties. An example of these models is the VSDI (S1–S4 of the trans-membrane domain I) model reported by Moreau et al. In their model, Moreau et al studied the effect of the R222Q and the R225W mutations on the depolarization potential of the hNav1.5 mutant, compared to the wild-type form.10
Another model, which focused on the pore-forming region (Figures S5 and S6) and the short pore helices of hNav1.5, was developed by Poulin et al and aimed at studying the interaction of a small number of drugs (eg, fluoxetine) with hNav1.5.12 In Poulin et al’s model, the extracellular linkers of the P-loops were truncated to match the length of the crystallized bacterial channel. The model was also optimized in implicit solvent without lipid molecules.12 In a subsequent study, O’Leary and Chahine used the same model to study the role of the S6 segment of domain V on the gating of the channel through cysteine substitutions and using a methanethiosulfonate (MTSET) reagent.13
Perhaps, the most complete hNav1.5 model developed so far was the model reported by Wang et al.14 This model focused on a rare L812Q mutation located at the S4 helix of domain II. The models for the individual four transmembrane sub-domains were generated through the PHYRE215 server and assembled through a superposition on the NavAB bacterial ion channel using Chimera software.16 Although Wang included more domains in his model compared to earlier models, his study did not discuss the conformational dynamics of the channel. The lack of many structural details for some of the reported models and the absence of the explicit consideration of conformational dynamics in the other models significantly limit our understanding of the function and properties of the hNav1.5 ion channel.
In this study, we report a comprehensive model for the closed state of hNav1.5 cardiac ion channel, which is based on the crystal structure of the NavAB as the main template for the membrane-spanning region of the channel. In our model, a number of intracellular sub-domains have been modeled separately whereas others have been included from already deposited X-ray structures of hNav1.5. The two groups were then attached to the main structure. We validated our model by extensively comparing it to previously reported models and to several structural and mutational data available in the literature. Furthermore, through classical molecular dynamics simulation (680 ns-long time scale) and several short-steered molecular dynamics (SMD) trajectories, we revealed significant atomistic details of sodium permeation in the hNav1.5 structure. Different ion permeation pathways, energy barriers, key amino-acid residues, and their corresponding gating processes will be discussed. Moreover, we report the efficiency of our homology model to differentiate between known hNav1.5 blockers and non-blockers by using ensemble-based docking and binding free energy calculations.
Methods and computational details
The computational methods employed in this work are briefly presented in this section. Please refer to supplementary information for more detailed description (and or theoretical background) of each of these methods.
Homology modeling and classical MD simulation of the hNav1.5 α-subunit
Initially, the full-length amino-acid sequence of the α-subunit of hNav1.5 was dissected into nine protein domains that were independently modeled using the Iterative Threading Assembly Refinement (I-Tasser) software.17 Transmembrane regions of the channel were built using the crystal structure of NavAB bacterial VGSC (PDB ID: 3RVY). As described in the 2011 Payandeh et al crystal structure of NavAB bacterial VGSC, the deposited X-ray structure (PDB ID: 3RVY, 2.7Å resolution) represents a closed conformation.8 In 2012, the same group made another breakthrough, where they were able to crystallize the same channel in another conformation that they believed was representative of an inactivated state of the channel (PDB ID: 4EKW, 3.2Å).11 After superposing the two structures, we realized that there is only a slight shift of the S6 helices terminal, and the overall root-mean square deviation (RMSD) between the two structures was as low as 0.7Å. We decided to henceforth use the 3RVY structure as a template as it has a slightly better resolution.
The NavAB ion channel has been extensively used to build mammalian VGSC, such as the hNav1.4 model by Mahdavi and Kuyucak18 and the hNav1.7 model by Yang et al.19 The intracellular regions included in the model were either retrieved from the existing crystal structures or were independently built using I-Tasser. Please refer to supplementary information for a detailed description of the homology modeling procedures employed here. Figure S1 represents the sequence alignment between the target hNav1.5 and different template sequences. Cartoon representations of the complete model of hNav1.5 are also given in Figure 1B (side view) and C (top view).
The homology model of the hNav1.5 structure was embedded in a palmitoyl-oleyl-phosphatidylcholine (POPC) lipid bilayer and was subjected to ~680 ns-long classical MD simulation. The full system (protein, lipid, water, and ions) was built using the powerful CHARMM-GUI membrane builder module,20 and using the CHARMM36FF forcefield.21 The system underwent energy minimization, heating to 310 K over 50,000 steps, with 100 ns-long equilibration, and, finally, production simulation was performed for 680 ns. A weak-restraining force of 0.1 kcal/mol/A2 was applied to the backbone atoms (C, N, and O) of the transmembrane regions during the first 200 ns of production run. All MD simulations were performed using a NAMD2.9 package.
Electrostatic ion-solvation energy using the adaptive Poisson–Boltzmann solver
In theory, the electrostatic nonpolar ionic solvation energy can be calculated through the following equation:
| (1) |
In the above equation, ΔEPB is the Poisson–Boltzmann electrostatic solvation energies calculated as the difference between the electrostatic energy of the lipid-membrane- embedded protein–ion complex (Ecomplex) followed by subtracting the energies of the free ion in aqueous solution (Eion) and the membrane-embedded ion-free protein (Eprotein). This approximation requires the use of the Born ion – a non- polarizable spherical particle with fixed charge and atomic radii. In practical applications of ion transport through membrane proteins, ΔEPB determines how favorable is the transfer of the ion from water to the protein environment. Atomic charges and radii of the ion and proteins were retrieved from the CHARMM forcefield using the APBSmem2.0222 embedded PDB2PQR plugin.23 We applied a two-layer focusing boundary conditions scheme to account for the effect of the lipid membrane. A dielectric slap of epsilon (ε=2), in which the protein was embedded, is used with a membrane thickness of 30Å and connected to an NaCl bath at 298.15 K. APBSmem settings were retrieved from the successful applications of APBS in previous studies of a similar nature.22,24 The electrostatic grid was always centered on the sodium ion.
Nonequilibrium steered molecular dynamic simulations
Nonequilibrium steered molecular dynamic (SMD) simulations were performed on the hNav1.5 model in order to understand the mechanisms by which a sodium ion can be released from the central cavity of the channel. SMD has been successfully applied to understand several biological processes,25–32 including but not limited to, ligand association/dissociation to proteins and passage of ions from/to the ion channels.27,30,32 For example, SMD simulations have been useful to reveal the knock-off mechanisms in the potassium ion channel, through which the potassium ion migrated from the central cavity of the channel into the extracellular environment.30 A brief theoretical background about SMD is provided in the supplementary information.
In this study, several short SMD trajectories were collected in order to understand the processes of ion permeation through the hNav1.5 TRM into the intracellular environment. The rationale for employing SMD on a closed state of the hNav1.5 (which includes obvious high-energy barriers) is to identify the key residues that probably form high-energy barriers to obstruct ion permeation. Such details are often difficult to capture from the open state of the channel, as those residues might have adapted low-energy conformations in an open state, thus facilitating free ion permeation. All of the parameters and preparation for the SMD simulations were the same as those employed in the classical MD production runs, except for the introduction of a constant velocity (v) and a spring constant (k) to pull the ion off the cavity using an external biasing force. After several test simulations (refer to supplementary information), combinations of k =4 and 5 kcal/mol/Å and v =0.45 Å/ps were selected as the optimal choices for the SMD simulations in this work. Following the selection of the optimal parameters, SMD simulations were performed for seven snapshots of hNav1.5, named snap1, snap2, snap3, snap4, snap5, snap6, and snap7. Here, snap1 represents the final snapshot from the classical MD trajectory, whereas the other six snapshots were collected from the last 350 ns of the classical MD trajectory at a regular interval of 50 ns per snapshot. This was essential to investigate the effects of time-dependent conformational changes in the structure of the channel on the permeation of the sodium ion from the central cavity to bulk water. For every structure (snapshot), 10 short SMD simulations (five repeats with k =4 and 5 kcal/mol/Å + v =0.45 Å/ps) were carried out for 200 ps, in order to verify the reproducibility of the force profiles. The lengths of SMD simulations have been selected such that it is computationally feasible, yet maximum chemical details are captured from the trajectories. Therefore, a total of 70 SMD trajectories (in addition to 30 SMD trajectories during benchmarking) were produced and analyzed to develop mechanistic insights into ion permeation from the central cavity of a closed state for the hNav1.5 channel. All SMD simulations were carried out using the NAMD2.9 package and the powerful Blue Gene\Q supercomputing clusters.33
Clustering analysis, docking simulation, and MMGBSA binding-energy calculations
Several experimental and computational studies have indicated that the small-molecule-binding site of hNav1.5 is located in the vicinity of F1760.34–36 Similar to our earlier studies,37–42 dominant binding-site conformations of the hNav1.5 channel were selected by clustering the RMSDs of the last 580 ns of the classical MD trajectory using the Davies–Bouldin index (DBI) and the elbow criterion defined by the ratio between Sum of Squares Regression (SSR) to the Total Sum of Squares (SST). The dominant conformations of the protein identified through cluster analysis were subsequently prepared and refined using the protein preparation wizard in the Schrodinger software package.43
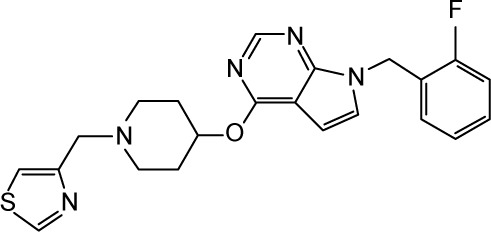
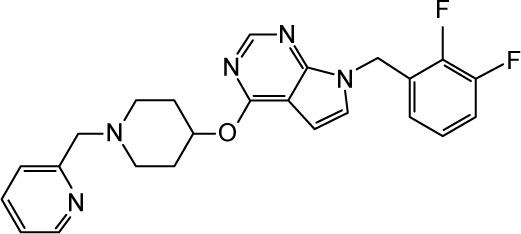
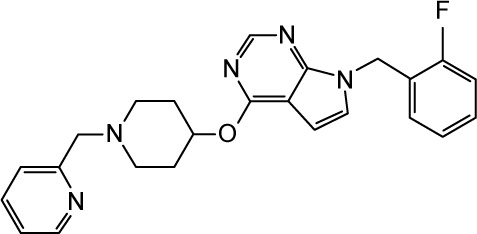
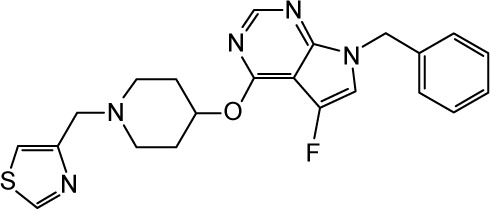
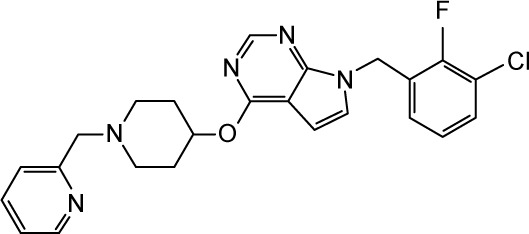
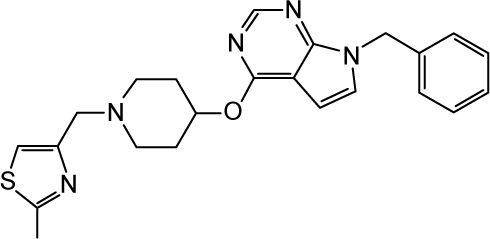
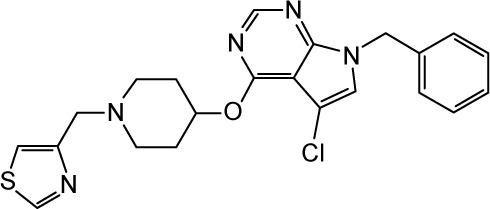
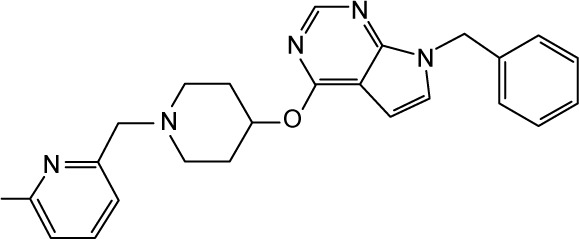
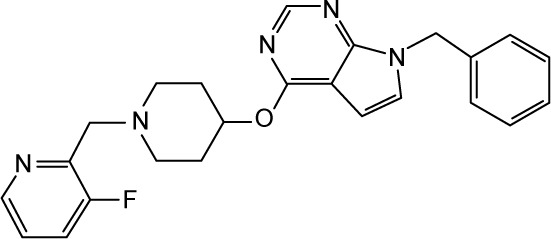
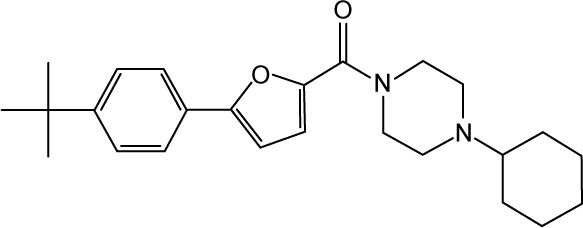
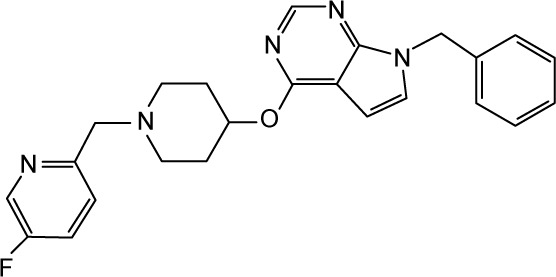
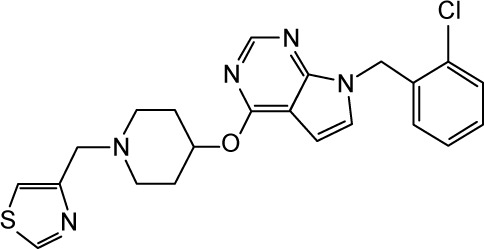
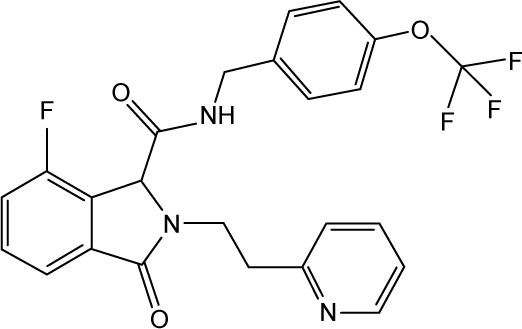
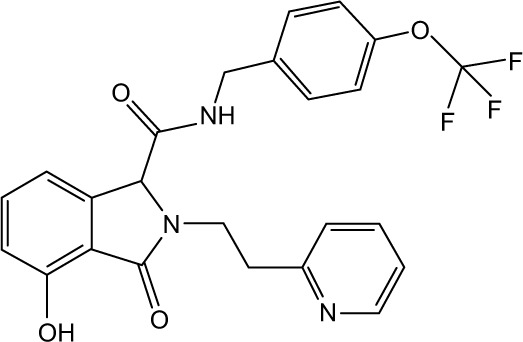
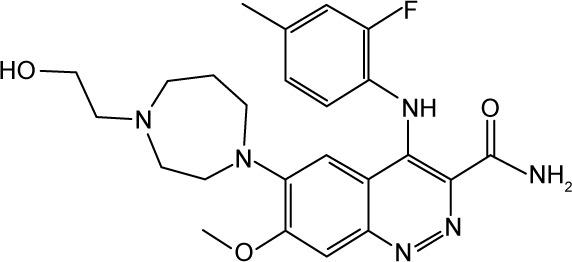
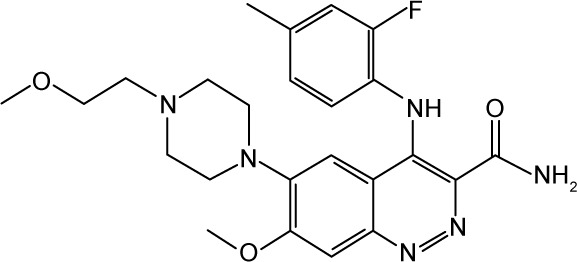
For the docking calculations, a list of 35 ligands (listed in Table 1) – with varied blocking activities (including 24 strong blockers with IC50 <1 μM and eight weak blockers with IC50 >25 μM) – was selected and downloaded from the CHEMBL database.44 These compounds are sorted in Table 1 according to their IC50 values. In addition, we included three known drugs – ranolazine,45 lidocaine,46 and flecainide47 – that are known to block hNav1.5 in our validation set. All of the ligands were prepared using the LigPrep module in the Schrodinger drug discovery suite, followed by ensemble-based docking against dominant hNav1.5 conformations obtained from RMSD clustering. The seven best-scoring poses for each ligand were selected for carrying out short, constrained MD simulations. Each protein–ligand complex was immersed in a 12Å3-sized cubic box of TIP3P water molecules, and the parameters for the amino acids and ligand molecules were assigned using the AMBER-FF99SB force field and the GAFF force field, respectively. After short minimization, heating, and equilibration steps, each system was subjected to 1-ns MD simulation. For each system, binding energies were computed using the popular MMGBSA module of AMBER over the 1-ns production simulation and using a 4-ps frame separation interval.48
Table 1.
Complete list of all molecules tested to validate the Nav1.5 model with the corresponding CHEMBL IDs, IC50, pIC50, and the AMBER-MMGBSA binding energy values
| No | Structure | CHEMBL ID | IC50(nM) | pIC50 | Binding energy (kcal/mole) |
|---|---|---|---|---|---|
| 1 |
|
CHEMBL2012259 | 20 | 7.7 | −28.07 |
| 2 |
|
CHEMBL2012299 | 20 | 7.7 | −32.85 |
| 3 |
|
CHEMBL2012298 | 30 | 7.52 | −32.78 |
| 4 |
|
CHEMBL2012180 | 30 | 7.52 | −31.38 |
| 5 |
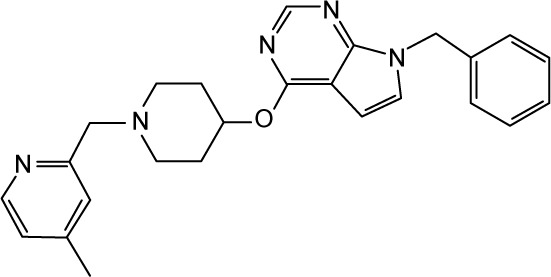
|
CHEMBL2012292 | 40 | 7.4 | −41.35 |
| 6 |
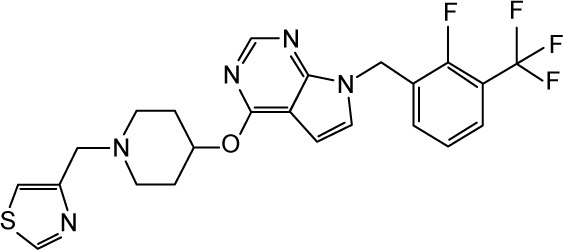
|
CHEMBL2012273 | 40 | 7.4 | −35.04 |
| 7 |

|
CHEMBL2012274 | 40 | 7.4 | −37.05 |
| 8 |
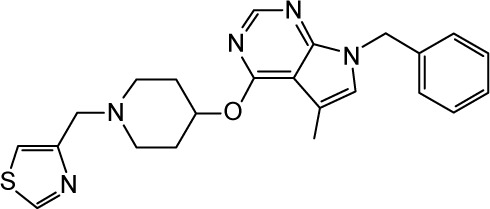
|
CHEMBL2012179 | 50 | 7.3 | −38.47 |
| 9 |
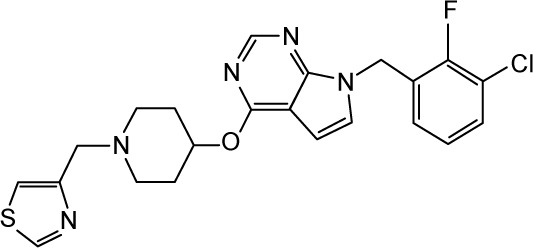
|
CHEMBL2012272 | 50 | 7.3 | −35.56 |
| 10 |
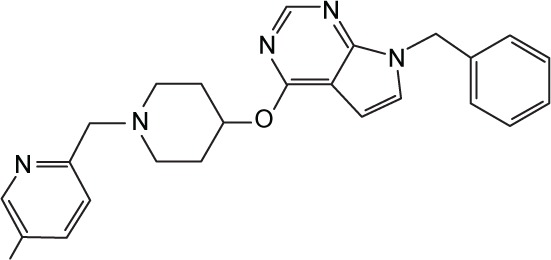
|
CHEMBL2012291 | 60 | 7.22 | −38.37 |
| 11 |
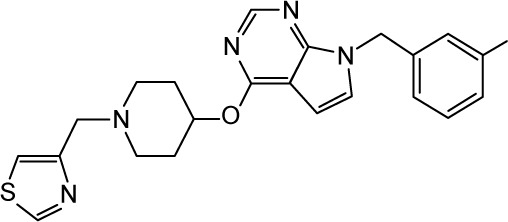
|
CHEMBL2012266 | 60 | 7.22 | −36.79 |
| 12 |
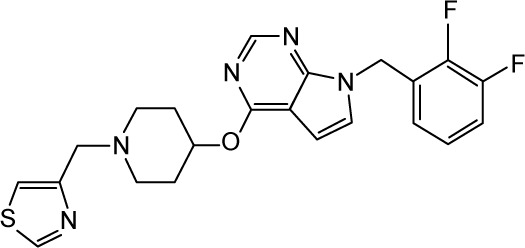
|
CHEMBL2012271 | 70 | 7.15 | −35.68 |
| 13 |
|
CHEMBL2012300 | 80 | 7.1 | −36.03 |
| 14 |
|
CHEMBL2012285 | 80 | 7.1 | −36.25 |
| 15 |
|
CHEMBL2012181 | 80 | 7.1 | −39.29 |
| 16 |
|
CHEMBL2012290 | 90 | 7.05 | −37.66 |
| 17 |
|
CHEMBL2012296 | 90 | 7.05 | −32.87 |
| 18 |
|
CHEMBL486495 | 100 | 7.0 | −42.33 |
| 19 |
|
CHEMBL2012295 | 110 | 6.96 | −33.47 |
| 20 |
|
CHEMBL2012262 | 110 | 6.96 | −39.25 |
| 21 |

|
CHEMBL1813050 | 300 | 6.52 | −35.50 |
| 22 |

|
CHEMBL1813049 | 500 | 6.3 | −33.54 |
| 23 |
|
CHEMBL2164368 | 810 | 6.09 | −32.06 |
| 24 |
|
CHEMBL2164041 | 940 | 6.03 | −32.39 |
| 25 |

|
Ranolazine | 5.23 | −39.35 | |
| 26 |
|
CHEMBL2409402 | 27,000 | 4.57 | −33.08 |
| 27 |
|
CHEMBL2409401 | 28,000 | 4.55 | −32.65 |
| 28 |
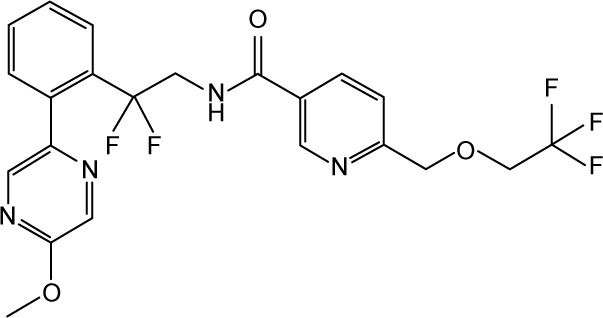
|
CHEMBL2147316 | 31,622.78 | 4.5 | −25.63 |
| 29 |
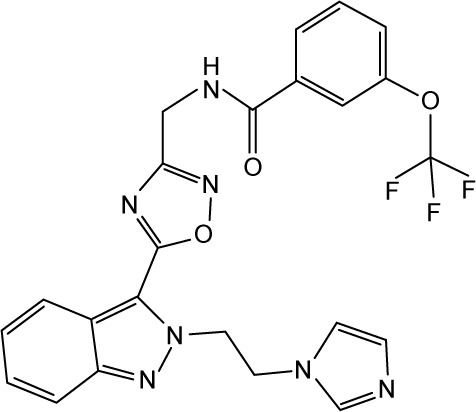
|
CHEMBL3236329 | 36,000 | 4.44 | −37.85 |
| 30 |
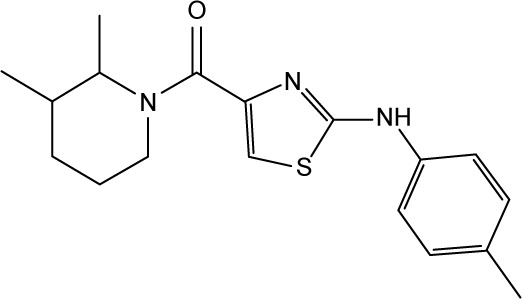
|
CHEMBL2418806 | 50,000 | 4.3 | −35.83 |
| 31 |
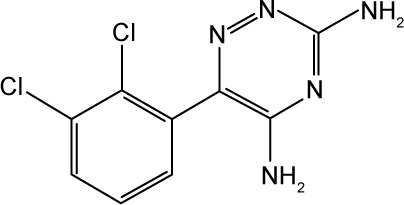
|
CHEMBL741 | 62,000 | 4.21 | −24.18 |
| 32 |
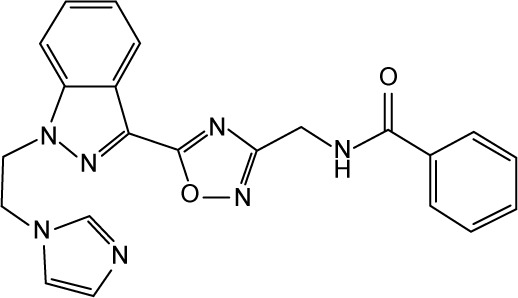
|
CHEMBL3236343 | 69,000 | 4.16 | −37.73 |
| 33 |
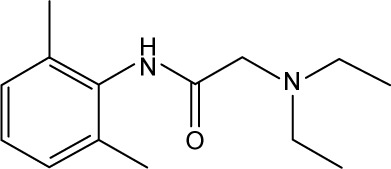
|
CHEMBL79 | 108,000 | 3.97 | −22.24 |
| 34 |
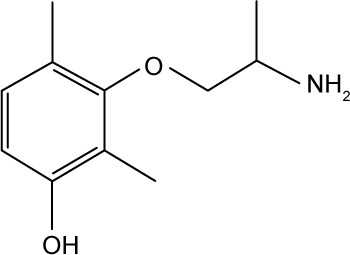
|
CHEMBL2018453 | 174,000 | 3.76 | −27.21 |
| 35 |
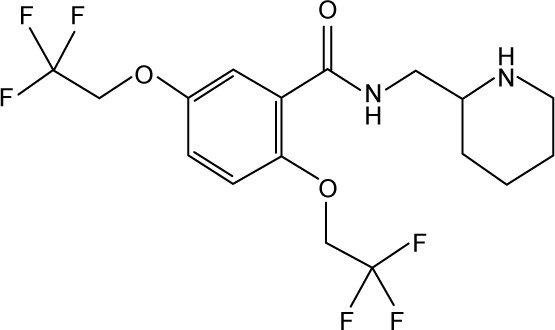
|
Flecainide | 345,000 | 3.46 | −16.79 |
Notes: Binding energy values achieves a Pearson’s correlation of 0.70 with the IC50 values. Ligands appear according to their reported IC50 values.
According to the MMGBSA protocol, the free binding energy estimation (ΔG) can be calculated as follow:
| (2) |
In the previous equation, ΔEele represents the electrostatic binding energies (attractive and repulsive components) of the protein–ligand complex under investigation. Similarly, ΔEvdW is an estimate of the lipophilic van derWaals (vdW) interaction energy between the protein and the ligand. Where ΔEvdW and ΔEele and are the protein–ligand vdW and electrostatic interaction energies from the molecular mechanics forcefield (EMM), respectively. ΔGpol represents the polar solvation, and ΔGnp estimates the nonpolar solvation energies of the system. The two components (ΔGpol and ΔGnp), together known as the system solvation energy, estimate the desolvation penalty that has to be paid when the small molecule and the protein associate are in aqueous solution. Solvation energy was calculated through the generalized Born implicit solvent (GB) model in AMBER using the recent version of the Onufriev et al model (GBOBC2).49 Entropy changes (the last term, TΔS) were ignored because of the associated computational cost.
Results and discussion
Here, we report a comprehensive homology model for the closed hNav1.5 cardiac ion channel. Our model is based on the recently crystallized structure of the NavAb bacterial ion channel as the main template.8 To make our model more complete, we also included three intracellular domains in the model by either including co-crystallized segments of these domains (cytoplasmic sub-domains 4 and 5) or by comparative modeling (cytoplasmic sub-domain 1), described in Methods. The full model was subsequently refined using exceptionally long classical MD simulations. In addition, we discuss the natural capture of a sodium ion into the channel and investigate its interactions with different layers of the selectivity filter (SF) residues during the course of the MD simulation. We later report key mechanistic insights on this ion permeation from the central cavity into the intracellular solution, using advanced SMD simulations. To further validate the model, we report its interactions with a set of known hNav1.5 blockers and correlate their predicted binding affinities to those reported in the literature.
Selection of an acceptable hNav1.5 homology model
As described in details in Methods, several hNav1.5 homology models were generated through comparative modeling by using the I-Tasser program, and the best three structural models were subjected to FG-MD-based refinements. Analyses of Ramachandran plots of these three models, which were obtained from the RAMPAGE module,50 indicate that ≥90% of the amino acid residues are found in the favored and allowed regions (94.2% for Model 1, 93.7% for Model 2, and 95.7% for Model 3; Figure S2). Additionally, <7% of residues of the three models were found in the unfavorable regions of the Ramachandran plots (5.7% for Model 1, 6.3% for Model 2, and 4.2% for Model 3). This describes that the models generated are of good quality; it also indicated that Model 3, in particular, is of superior quality compared to the other two models. Subsequently, the three models were prepared for membrane-embedded protein simulation with CHARM-GUI, as mentioned earlier. Each system was then subjected to molecular dynamics (MD) equilibration for ~100 ns, during which the helical structures in two of the models (Model 1 and Model 2) gradually distorted. Nevertheless, the secondary structures in Model 3 were conserved very well throughout the simulation. It is known that the conservation of the helical structures is an important metric to assess the quality of homology models, particularly those of ion channels.51 Therefore, in the current study, and unless otherwise specified, all results discussed further are based solely on Model 3. A side view for the complete system in model 3 (protein, lipids, waters, and ions) is depicted in supplementary data (Figure S3). Model 3 exhibited a very stable trajectory over the classical MD simulation; the RMSD of the transmembrane region fluctuates only by ~5A over the last 580 ns of MD simulation. The RMSD plot is given in supplementary data (Figure S4).
Computational microscopy for ion permeation through the channel’s SFs
Of significant importance for a properly functioning VGSC are the two channel’s SFs, which act as exceptionally powerful molecular sieves and are conserved between all mammalian VGSCs.52,53 Each of these two SFs plays a distinct role in facilitating ion permeation.54,55 The outer SF (EEDD ring) encompasses four amino acid residues, namely E375 (DI), E901 (DII), D1423 (DIII), and D1714 (DIV). These residues (Figure 1D) are spread across the four domains. With the exception of D1423, the carboxylate groups of all residues forming the outer SF are close to the main axis of the inner SF. The inner selectivity pore (DEKA ring, constriction site) is located below the EEDD ring and is composed of four residues that are splayed across the four domains of the channel. The short turns connecting P1 and P2 helices in all the domains contain these selectivity-specific residues – D372 (DI), E898 (DII), K1419 (DIII), and A1711 (DIV) (Figure 1D). A number of previous studies have shown that mutation of any of the residues forming the SFs can not only affect the selectivity of the channel but can also affect the gating kinetics of the channel.56,57
Ion-binding sites at the outer SF (EEDD ring)
Previous classical and long MD studies of VGSC conducted by other groups have reported the rapid and spontaneous penetration of sodium through the SFs to the central cavity of the channel without the application of any biasing potential.58 Similarly, in our MD simulation, we observed that several sodium ions, but not chlorine, were trapped at the outer vestibular region of the channel. The significant selectivity of VGSC toward cations over anions is attributed to a strong electrostatically negative potential at the outer channel’s vestibule. Our calculated electrostatic potential mapped over CHARMM-retrieved charges and atomic radii strongly support this argument.59,60 As shown in Figure 2, the funnel-shaped vestibule of the outer channel bears a predominantly negative electrostatic potential. Additionally and similar to what has been previously reported from an MD study for the hNav1.4 channel, we observed a continuous exchange between sodium ions at the outer channel vestibule and at the outer SF ring (EEDD).32
Figure 2.
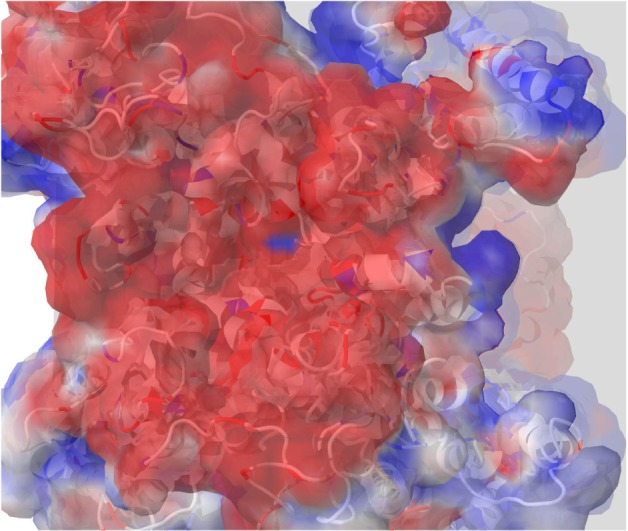
A top view of the outer channel’s vestibule showing a predominantly negative electrostatic potential that seems to be extremely efficient as a cation ion trap. This is the first layer of selectivity for cations, and then close to the selectivity filters, other mechanisms will be involved to trap the cation of choice, sodium.
Furthermore, our analysis of the MD trajectory and electrostatic potential calculations for the interaction of the sodium ion with the outer SF region (EEDD) revealed the presence of two potential transient binding sites. In the first site (S1), the sodium ion is sandwiched amid E375, E901, and D1714. In the second site (S2), the sodium is interacting with D1423 and, occasionally, with D1714. The two sites are depicted in Figure 3. Intriguingly, although sodium in S1 is close to the main perpendicular z-axis of the pore and is coordinated to a higher number of carboxylate groups, our electrostatic ion solvation calculations showed that the electrostatic interaction energy is more favorable for S2 than S1 (ΔΔEelec ≈0.5 kcal/mol, and higher for other investigated snapshots). This is because S1 is located in the region of the filter that is immediately above the positively charged K1419 residue.
Figure 3.
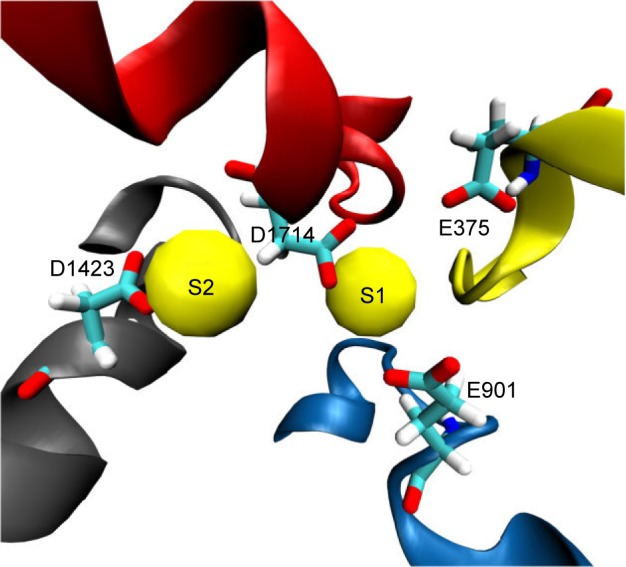
Two potential binding sites for sodium ions (S1 and S2) close to the outer selectivity filter. In S1, sodium (shown as a yellow van derWaals sphere) is coordinated by three carboxylates from E375, E901, and D1714, whereas it is only mono-coordinated by the D1423 carboxylate in S2. Our ion-solvation energy calculations, however, showed that S2 might be a more favorable site as S1 can experience a repulsive force from the gatekeeper, K1419.
Role of lysine in ion permeation at the inner SF (DEKA ring)
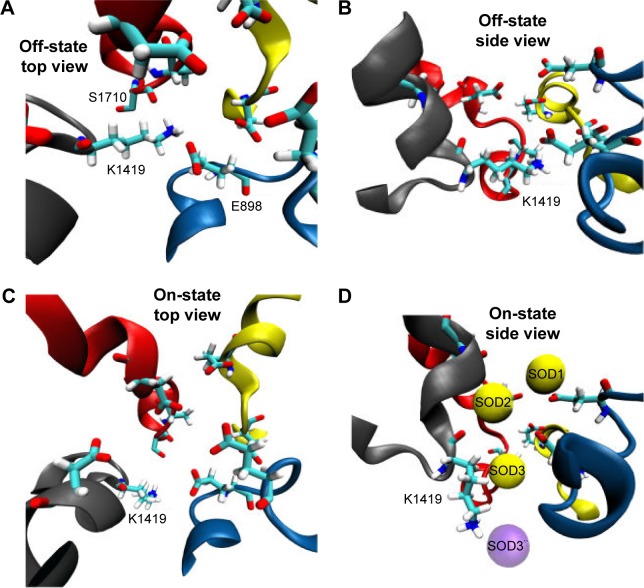
There has been an immense amount of research to investigate the role of the conserved K residue at the DEKA inner SF (constriction site) of VGSC.32,61,62 It has been hypothesized that this residue plays a fundamental role in conferring the selectivity of mammalian VGSC for sodium over potassium as well as other cations.52,62 Mutating this residue to alanine (A) has been found to abolish channel selectivity completely.63 Furthermore, Xia et al reported that the long side chain of the K residue of VGSC adopts a few distinct conformational states, from which only specific states can allow the passage of sodium.54 These states were grouped into two main categories; the “on-states” where sodium is allowed to permeate and the “off-states” where the pore is blocked by the side chain of K residues. Xia, moreover, showed that, in the “off-states”, the side chain of K1419 interacts with the facing carboxylate group of E898 from the DEKA filter and the backbone/side chain oxygens of S1710 – one of the pore lining residues.54 The engagements of K1419 with these two residues block the selectivity pore in front of any cation (Figure 4A and B).
Figure 4.
This figure depicts the role and conformational changes necessary for K1419 to allow sodium permeation. Figure (A) and (B) give a top and side view for K1419 in a representative “off-state” where K1419 is coordinated to E898 and S1710 blocking the ion permeation pathway. Figure (C) and (D) depicts K1419 in an “on-state” allowing sodium permeation through the pore. (D) SOD1 and SOD2 seems to facilitate the permeation of SOD3 which reaches the central cavity afterwards giving raise to SOD3`` (violet). Upon the release of SOD3 to the central cavity, K1419 readopts an “off-state”, blocking the permeation of more sodium ions and preventing SOD3 from traveling in the reverse direction.
In the “on-states”, however, Xia et al54 reported that the side chain of this lysine residue moves upward so as to allow sodium ion permeation. Both “on-” and “off-” states were observed in our MD simulation for the hNav1.5 model. Whereas the “off-state” of K1419 adapts similar interactions to those reported by Xia et al, the “on-state” displayed significant differences. Contrary to the upward movements of K1419 as reported by Xia et al,54 we observed a downward perpendicular movement of the K1419 side chain (almost 90°, Figure 4C and D) to create a path that allows sodium permeation. This movement is facilitated by the presence of the other two sodium ions located just below the aforementioned sodium binding sites (S1 and S2) in the outer selectivity ring (EEDD). Upon release of the single sodium to the central cavity, the side chain of K1419 rapidly readopts an “off-state” where other sodium ions can no longer permeate to the central cavity. This will also block the pathway against the permeated sodium ion traveling in the reverse direction to escape from the central cavity through the SFs; K1419 is an amazing gatekeeper. The process is accompanied by the release of the other two sodium ions (SOD1 and SOD2) from the SF into the outer vestibule. Most probably, the presence of the three sodium ions forces the SFs to adopt the “on-state” of K1419. In addition, SOD1 and SOD2 destabilize SOD3 binding through ion–ion coulomb repulsion, allowing SOD3 permeation through the inner SF. Similar mechanisms have been previously discussed for potassium permeation through potassium channels.64,65 A movie showing the permeation event of sodium is given in supplementary materials.
Many atomistic modeling studies conducted for human hetero-tetrameric VGSCs were carried out by mutating SF residues to the corresponding DEKA variants of the essentially homo-tetrameric prokaryotic VGSC. For example, the study of Xia et al mutated the four serine (Ser180) residues at the SF of a bacterial VGSC to the DEKA variants. Apparently, this may have a significant impact on the spatial arrangements of SF residues in the pore regions, which is critical for the proper physiology of the channel.
The apparent difference in the side chain’s length between K180 and S180 residues, ~3Å, as well as the very different electrostatic and steric discrepancies between the two residues, might lead to a conclusion that such mutated models will require significant relaxation time. This is needed for a proper physiologically relevant arrangement of the mutated side-chain residues to be reached; otherwise unexpected conformational restrains on the movement of these side chains will always exist. Although this might be acceptable to gain a rough estimate for the property under investigation, critical conclusions regarding the finest atomistic details should always be rigorously validated. Xia et al have further discussed the possible influence of the performed modeling approach in a subsequent follow-up study; nevertheless, the same approach was again used.62
Another discrepancy between our MD and the reported Xia et al simulation is the interaction pattern of K1419 in the “off-state”. Our data are more consistent with the hNav1.4 MD study of Mahdavi and Kuyucak,32 which predicted a predominant role of S1710 to the binding of K1419 in the off-state, whereas the Xia et al.54 MD study excluded such a role completely. The agreement between our results and the Mahdavi and Kuyucak32 data is obviously attributable to the close homology of the hNav1.5 and hNav1.4 VGSCs and casts greater doubt at many of the studies that were conducted through the simple in silico mutagenesis approach of prokaryotic VGSCs.
Rigid electrostatic potential scan of sodium across the SFs to retrieve the Poisson–Boltzmann electrostatic solvation energy profile
A rigid body electrostatic scan was performed in order to gain some insights into the natural electrostatic energy barriers experienced by the sodium ion along the main axis of the channel’s pore during its permeation. In this scan, sodium ion was slowly moved from the outside (directly above the EEDD ring) to the inside of the central cavity of the channel. The scan was performed along the main z-axis of the channel for a distance of ~12Å using 0.2Å steps (70 steps in total). At each step, the electrostatic ion solvation energy is calculated by solving the Poisson–Boltzmann equation for the corresponding location of the ion through the finite-difference scheme as implemented in APBSmem2.02 software, discussed in Methods in greater detail.22
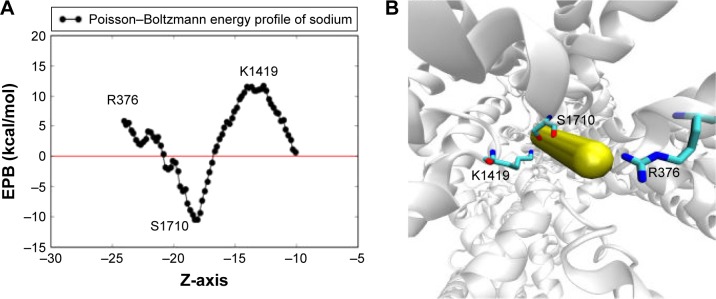
A 2D plot for the generated Poisson–Boltzmann energy profile of sodium is given in Figure 5A alongside the corresponding ion movement (Figure 5B). Protein atoms were kept rigid during the scan, and the chosen protein conformation was selected just prior to the escape of the sodium to the central cavity, where K1419 is present in an “on-state” to avoid potential steric clashes. As we can see in the 2D plot in Figure 5A, the electrostatic solvation energy starts at an unfavorable value of 5.9 kcal/mol outside the pore, sufficiently close to a nearby positively charged Arg residue (R376). Inside the pore, the electrostatic interaction drops down to a minimum of ~−10.4 kcal/mol in the proximity of S1710 backbone oxygen before an additional jump to ~11.5 kcal/mol close to K1419. This is the second instance we see where S1710 plays a fundamental role in ion permeation in this MD study.
Figure 5.
The electrostatic Poisson–Boltzmann solvation energy profile of one sodium ion pushed through the two SFs. The calculation adopts a 1D rigid potential scan where sodium is allowed to be pushed slowly toward the central cavity of the channel in consecutive steps of 0.2 Å each in the Z-direction. Protein conformation is fixed and the selected conformation was chosen such that the sodium ion experiences minimal steric clashes. (A) The 2D plot of the scan where a deep minima appears to exist at the region between the two SFs, close to S1710, and two maxima appears to exist close to R376 and K1419. (B) The locations of these residues relative to the sodium direction are represented as closely overlapping vdW spheres.
Abbreviations: SF, selectivity filter; vdW, van derWaals.
A combination of positively charged, negatively charged, and neutral amino acid residues in the SFs was found to be significant for preferentially filtering sodium ions over other ions that are abundant in the physiological microenvironment. In contrast to the SFs of the potassium channel where the pore lining residues are simply the backbone carbonyl oxygen atoms, the presence of several electrostatic energy barriers in VGSCs complicates the permeation of sodium. These energy barriers originate from the different side chains of the pore lining residues and justify why a simple direct perpendicular flux of sodium along the z-axis across the SFs is not possible in mammalian VGSCs. Together with other mechanisms, this might add to the previous explanations of the ion selectivity that has been previously attributed to size and hydration effects.32,54,58,66
Role of water molecules in ion permeation
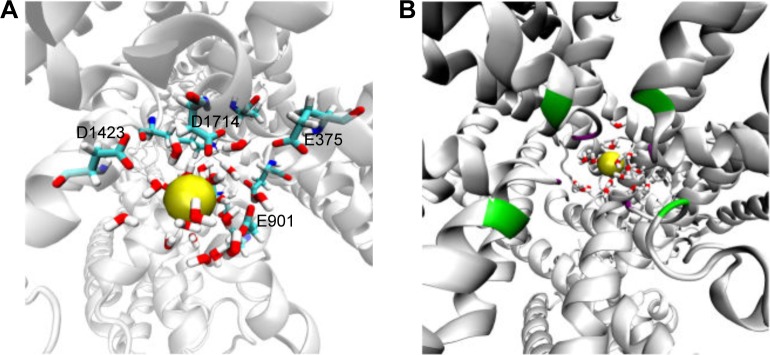
Unlike potassium channels,67 water molecules displayed important roles in the dynamics of the hNav1.5 channel in this study. During classical MD simulations, the hydration shell of the sodium ion drove the ion into the central cavity of the ion channel (Figure 6A). Previous experimental studies have shown that the sodium ion is hydrated inside the SF of the NavAb bacterial channel.8 The hydration of sodium ions is known to be important in providing energetically favorable environment for Na+ permeation through the SF of sodium channels, when compared to that of hydration of potassium ions at potassium channels.68 A possible role of these hydrating water molecules is to assist sodium for binding with the SF residues. In our MD simulations, the water molecules were particularly found to interact with the E and D residues at the outer SF ring (EEDD) – that is E375, E901, D1423, and D1714 residues – so that there was a chance for sodium to slide and escape toward the central cavity of the channel. This also reaffirms an old hypothesis reported by B. Hille69 about the need of water hydration to satisfy H-bond requirements for negatively charged SF residues in sodium channels.69 The significance of water molecules in sodium ion permeation were also established in our SMD simulations, which are discussed further.
Figure 6.
The hydration of sodium ion at the outer SF (A) and the central cavity (B). As we can see in (A), water molecules allow sodium to slide through the filter by satisfying the H-bods of the negatively charged SF residues, which are E375, E901, D1423, and D1714. In (B), inner and outer SF residues shown as green and violet batches, respectively, over the cartoon representation of the hNav1.5 protein.
Abbreviation: SF, selectivity filter.
Ramachandran analysis at the end of the classical MD simulation
It was also noted that, at the end of the MD simulation (Figure S2), our model had almost 99% of the residues in the favorable and allowed regions of the Ramachandran plot and <2% of the residues in the unfavorable region, mostly in the extracellular loops region. This indicates that classical MD simulation was very successful in refining the model. At the end of the classical MD journey, we observed that sodium remains hydrated in the central cavity until the end of the simulation time (Figure 6B). At this stage, we then decided to push the entrapped sodium ion to the other side of the channel through the application of SMD.
SMD simulation to release the ion from the cavity
As indicated earlier, a sodium ion, which was captured by the SF during the early stages of the classical MD simulations, entered into the central cavity of the hNav1.5 channel and remained bound in this area for >350 ns. A previous microseconds MD study (~21.6 μs) on the bacterial NavAB also found that the sodium ion that passed through the SF continued to be trapped in the cavity region and, therefore, it was suggested that this cavity in the sodium ion channels may be acting as a binding site for sodium ions.58 It is obvious that some intricate chemical mechanisms are inaccessible within the affordable computational limits of classical MD simulations. In such cases, enhanced sampling MD approaches can be very useful.70,71 In this study, we decided to apply a nonequilibrium SMD approach (an enhanced sampling method) to induce, with the help of artificial force, the release of the trapped ion from the central cavity into the bulk water through the four S6 helices of domains DI–DIV. The usefulness of the SMD approach for such applications has been discussed in detail in Methods. Such simulations help to identify the key amino acid residues that control access to the ion-release pathways, thus providing mechanistic insights into ion permeation, as described by a number of earlier studies.27,30,32 Nevertheless, molecular details on the ion permeation from the central cavity of the hNav1.5 ion channel into the intracellular environment are rather limited in the literature.
SMD simulations were performed for seven snapshots, which we named as snap1 (for the final snapshot of the classical MD trajectory), snap2, snap3, snap4, snap5, snap6, and snap7 – all collected at a 50-ns time interval from the classical MD trajectory. The SMD simulations of the selected structures showed that the sodium ion could permeate through two different pathways (named pathway 1 and pathway 2 in this study). This indicates that the conformational changes that occurred in the hNav1.5 structure during the classical MD simulations had impacted the process of ion permeation in SMD. Mechanistic details of ion permeation through the two pathways during SMD simulations are discussed here.
Ion permeation via pathway 1
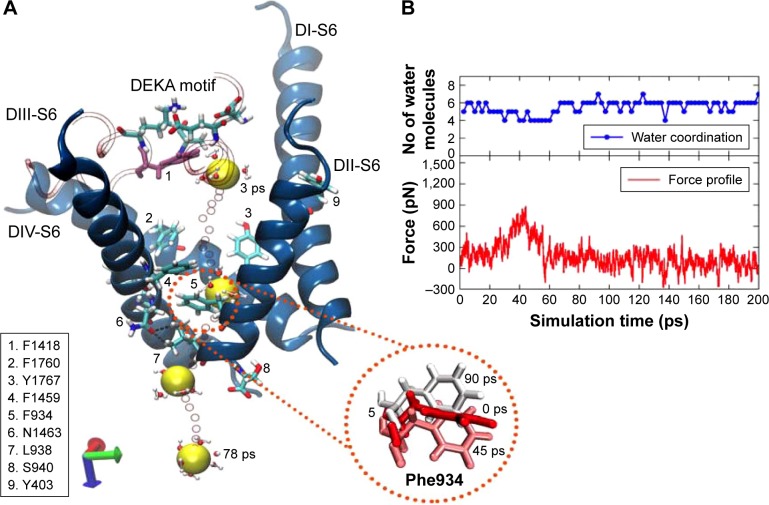
SMD simulations of the snap1 structure (or the final snapshot) indicated that the sodium ion, under the influence of an extra force, permeated into the intracellular solution (or bulk water) via the S6 helices of domains DII and DIII. We dub this pathway (or tunnel) pathway 1 in the text hereafter. Figure 7 represents the process of ion permeation from the cavity into the bulk water through pathway 1 and the corresponding force profile of the pull for this trajectory (of snap1). In this trajectory, initially, the sodium ion was bound close to the DEKA filter and between the P1/P2 turns of DIII (left) and DII (right) domains on either sides, which are shown as tube representations in Figure 7. As the ion was pulled by the application of the external force, it left from its initial position witĥ500 pN and passed through the hydrophobic contacts of F1760 and Y1767 (located on the DIV-S6 helix) that protrude toward the cavity region. At ~20 ps, the forward movement of the sodium ion in this direction was found to be severely obstructed by: 1) the stacking arrangements of two phenylalanine residues, F1459 (from DIII-S6 helix) and F934 (from DII-S6), and followed by 2) the strong hydrogen bonds (H-bonds) formed between the side chains of N1463 (from DIII-S6) and L938 (from DII-S6). As a result, the external force was increased to ~900 pN to rupture these interactions and pull the ion to outside these barriers. It can be seen in the force profile presented in Figure 7 that the force, which waŝ200 pN at 20 ps, gradually increased and reached a peak of ~900 pN at 45 ps. At this point, the F934 residue flipped its side-chain orientation (Figure 7) to clear the route for ion permeation. Subsequently, the H-bonds between N1463 and L938 were also ruptured with ~600 pN to release the ion from the cavity barricaded by S6 helices. Refer to Figure S5 for the time-evolution of H-bond distances between these two residues, which describes that the H-bond reached maximum fluctuations of 5–6 Å during 35–55 ps of SMD trajectory, coinciding with the time frame of the maxima peak in the force profile (Figure 7).
Figure 7.
The pulling of hNa+ ion out of the central cavity of the hNav1.5 model in the final snapshot (or snap1) through pathway 1. The 3D representation (A) describes that the hNa+ ion (shown as a yellow vdW sphere) was trapped near the DEKA motif at the central cavity of the ion channel exiting through the S6 helices (shown as blue ribbons) of the domains DII and DIII (pathway 1). The ion, under the influence of external force, passes through a number of hydrophobic residues (shown as sticks and listed in the figure) and is finally released by the conformational changes of F934 (within the circle) and the disruption of H-bonds between N1463 and L938 residues (shown as broken lines in black). The positions of the ion surrounded by water molecules at different timescales (3, 42, 63, and 78 ps) during the SMD simulation are shown as vdW spheres in yellow and the positions of the ions along each step until the release are shown as smaller CPK spheres in red. The corresponding force profile for the pulling of the ion and the numbers of water molecules surrounding the ions throughout this trajectory are shown (B), respectively, of the image on the right.
Abbreviations: CPK, Corey-Pauling-Koltun; SMD, steered molecular dynamics; vdW, van derWaals.
After completely releasing the ion from the influence of S6 helices (ie, >63 ps), the force profile mostly remained as a trough until the end of the SMD simulation. It is also important to note (Figure 7) that the sodium ion was always hydrated by water molecules throughout the trajectory; however, the coordination number of water molecules with sodium dropped to 4, when the force profile was at its peak. This clarifies that the ion had to be partially dehydrated so as to permeate through the narrow edge of S6 helices of DII and DIII that was secured by the Phe stacks and H-bond interactions. The coordination number switched back to 6–7 after the ion was released into the intracellular solution (ie, bulk water). SMD simulations found that the sodium ion trapped at the central cavity in two other structures – snap2 (Figure S6) and snap4 (Figure S7) – was also released via pathway 1. However, there were some subtle differences within these structures, which were also reflected in their force profiles (Figures S6 and S7). These discussions are provided in the supplementary information. Nevertheless the overall processes of ion permeation in these structures (snap1, snap2, and snap4) were mostly similar.
Ion permeation via pathway 2
Unlike in the structures discussed earlier, the ion permeation in snap3, snap6, and snap7, which were sampled at different timeframes from the classical MD trajectory, occurred through the S6 helices of domains DIII and D1V. We name this pathway (or tunnel) as pathway 2 in the text hereafter. The change in the direction of permeation was majorly triggered by the orientations of F1419 and F892, located on the P1/P2 turn of DIII and P1 helix of DII, respectively.
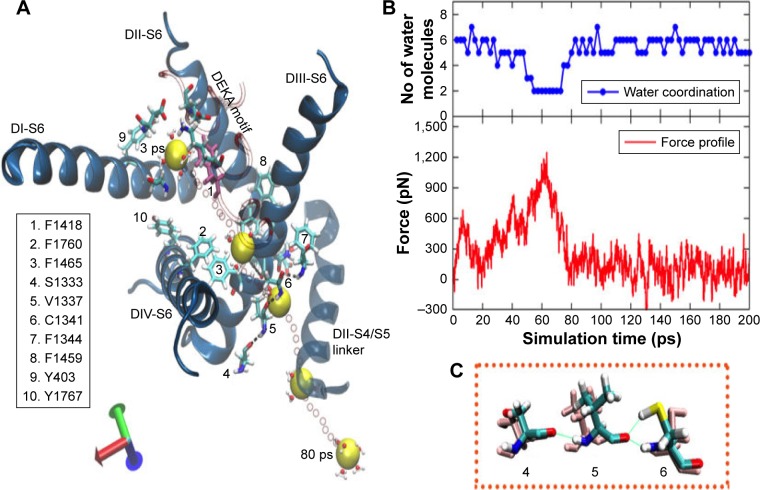
Figure 8 illustrates the mechanisms of ion expulsion from the cavity of snap6 through pathway 2, along with the related force profile of the pull for this trajectory. At the initial stage, the sodium ion was bound near to the DEKA filter, and the P1/P2 turn of DIII and P1 helix of DII moved significantly such that Phe1418 from the former (shown in mauve color in Figure 8) and Phe892 from the latter tilted their conformations and blocked the route toward pathway 1. As a result, the ion explored an alternate direction to exit the channel.
Figure 8.
The pulling of the hNa+ ion out of the central cavity of the hNav1.5 model in the snap6 through pathway 2. (A) The 3D representation on the left describes that the hNa+ ion (shown as a yellow vdW sphere) trapped near the DEKA motif at the central cavity of the ion channel exits through the S6 helices (shown as blue ribbons) of the domains DIII and DIV. The ion, under the influence of external force, passes through a number of hydrophobic residues (shown as sticks and listed in the figure) and is finally released by disruption of H-bonds between V1337 and C1341 residues (shown within rectangular box) and later via the short S4/S5 helix of DII. The positions of the ion surrounded by water molecules at different timescales (3, 40, 60, and 78 ps) during the SMD simulation are shown as vdW spheres in yellow, and the positions of the ions along each step until the exit are shown as smaller CPK spheres in red. (B) The corresponding force profile for the pulling of the ion and the numbers of water molecules surrounding the ions throughout this trajectory are shown in the bottom and top panels, respectively, of the image (C).
Abbreviations: CPK, Corey-Pauling-Koltun; SMD, steered molecular dynamics; vdW, van derWaals.
The permeation through pathway 2 also began by releasing the ion from its initial contacts from the residues forming the DEKA filter; nevertheless, the ion immediately (1–2 ps) encountered a transient cation-π scenario with F1418 in its new orientation in this snap6 structure (as opposed to snaps 1, 2, and 4). Breaking the ion free from this cation-π interaction required a considerably higher force of ~620 pN at the very early stage of SMD simulation, that is, <20 ps (Figure 8). Later, the ion passed through the hydrophobic contacts of F1760 and Y1767 (located on the DIV-S6 helix) that are facing the region of ion permeation, which resulted in the second peak (~580 pN) in the force profile between 20 and 40 ps. But, at ~35 ps of SMD simulation, the sodium ion was found to be located near the surface between DIII and DIV helices, where the onward path was inaccessible due to the stacking of another pair of F residues (similar to those in pathway 1) – F1760 and F1465. Although the force was increased, as a result of this blockade, tô900 pN at ~40 ps, this only led to the tilt of F1465, and that was insufficient for the ion to move further; the ion moved over F1465 and started exploring this surface. Subsequently, when the force was further increased to ~1,230 pN, a chain of H-bond interactions between S1333-V1337-C1341-F1344 was disturbed. Most particularly, the SH group of C1341, which was forming a strong H-bond with the carbonyl oxygen atom of V1337, tilted its conformation by ~180°, thereby rupturing the H-bond with the V1337 residue (refer to the rectangular box in Figure 8). This cleared a narrow route for the sodium ion to pass the H-bond fence (at ~60 ps) and permeate out of the S6 helices. Following expulsion from S6 helices, the ion permeating via pathway 2, unlike in pathway 1, was unable to freely migrate into the bulk water, as it faced the S4/S6 linker of DII in this direction that controlled further ion movement (Figure 8). As a consequence, the force was still maintained as high as 500–600 pN to release the ion from the influence of this short helical linker. Therefore, the force profile of this SMD trajectory (Figure 8) did not flatten until 80 ps, after which the ion permeated into the bulk water. As indicated earlier, similar mechanisms of ion permeation via pathway 2 were also observed in snap3 and snap7. For details pertaining to these structures, please refer to the supplementary information (Figures S8 and S9).
As the pathway 2 is a very narrow cavity, the ion had to drop most of the water molecules from its solvation shell and reduce the number to as low as 2. Especially when the ion passed through the ruptured H-bond fence and traversed toward the S4/S5 linker (of DII), it was accompanied by only two water molecules (as shown in the water coordination graph in Figure 8). As expected, the full solvation shell of the ion was regained after it permeated in the bulk water. Thus, it is apparent that ion passage through pathway 2 is predominantly dictated by aromatic residues, F1760 and F1465, cascade of H-bonds formed by S1333-V1337-C1341-F1344 interactions, and the dynamics of the S4/S5 helical linker of DII.
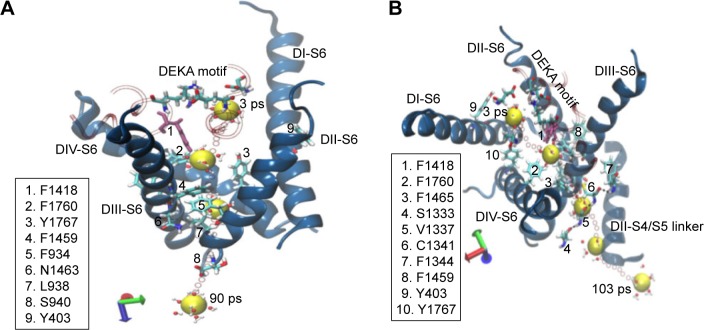
Different from the other snapshots, which mostly permeated in either of the pathways (1 or 2), sodium in the snap5 structure permeated via both pathway 1 and pathway 2 (Figure 9) during repeated simulations. The main reason for this comes from the orientation of the F1418 residue (shown in mauve color in Figure 9). The aromatic side chain of F1418 is neither tilted toward pathway 1 nor on pathway 2. Instead, this residue is placed exactly in the center, such that it leaves both the pathways sufficiently clear for ion permeation. Therefore, the ion trapped in the central cavity of the structure of snap5 permeates through both the pathways during SMD simulations. Refer to Figure S10 for the force profiles and water coordination number plot related to the release of ion from the snap5 structure of hNav1.5 through pathway 1 (Figure S10A) and pathway 2 (Figure S10B). We also verified the effects of gating by the key residues identified for both the pathways on water exchange. Figure S11 compares the exchange of water molecules through pathways 1 and 2 during the initial and final points of SMD simulations for the two structures, snap1 and snap3, respectively. We found that, at the initial step of SMD simulation for both the structures (snap1 and snap3), the water molecules were unable to pass through the channel and were blocked by the respective key residues identified in each of the pathways. Whereas, at the final step of SMD, it was found that the side-chain changes in the key residues cleared the pathways, thus allowing water exchanges through the channel (Figure S11).
Figure 9.
The pulling of the hNa+ ion out of the central cavity of the hNav1.5 model in the snap5 of the classical MD simulation. The 3D representations describe that the hNa+ ion (shown as a yellow vdW sphere) trapped at the central cavity of the ion channel in snap5 exits either through pathway 1 (within S6 helices of DII and DIII, [A]) or through pathway 2 (within S6 helices of DIII and DIV, [B]). Positions of the ion surrounded by water molecules at different timescales during the SMD simulation are shown as vdW spheres in yellow, and the positions of the ions along each step until the release from S6 helices are shown as smaller CPK spheres in red.
Abbreviations: CPK, Corey-Pauling-Koltun; SMD, steered molecular dynamics; vdW, van derWaals.
It is important to note that it is less probable for the ions to permeate via pathway 2 under physiological conditions, as the solvation shell of the sodium ion drops severely while permeating through this pathway. Moreover, SMD force profiles for the trajectories of pathway 2 are higher than those of pathway 1, which means that the energetic barriers on the former could potentially be larger than on the latter. Moreover, the ion permeation in pathway 2 changed its direction toward the S1333-V1337-C1341-F1344 H-bonds only because the F1419 and F892 stacking did not clear the path for the further movement of ion between the S6 helices of DIII and DIV. Thus, it is possible that mutating one of these Phe residues could open up the cavity between the S6 helices of DIII and DIV for ion permeation.
Binding-site identification and clustering of dominant conformations
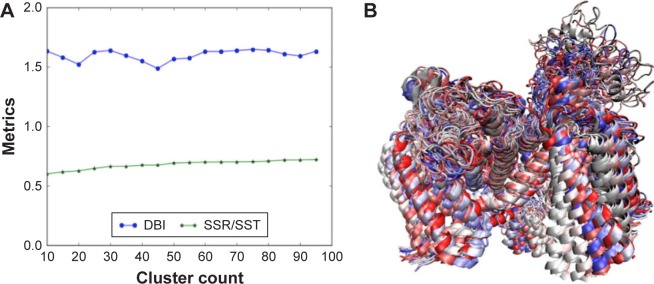
Our SMD simulations identified a number of phenylalanine residues (F892, F934, F1418, F1459, F1465, and F1760) to control the permeation of sodium ion through the S6 helices of the ion channel. In agreement with our findings, previous studies also reported that the small-molecule binding site in hNav1.5 structure is located around the aromatic F1760 residue.72–75 Therefore, we performed an atomistic RMSD-based clustering of the residues surrounding the F1760 residue, in order to explore the conformational space of the small-molecule binding site of the hNav1.5 protein. Convergence of the clustering was assessed by the elbow criterion of the DBI versus the SSR/SST plot, and an ensemble of dominant hNav1.5 protein conformations was obtained.
In statistics, the SSR is the sum of the squared residual, the SST is the total sum of squares, and DBI is the Davies–Bouldin Index. Assuming different clustering scenarios, the optimum number of protein conformations suitable for carrying out docking simulations can be obtained using the elbow criterion, where the DBI experiences a local minimum on an almost flat SSR/SST line. This indicates that clustering is converged and the corresponding x-axis represents the optimum number of protein conformations. The method has been successfully applied in previous studies,37,39 and more theoretical details can be found in an excellent review by Shao et al.76 As shown in Figure 10A, clustering converged at ~20 dominant protein conformations. We used these dominant binding-site conformations to test the capability of the model to efficiently rank a number of known hNav1.5 blockers. All extracted 20 dominant protein conformations are superimposed and shown in Figure 10B.
Figure 10.
The RMSD clustering for binding-site residues of the hNav1.5 model over the 580 MD production simulations. (A) The DBI over the SSR/SST metrices plot is shown, in which the clustering converges at 20 dominant PDB conformations; (B) the superimposed structures of the 20 dominant PDB conformations, selected through the RMSD clustering of binding-site residues of the hNav1.5 MD trajectory, are also provided.
Abbreviations: DBI, Davies–Bouldin index; RMSD, root-mean square deviation; SSR, sum of squares regression; SST, total sum of squares.
Small molecules binding to hNav1.5
The ability of our model to predict drug-mediated hNav1.5 blockage has been tested against 35 ligands, which are known to block hNav1.5 strongly (IC50 <1 μM, 24 compounds) or weakly (IC50 >25 μM, 8 compounds). Additionally, three marketed antiarrhythmic hNav1.5 blockers – ranolazine (IC50 5.9 μM),77 lidocaine (IC50 10.8 μM),78 and flecainide – have also been included. Flecainide has been shown to bind strongly to the open activated state of the channel (IC50 7 μM) and only very weakly to the closed/inactivated state (IC50 345 μM).79 We have correlated the in vitro measured IC50 values against the calculated AMBER-MMGBSA binding energies to assess the success of the model to discriminate strong from weak hNav1.5 blockers.
Table 1 lists the chemical structures, the CHEMBL IDs, the IC50, the pIC50, and the calculated AMBER-MMGBSA binding energies of the tested molecules. The table also shows the Pearson’s correlation coefficients (rpearson) between the IC50 against the AMBER-MMGBSA binding energies. As we can see in the table, a good correlation (rpearson =0.7) has been achieved between the measured IC50 and the calculated binding energies. For example, flecainide, which has been shown previously to inhibit the closed state of hNav1.5 very weakly (IC50 345 μM, see above),79 indeed exhibited the highest binding energy (weakest affinity) among all of the inhibitors under study (−16.79 kcal/mol). On the other hand, ranolazine exhibits one of the lowest binding energies (strong affinity) among the tested inhibitors, with −39.35 kcal/mol. A scatter plot of the pIC50 values against the calculated binding energies is given in Figure 11. In general, the model has a good tendency to predict strong blockers correctly. For example, with the exception of CHEMBL2012259, none of the strong blockers (IC50 <1 μM) exhibited a binding energy more than −30.00 kcal/mol.
Figure 11.
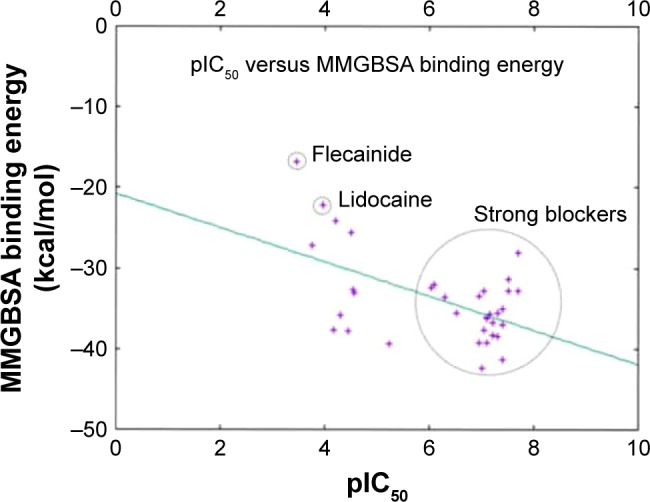
A 2D scatter plot comparing the calculated AMBER-MMGBSA binding free energies against the in vitro measured pIC50 data from CHEMBL. Data points were fitted using gnuplot according to the model: f(x) = ax + b; where a is given by −2.12 and b is given by −20.74. The point represents flecainide (weakest blocker); lidocaine and the strong blockers regions are circled.
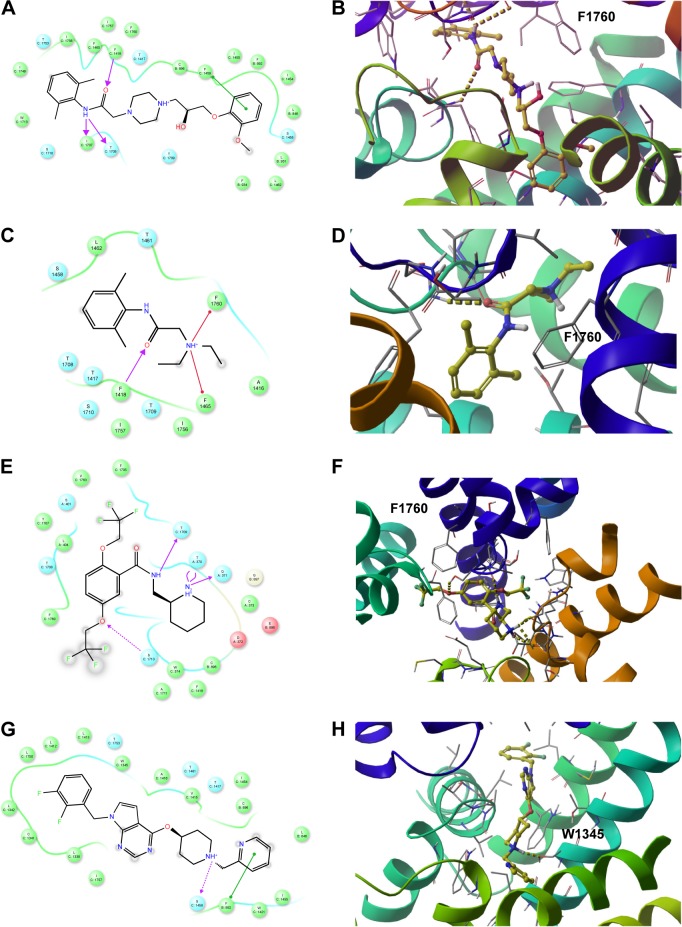
To gain more insights into the predicted binding modes of some of the tested compounds with the hNav1.5 model, the exact binding modes of the lowest energy complexes of ranolazine, lidocaine, flecainide, and CHEMBL2012299 have been analyzed. The first three compounds are known anti-arrhythmic drugs in the market and the last compound is presumably one of the strongest hNav1.5 blockers reported so far (IC50 =20 nm).80 We depicted the 2D and 3D (top view) ligand interaction diagrams of the four compounds in Figure 12. As can be seen in the figure, the benzamide aromatic head of ranolazine is flanked between the two aromatic rings of F1760 and W1713, Figure 12A and B. The benzamide nitrogen forms strong H-bonds with the backbone carbonyl oxygens of I1707 and T1708 and the side-chain hydroxyl of S1710. Consistent with our data, it has been previously reported that an F1760 mutation to A1760 significantly reduces ranolazine efficacy as a potent antiarrhythmic drug in vitro.81 This presumably occurs as a result of perturbing the cluster of lipophilic residues such as F1418, F1465, I1756, and I1757 that surround the benzamide group of ranolazine upon mutating the F1760 residue. It is important to note that our SMD simulations reported in this work identified F1418 and F1465 as playing important roles in the ion permeation from the central cavity into the intracellular solution. Furthermore, the predicted binding mode of ranolazine is located far from Y1767, excluding any direct interaction with this residue. Again, this is consistent with previously reported experimental data that showed that Y1767 does not interact with ranolazine.36 Our data also proposes a potential role of W1713 as a target site for binding ranolazine.
Figure 12.
The 2D (left panel) and 3D (right panel; top view) ligand interactions for selected four hNav1.5 blockers under study. (A, B) Ranolazine, (C, D) lidocaine (E, F), flecainide, and (G, H) CHEMBL2012299. In contrast to ranolazine, lidocaine, and flecainide that bind to the center of the channel close to Phe1760, the binding mode of CHEMBL2012299 shows that it is shifted to the fenestration sites of the hNav1.5 protein.
The second blocker, lidocaine, exhibited a binding mode that is somehow different from ranolazine. Lidocaine is presumably the most studied hNav1.5 small-molecule blocker.36,82,83 Lidocaine has been shown to bind either the closed or an inactivated state of Nav1.5.82–84 Furthermore, there is a debate in the literature regarding which ionization state of lidocaine interacts with hNav1.5 and whether the exact action of lidocaine is due to a state-dependent or -independent block of hNav1.5. An interesting study by Hanck et al has discussed the ability of lidocaine to exert blocking action on hNav1.5 through interaction with both an open and closed state of the channel.82 They have also discussed the possibility of whether the hNav1.5 blocking activity of lidocaine can be related to its charged state, being a weak base (pKa =7.96). The final conclusion from that study is that lidocaine can interact in its charged (+1) state with an open state of the channel, whereas it interacts with the closed state of the channel in a neutral form. The study also concluded that both types of interactions are important to achieve an optimum blocking effect. However, a more recent study by Pless et al has proven, through a combination of experiments and very accurate ab initio electrostatic potential calculations, that charged (+1) lidocaine interacts with an inactivated state of hNav1.5 through a strong cation-π stacking interaction with F1760.36 In the current study and in accordance with the data reported by Pless et al,36 the most favorable binding pose of lidocaine forms a cation-π stacking interaction with F1760 (Figure 12C and D). Lidocaine also interacts with F1465 and F1418.
The third blocker, flecainide, exhibited the weakest binding energy among the whole list of inhibitors under study (binding energy =−16.79 kcal/mol) and also the lowest inhibition against hNav1.5 (IC50 =345 μM for the closed state). Flecainide is known to bind the open state of hNav1.5,79 which explains the calculated unfavorable binding energy against our closed model of hNav1.5. Unlike lidocaine that interacts directly and strongly with F1760, flecainide does not show such interaction, although both drugs are representatives of class 1b antiarrhythmic drugs. These data are also in concordance with those by Pless et al, who showed that flecainide does not interact directly with F1760.36 Instead, the benzamide nitrogen of flecainide is H-bonded to the backbone carbonyl oxygen of T1709. Additionally; the di-triflouroethoxy aromatic ring of flecainide forms a lipophilic interaction with F1760, L404, Y1767, V1763, and F1705 (Figure 12E and F). However, none of these interactions are strong enough to provide a stable interaction with this state of the channel. Modeling an open state of the channel might shed light on the exact interaction of flecainide that requires significant conformational changes of the channel to achieve the strong affinity measured with an open state of the hNav1.5 channel (IC50 =7 μM).
In contrast to ranolazine, lidocaine, and flecainide that bind in the vicinity of F1760, CHEMBL2012299 is slightly shifted toward the lipophilic fenestration sites of the hNav1.5 protein. These lipophilic fenestration sites are believed to be the route of entry of the small-molecule VGSCs blockers to reach their designated binding site.85,86 As can be seen in Figure 12G and H, the diflouro-phenyl ring engages with a cluster of lipophilic residues such as L1338, L1342, L1750, L142, and L1413. The hydrophilic charged head at the other side of the molecule engages with S1458, forming a strong charge-assisted H-bond. The terminal pyridine ring forms a strong π–π stacking interaction with F892. Additional mutational analysis is unarguably warranted to confirm these findings. In the current study, we did not attempt to model the access of the small molecules through the fenestration sites, given the fact that such simulations are too computationally demanding (microseconds).86 Instead, all molecules were assumed to be in their already bound states to the active site of the channel.
Limitations
Although the present study has been carefully conducted, it is important to acknowledge that there are some limitations that are mainly due to the lack of good templates and to our efforts to minimize computational costs without sacrificing accuracy. The first limitation was the omission of two cytoplasmic domains due to the lack of good templates to accurately model these segments. Omitting these domains, however, is not expected to have a significant impact on the ion-gating properties and/or drug binding that are predominantly centered at the transmembrane region. With the current “state-of-the-art” facilities, it will not be surprising if more structural templates (if not the entire hNav1.5 structure) become available in the PDB. In such cases, the homology model reported in this study can be improved in quality by including the neglected domains.
Another caveat is the simulation length. We performed classical MD simulations of our system up to a length of 680 ns, which sometimes was insufficient to sample large conformational changes in the ion channel. However, it is very important to recognize that a single 680-ns long trajectory for such a massive system (hNav1.5) is a very reasonable length that was adequate to witness the capturing and filtering of a sodium ion into the transmembrane segment of the ion channel. Nevertheless, observing the natural permeation of the ion from the central cavity into the cell, which could possibly happen at the micro- to millisecond time scales, was not feasible in the current study.
An additional caveat is related to the lengths of SMD simulations. It can be argued that the 1-ns long SMD trajectories (ie, five repeats of 200-ps simulations) could fall short for obtaining an accurate estimate of the force (or the energy barriers). Nevertheless, we performed almost a 100 SMD simulations, which included several repeats, multiple combinations of parameters, and different starting configurations, in order to confirm that the processes identified in our study are not arising due to the bias introduced. Moreover, in each of the SMD simulations, the pulling distance for the ion was set to be as low as 0.0009 Å/timestep. Our current SMD simulations have already identified several key residues in the hNav1.5 that were not reported elsewhere. Further, we reported only two permeation pathways for the sodium ion through the hNav1.5 channel, and it is possible that more such pathways could be discovered with additional computational power.
Conclusion
Using sophisticated modeling tools, we were able to gain a number of key atomistic details about sodium permeation and drug-mediated hNav1.5 blockage. Our model sheds light on the molecular basis behind several known mutational data reported for the hNav1.5 ion channel, such as the D372A, E898A, F1760A, and R222Q (Figure S12). Exceptionally long MD simulations show that sodium passes through the selectivity pore mainly under the influence of the deep electrostatic potential well created by the D and E residues at the inner and outer SFs. We report the existence of two sodium ion-binding sites at the outer SFs, and discussed the potential role of K as a gatekeeper for the inner SF. Our SMD simulations reveal novel mechanistic information about the different pathways through which sodium permeated from central cavity of the transmembrane into the intracellular solution. A number of key phenylalanine residues, such as F892, F934, F1418, F1459, F1465, and F1760, and H-bond pairs (V1337-C1341 and N1463-L938) have been found to implicate ion permeation in our SMD simulation.
By testing a panel of small-molecule drugs against our hNav1.5 model, we achieved a 0.7 correlation with the reported IC50 values. The binding modes of several known hNav1.5 blockers are reproduced. Lidocaine is confirmed to bind in its charged form to the closed state of the channel through a strong cation–π stacking with F1760. The predicted binding mode of ranolazine confirms that a direct interaction with Y1767 is absent. Significant structural changes for the closed state of the hNav1.5 ion channel are mandatory to achieve an optimum interaction with flecainide. Other inhibitors, such as CHEMBL2012299, are slightly shifted toward the fenestration sites of the channel rather than toward the channel’s center; these inhibitors form strong lipophilic interactions with cluster of lipophilic residues. Moreover, the small molecules were found to interact with a number of other residues, such as F1418 and F1465, which were identified as significant players in controlling ion permeation in our SMD simulations.
We believe that the information reported in this work can greatly help interested researchers and drug designers in enhancing their understanding of the structure of hNav1.5 and the ion permeation through the channel. The results also have the potential to open up novel avenues for rationally designing small-molecule drugs to target or avoid hNav1.5 ion channel blockage.
Acknowledgments
This work was funded by a Natural Sciences and Engineering Research Council of Canada (NSERC) discovery grant. All computations were performed on Westgrid, SHARCNET, and local cluster as well as on the Li Ka Shing Institute of Virology BGQ supercomputer at the SciNet HPC Consortium located at the University of Toronto.
Footnotes
Disclosure
The authors report no conflicts of interest in this work.
References
- 1.Yu FH, Catterall WA. Overview of the voltage-gated sodium channel family. Genome Biol. 2003;4(3):207. doi: 10.1186/gb-2003-4-3-207. [DOI] [PMC free article] [PubMed] [Google Scholar]
- 2.Catterall WA, Goldin AL, Waxman SG. International Union of Pharmacology. XLVII. Nomenclature and structure-function relationships of voltage-gated sodium channels. Pharmacol Rev. 2005;57(4):397–409. doi: 10.1124/pr.57.4.4. [DOI] [PubMed] [Google Scholar]
- 3.Roden DM, Balser JR, George AL, Jr, Anderson ME. Cardiac ion channels. Annu Rev Physiol. 2002;64:431–475. doi: 10.1146/annurev.physiol.64.083101.145105. [DOI] [PubMed] [Google Scholar]
- 4.Brackenbury WJ, Isom LL. Na channel β subunits: overachievers of the ion channel family. Front Pharmacol. 2011;2:53. doi: 10.3389/fphar.2011.00053. [DOI] [PMC free article] [PubMed] [Google Scholar]
- 5.Catterall WA. Structure and function of voltage-gated sodium channels at atomic resolution. Exp Physiol. 2014;99(1):35–51. doi: 10.1113/expphysiol.2013.071969. [DOI] [PMC free article] [PubMed] [Google Scholar]
- 6.Campuzano O, Beltrán-Alvarez P, Iglesias A, Scornik F, Pérez G, Brugada R. Genetics and cardiac channelopathies. Genet Med. 2010;12(5):260–267. doi: 10.1097/GIM.0b013e3181d81636. [DOI] [PubMed] [Google Scholar]
- 7.Remme CA. Cardiac sodium channelopathy associated with SCN5A mutations: electrophysiological, molecular and genetic aspects. J Physiol. 2013;591(17):4099–4116. doi: 10.1113/jphysiol.2013.256461. [DOI] [PMC free article] [PubMed] [Google Scholar]
- 8.Payandeh J, Scheuer T, Zheng N, Catterall WA. The crystal structure of a voltage-gated sodium channel. Nature. 2011;475(7356):353–358. doi: 10.1038/nature10238. [DOI] [PMC free article] [PubMed] [Google Scholar]
- 9.O’Reilly AO, Eberhardt E, Weidner C, Alzheimer C, Wallace BA, Lampert A. Bisphenol A binds to the local anesthetic receptor site to block the human cardiac sodium channel. PLoS One. 2012;7(7):e41667. doi: 10.1371/journal.pone.0041667. [DOI] [PMC free article] [PubMed] [Google Scholar]
- 10.Moreau A, Gosselin-Badaroudine P, Delemotte L, Klein ML, Chahine M. Gating pore currents are defects in common with two Nav1.5 mutations in patients with mixed arrhythmias and dilated cardiomyopathy. J Gen Physiol. 2015;145(2):93–106. doi: 10.1085/jgp.201411304. [DOI] [PMC free article] [PubMed] [Google Scholar]
- 11.Payandeh J, Gamal El-Din TM, Scheuer T, Zheng N, Catterall WA. Crystal structure of a voltage-gated sodium channel in two potentially inactivated states. Nature. 2012;486(7401):135–139. doi: 10.1038/nature11077. [DOI] [PMC free article] [PubMed] [Google Scholar]
- 12.Poulin H, Bruhova I, Timour Q, et al. Fluoxetine blocks Nav1.5 channels via a mechanism similar to that of class 1 antiarrhythmics. Mol Pharmacol. 2014;86(4):378–389. doi: 10.1124/mol.114.093104. [DOI] [PMC free article] [PubMed] [Google Scholar]
- 13.O’Leary ME, Chahine M. MTSET modification of D4S6 cysteines stabilize the fast inactivated state of Nav1.5 sodium channels. Front Pharmacol. 2015;6:118. doi: 10.3389/fphar.2015.00118. [DOI] [PMC free article] [PubMed] [Google Scholar]
- 14.Wang L, Meng X, Yuchi Z, et al. De novo mutation in the SCN5A gene associated with Brugada syndrome. Cell Physiol Biochem. 2015;36(6):2250–2262. doi: 10.1159/000430189. [DOI] [PubMed] [Google Scholar]
- 15.Kelley LA, Mezulis S, Yates CM, Wass MN, Sternberg MJ. The Phyre2 web portal for protein modeling, prediction and analysis. Nat Protoc. 2015;10(6):845–858. doi: 10.1038/nprot.2015.053. [DOI] [PMC free article] [PubMed] [Google Scholar]
- 16.Pettersen EF, Goddard TD, Huang CC, et al. UCSF Chimera – a visualization system for exploratory research and analysis. J Comput Chem. 2004;25(13):1605–1612. doi: 10.1002/jcc.20084. [DOI] [PubMed] [Google Scholar]
- 17.Roy A, Kucukural A, Zhang Y. I-TASSER: a unified platform for automated protein structure and function prediction. Nat Protoc. 2010;5(4):725–738. doi: 10.1038/nprot.2010.5. [DOI] [PMC free article] [PubMed] [Google Scholar]
- 18.Mahdavi S, Kuyucak S. Molecular dynamics study of binding of μ-conotoxin GIIIA to the voltage-gated sodium channel Nav1.4. PLoS One. 2014;9(8):e105300. doi: 10.1371/journal.pone.0105300. [DOI] [PMC free article] [PubMed] [Google Scholar]
- 19.Yang Y, Dib-Hajj SD, Zhang J, et al. Structural homology modeling and mutant cycle analysis predict pharmacoresponsiveness of a Na(V)1.7 mutant channel. Nat Commun. 2012;3:1186. doi: 10.1038/ncomms2184. [DOI] [PMC free article] [PubMed] [Google Scholar]
- 20.Wu EL, Cheng X, Jo S, et al. CHARMM-GUI membrane builder toward realistic biological membrane simulations. J Comput Chem. 2014;35(27):1997–2004. doi: 10.1002/jcc.23702. [DOI] [PMC free article] [PubMed] [Google Scholar]
- 21.Huang J, MacKerell AD., Jr CHARMM36 all-atom additive protein force field: validation based on comparison to NMR data. J Comput Chem. 2013;34(25):2135–2145. doi: 10.1002/jcc.23354. [DOI] [PMC free article] [PubMed] [Google Scholar]
- 22.Callenberg KM, Choudhary OP, de Forest GL, Gohara DW, Baker NA, Grabe M. APBSmem: a graphical interface for electrostatic calculations at the membrane. PLoS One. 2010;5(9) doi: 10.1371/journal.pone.0012722. pii: e12722. [DOI] [PMC free article] [PubMed] [Google Scholar]
- 23.Dolinsky TJ, Czodrowski P, Li H, et al. PDB2PQR: expanding and upgrading automated preparation of biomolecular structures for molecular simulations. Nucleic Acids Res. 2007;35(Web Server issue):W522–W525. doi: 10.1093/nar/gkm276. [DOI] [PMC free article] [PubMed] [Google Scholar]
- 24.Roux B, MacKinnon R. The cavity and pore helices in the KcsA K+ channel: electrostatic stabilization of monovalent cations. Science. 1999;285(5424):100–102. doi: 10.1126/science.285.5424.100. [DOI] [PubMed] [Google Scholar]
- 25.Lu H, Schulten K. The key event in force-induced unfolding of Titin’s immunoglobulin domains. Biophys J. 2000;79(1):51–65. doi: 10.1016/S0006-3495(00)76273-4. [DOI] [PMC free article] [PubMed] [Google Scholar]
- 26.Colizzi F, Perozzo R, Scapozza L, Recanatini M, Cavalli A. Single-molecule pulling simulations can discern active from inactive enzyme inhibitors. J Am Chem Soc. 2010;132(21):7361–7371. doi: 10.1021/ja100259r. [DOI] [PubMed] [Google Scholar]
- 27.Giorgino T, De Fabritiis G. A high-throughput steered molecular dynamics study on the free energy profile of ion permeation through gramicidin A. J Chem Theory Comput. 2011;7(6):1943–1950. doi: 10.1021/ct100707s. [DOI] [PubMed] [Google Scholar]
- 28.Izrailev S, Stepaniants S, Balsera M, Oono Y, Schulten K. Molecular dynamics study of unbinding of the avidin-biotin complex. Biophys J. 1997;72(4):1568–1581. doi: 10.1016/S0006-3495(97)78804-0. [DOI] [PMC free article] [PubMed] [Google Scholar]
- 29.Kalyaanamoorthy S, Chen YP. A steered molecular dynamics mediated hit discovery for histone deacetylases. Phys Chem Chem Phys. 2014;16(8):3777–3791. doi: 10.1039/c3cp53511h. [DOI] [PubMed] [Google Scholar]
- 30.Kóňa J, Minozzi M, Torre V, Carloni P. A gate mechanism indicated in the selectivity filter of the potassium channel KscA. Theor Chem Acc. 2007;117(5):1121–1129. [Google Scholar]
- 31.Kosztin D, Izrailev S, Schulten K. Unbinding of retinoic acid from its receptor studied by steered molecular dynamics. Biophys J. 1999;76(1 Pt 1):188–197. doi: 10.1016/S0006-3495(99)77188-2. [DOI] [PMC free article] [PubMed] [Google Scholar]
- 32.Mahdavi S, Kuyucak S. Mechanism of ion permeation in mammalian voltage-gated sodium channels. PLoS One. 2015;10(8):e0133000. doi: 10.1371/journal.pone.0133000. [DOI] [PMC free article] [PubMed] [Google Scholar]
- 33.Phillips JC, Braun R, Wang W, et al. Scalable molecular dynamics with NAMD. J Comput Chem. 2005;26(16):1781–1802. doi: 10.1002/jcc.20289. [DOI] [PMC free article] [PubMed] [Google Scholar]
- 34.Mujtaba MG, Wang SY, Wang GK. Prenylamine block of Nav1.5 channel is mediated via a receptor distinct from that of local anesthetics. Mol Pharmacol. 2002;62(2):415–422. doi: 10.1124/mol.62.2.415. [DOI] [PubMed] [Google Scholar]
- 35.Beyder A, Strege PR, Bernard C, Farrugia G. Membrane permeable local anesthetics modulate Na(V)1.5 mechanosensitivity. Channels (Austin) 2012;6(4):308–316. doi: 10.4161/chan.21202. [DOI] [PMC free article] [PubMed] [Google Scholar]
- 36.Pless SA, Galpin JD, Frankel A, Ahern CA. Molecular basis for class Ib anti-arrhythmic inhibition of cardiac sodium channels. Nat Commun. 2011;2:351. doi: 10.1038/ncomms1351. [DOI] [PubMed] [Google Scholar]
- 37.Anwar-Mohamed A, Barakat KH, Bhat R, et al. A human ether-á-go-go-related (hERG) ion channel atomistic model generated by long supercomputer molecular dynamics simulations and its use in predicting drug cardiotoxicity. Toxicol Lett. 2014;230(3):382–392. doi: 10.1016/j.toxlet.2014.08.007. [DOI] [PubMed] [Google Scholar]
- 38.Hu G, Wang K, Groenendyk J, et al. Human structural proteome-wide characterization of cyclosporine A targets. Bioinformatics. 2014;30(24):3561–3566. doi: 10.1093/bioinformatics/btu581. [DOI] [PMC free article] [PubMed] [Google Scholar]
- 39.Barakat KH, Anwar-Mohamed A, Tuszynski JA, Robins MJ, Tyrrell DL, Houghton M. A refined model of the HCV NS5A protein bound to daclatasvir explains drug-resistant mutations and activity against divergent genotypes. J Chem Inf Model. 2015;55(2):362–373. doi: 10.1021/ci400631n. [DOI] [PubMed] [Google Scholar]
- 40.Barakat KH, Law J, Prunotto A, et al. Detailed computational study of the active site of the hepatitis C viral RNA polymerase to aid novel drug design. J Chem Inf Model. 2013;53(11):3031–3043. doi: 10.1021/ci4003969. [DOI] [PubMed] [Google Scholar]
- 41.Barakat KH, Huzil JT, Jordan KE, Evangelinos C, Houghton M, Tuszynski J. A computational model for overcoming drug resistance using selective dual-inhibitors for aurora kinase A and its T217D variant. Mol Pharm. 2013;10(12):4572–4589. doi: 10.1021/mp4003893. [DOI] [PubMed] [Google Scholar]
- 42.Ahmed M, Barakat K. Baby steps toward modelling the full human programmed death-1 (PD-1) pathway. Receptors Clin Investig. 2015;2(3):1–5. e825. [Google Scholar]
- 43.Salomon-Ferrer R, Case DA, Walker RC. An overview of the amber biomolecular simulation package. WIREs Comput Mol Sci. 2013;3(2):198–210. [Google Scholar]
- 44.Gaulton A, Bellis LJ, Bento AP, et al. ChEMBL: a large-scale bioactivity database for drug discovery. Nucleic Acids Res. 2012;40(Database issue):D1100–D1107. doi: 10.1093/nar/gkr777. [DOI] [PMC free article] [PubMed] [Google Scholar]
- 45.Assadi HR, Shenasa H, Heidary S, Shenasa M. Antiarrhythmic effects of ranolazine in patients with cardiac arrhythmias. JACC. 2014;63(12):A336. doi: 10.1016/j.ccep.2016.02.011. [DOI] [PubMed] [Google Scholar]
- 46.Collinsworth KA, Kalman SM, Harrison DC. The clinical pharmacology of lidocaine as an antiarrhythymic drug. Circulation. 1974;50(6):1217–1230. doi: 10.1161/01.cir.50.6.1217. [DOI] [PubMed] [Google Scholar]
- 47.Andrikopoulos GK, Pastromas S, Tzeis S. Flecainide: current status and perspectives in arrhythmia management. World J Cardiol. 2015;7(2):76–85. doi: 10.4330/wjc.v7.i2.76. [DOI] [PMC free article] [PubMed] [Google Scholar]
- 48.Miller BR, 3rd, McGee TD, Jr, Swails JM, Homeyer N, Gohlke H, Roitberg AE. MMPBSA.py: an efficient program for end-state free energy calculations. J Chem Theory Comput. 2012;8(9):3314–3321. doi: 10.1021/ct300418h. [DOI] [PubMed] [Google Scholar]
- 49.Onufriev A, Bashford D, Case DA. Modification of the generalized Born model suitable for macromolecules. J Phys Chem B. 2000;104(15):3712–3720. [Google Scholar]
- 50.Lovell SC, Davis IW, Arendall WB, 3rd, et al. Structure validation by Cα geometry: φ, ψ and Cβ deviation. Proteins. 2003;50(3):437–450. doi: 10.1002/prot.10286. [DOI] [PubMed] [Google Scholar]
- 51.Kulleperuma K, Smith SM, Morgan D, et al. Construction and validation of a homology model of the human voltage-gated proton channel hHV1. J Gen Physiol. 2013;141(4):445–465. doi: 10.1085/jgp.201210856. [DOI] [PMC free article] [PubMed] [Google Scholar]
- 52.Dudev T, Lim C. Ion selectivity strategies of sodium channel selectivity filters. Acc Chem Res. 2014;47(12):3580–3587. doi: 10.1021/ar5002878. [DOI] [PubMed] [Google Scholar]
- 53.Catterall WA, Swanson TM. Structural basis for pharmacology of voltage-gated sodium and calcium channels. Mol Pharmacol. 2015;88(1):141–150. doi: 10.1124/mol.114.097659. [DOI] [PMC free article] [PubMed] [Google Scholar]
- 54.Xia M, Liu H, Li Y, Yan N, Gong H. The mechanism of Na+/K+ selectivity in mammalian voltage-gated sodium channels based on molecular dynamics simulation. Biophys J. 2013;104(11):2401–2409. doi: 10.1016/j.bpj.2013.04.035. [DOI] [PMC free article] [PubMed] [Google Scholar]
- 55.McNulty MM, Edgerton GB, Shah RD, Hanck DA, Fozzard HA, Lipkind GM. Charge at the lidocaine binding site residue Phe-1759 affects permeation in human cardiac voltage-gated sodium channels. J Physiol. 2007;581(Pt 2):741–755. doi: 10.1113/jphysiol.2007.130161. [DOI] [PMC free article] [PubMed] [Google Scholar]
- 56.Lipkind GM, Fozzard HA. Voltage-gated Na channel selectivity: the role of the conserved domain III lysine residue. J Gen Physiol. 2008;131(6):523–529. doi: 10.1085/jgp.200809991. [DOI] [PMC free article] [PubMed] [Google Scholar]
- 57.Hilber K, Sandtner W, Zarrabi T, et al. Selectivity filter residues contribute unequally to pore stabilization in voltage-gated sodium channels. Biochemistry. 2005;44(42):13874–13882. doi: 10.1021/bi0511944. [DOI] [PubMed] [Google Scholar]
- 58.Chakrabarti N, Ing C, Payandeh J, Zheng N, Catterall WA, Pomès R. Catalysis of Na+ permeation in the bacterial sodium channel Na(V)Ab. Proc Natl Acad Sci U S A. 2013;110(28):11331–11336. doi: 10.1073/pnas.1309452110. [DOI] [PMC free article] [PubMed] [Google Scholar]
- 59.Naylor CE, Bagnéris C, DeCaen PG, et al. Molecular basis of ion permeability in a voltage-gated sodium channel. EMBO J. 2016;35(8):820–830. doi: 10.15252/embj.201593285. [DOI] [PMC free article] [PubMed] [Google Scholar]
- 60.Penny CJ, Rahman T, Sula A, Miles AJ, Wallace BA, Patel S. Isolated pores dissected from human two-pore channel 2 are functional. Sci Rep. 2016;6:38426. doi: 10.1038/srep38426. [DOI] [PMC free article] [PubMed] [Google Scholar]
- 61.Zhang X, Xia M, Li Y, et al. Analysis of the selectivity filter of the voltage-gated sodium channel Na(v)Rh. Cell Res. 2013;23(3):409–422. doi: 10.1038/cr.2012.173. [DOI] [PMC free article] [PubMed] [Google Scholar]
- 62.Li Y, Liu H, Xia M, Gong H. Lysine and the Na+/K+ selectivity in mammalian voltage-gated sodium channels. PLoS One. 2016;11(9):e0162413. doi: 10.1371/journal.pone.0162413. [DOI] [PMC free article] [PubMed] [Google Scholar]
- 63.Sun YM, Favre I, Schild L, Moczydlowski E. On the structural basis for size-selective permeation of organic cations through the voltage-gated sodium channel. Effect of alanine mutations at the DEKA locus on selectivity, inhibition by Ca2+ and H+, and molecular sieving. J Gen Physiol. 1997;110(6):693–715. doi: 10.1085/jgp.110.6.693. [DOI] [PMC free article] [PubMed] [Google Scholar]
- 64.Varma S, Sabo D, Rempe SB. K+/Na+ selectivity in K channels and valinomycin: over-coordination versus cavity-size constraints. J Mol Biol. 2008;376(1):13–22. doi: 10.1016/j.jmb.2007.11.059. [DOI] [PMC free article] [PubMed] [Google Scholar]
- 65.Köpfer DA, Song C, Gruene T, Sheldrick GM, Zachariae U, de Groot BL. Ion permeation in K+ channels occurs by direct Coulomb knock-on. Science. 2014;346(6207):352–355. doi: 10.1126/science.1254840. [DOI] [PubMed] [Google Scholar]
- 66.Csányi E, Boda D, Gillespie D, Kristóf T. Current and selectivity in a model sodium channel under physiological conditions: dynamic Monte Carlo simulations. Biochim Biophys Acta. 2012;1818(3):592–600. doi: 10.1016/j.bbamem.2011.10.029. [DOI] [PMC free article] [PubMed] [Google Scholar]
- 67.Nimigean CM, Allen TW. Origins of ion selectivity in potassium channels from the perspective of channel block. J Gen Physiol. 2011;137(5):405–413. doi: 10.1085/jgp.201010551. [DOI] [PMC free article] [PubMed] [Google Scholar]
- 68.Gong X, Li J, Xu K, Wang J, Yang H. A controllable molecular sieve for Na+ and K+ ions. J Am Chem Soc. 2010;132(6):1873–1877. doi: 10.1021/ja905753p. [DOI] [PubMed] [Google Scholar]
- 69.Hille B. The hydration of sodium ions crossing the nerve membrane. Proc Natl Acad Sci U S A. 1971;68(2):280–282. doi: 10.1073/pnas.68.2.280. [DOI] [PMC free article] [PubMed] [Google Scholar]
- 70.Bernardi RC, Melo MCR, Schulten K. Enhanced sampling techniques in molecular dynamics simulations of biological systems. Biochim Biophys Acta. 2015;1850(5):872–877. doi: 10.1016/j.bbagen.2014.10.019. [DOI] [PMC free article] [PubMed] [Google Scholar]
- 71.Kalyaanamoorthy S, Chen YP. Modelling and enhanced molecular dynamics to steer structure-based drug discovery. Prog Biophys Mol Biol. 2014;114(3):123–136. doi: 10.1016/j.pbiomolbio.2013.06.004. [DOI] [PubMed] [Google Scholar]
- 72.Chan KW, Tabuena D, Xie C, Shryock J, Belardinelli L, Smith-Maxwell C. Contribution of local anesthetic binding site residues F1760 and Y1767 to block of the cardiac Na+ channel, hNaV1.5, by ranolazine. Biophys J. 2012;102(3):324a. [Google Scholar]
- 73.Beyder A, Strege PR, Reyes S, et al. Ranolazine decreases mechano-sensitivity of the voltage-gated sodium ion channel Na(v)1.5: a novel mechanism of drug action. Circulation. 2012;125(22):2698–2706. doi: 10.1161/CIRCULATIONAHA.112.094714. [DOI] [PMC free article] [PubMed] [Google Scholar]
- 74.Wang DW, Mistry AM, Kahlig KM, Kearney JA, Xiang J, George AL., Jr Propranolol blocks cardiac and neuronal voltage-gated sodium channels. Front Pharmacol. 2010;1:144. doi: 10.3389/fphar.2010.00144. [DOI] [PMC free article] [PubMed] [Google Scholar]
- 75.Carboni M, Zhang ZS, Neplioueva V, Starmer CF, Grant AO. Slow sodium channel inactivation and use-dependent block modulated by the same domain IV S6 residue. J Membr Biol. 2005;207(2):107–117. doi: 10.1007/s00232-005-0805-0. [DOI] [PubMed] [Google Scholar]
- 76.Shao J, Tanner SW, Thompson N, Cheatham TE. Clustering molecular dynamics trajectories: 1. Characterizing the performance of different clustering algorithms. J Chem Theory Comput. 2007;3(6):2312–2334. doi: 10.1021/ct700119m. [DOI] [PubMed] [Google Scholar]
- 77.Antzelevitch C, Belardinelli L, Zygmunt AC, et al. Electrophysiological effects of ranolazine, a novel antianginal agent with antiarrhythmic properties. Circulation. 2004;110(8):904–910. doi: 10.1161/01.CIR.0000139333.83620.5D. [DOI] [PMC free article] [PubMed] [Google Scholar]
- 78.Plouvier B, Beatch GN, Jung GL, et al. Synthesis and biological studies of novel 2-aminoalkylethers as potential antiarrhythmic agents for the conversion of atrial fibrillation. J Med Chem. 2007;50(12):2818–2841. doi: 10.1021/jm0604528. [DOI] [PubMed] [Google Scholar]
- 79.Ramos E, O’Leary ME. State-dependent trapping of flecainide in the cardiac sodium channel. J Physiol. 2004;560(Pt 1):37–49. doi: 10.1113/jphysiol.2004.065003. [DOI] [PMC free article] [PubMed] [Google Scholar]
- 80.Chakka N, Bregman H, Du B, et al. Discovery and hit-to-lead optimization of pyrrolopyrimidines as potent, state-dependent Na(v)1.7 antagonists. Bioorg Med Chem Lett. 2012;22(5):2052–2062. doi: 10.1016/j.bmcl.2012.01.015. [DOI] [PubMed] [Google Scholar]
- 81.Fredj S, Sampson KJ, Liu H, Kass RS. Molecular basis of ranolazine block of LQT-3 mutant sodium channels: evidence for site of action. Br J Pharmacol. 2006;148(1):16–24. doi: 10.1038/sj.bjp.0706709. [DOI] [PMC free article] [PubMed] [Google Scholar]
- 82.Hanck DA, Nikitina E, McNulty MM, Fozzard HA, Lipkind GM, Sheets MF. Using lidocaine and benzocaine to link sodium channel molecular conformations to state-dependent antiarrhythmic drug affinity. Circ Res. 2009;105(5):492–499. doi: 10.1161/CIRCRESAHA.109.198572. [DOI] [PMC free article] [PubMed] [Google Scholar]
- 83.Sheets MF, Fozzard HA, Lipkind GM, Hanck DA. Sodium channel molecular conformations and antiarrhythmic drug affinity. Trends Cardiovasc Med. 2010;20(1):16–21. doi: 10.1016/j.tcm.2010.03.002. [DOI] [PMC free article] [PubMed] [Google Scholar]
- 84.Fozzard HA, Sheets MF, Hanck DA. The sodium channel as a target for local anesthetic drugs. Front Pharmacol. 2011;2:68. doi: 10.3389/fphar.2011.00068. [DOI] [PMC free article] [PubMed] [Google Scholar]
- 85.Martin LJ, Corry B. Locating the route of entry and binding sites of benzocaine and phenytoin in a bacterial voltage gated sodium channel. PLoS Comput Biol. 2014;10(7):e1003688. doi: 10.1371/journal.pcbi.1003688. [DOI] [PMC free article] [PubMed] [Google Scholar]
- 86.Boiteux C, Vorobyov I, French RJ, French C, Yarov-Yarovoy V, Allen TW. Local anesthetic and antiepileptic drug access and binding to a bacterial voltage-gated sodium channel. Proc Natl Acad Sci U S A. 2014;111(36):13057–13062. doi: 10.1073/pnas.1408710111. [DOI] [PMC free article] [PubMed] [Google Scholar]


