
Figure 2. TERRA depletion results in dysregulation of gene expression at target sites.
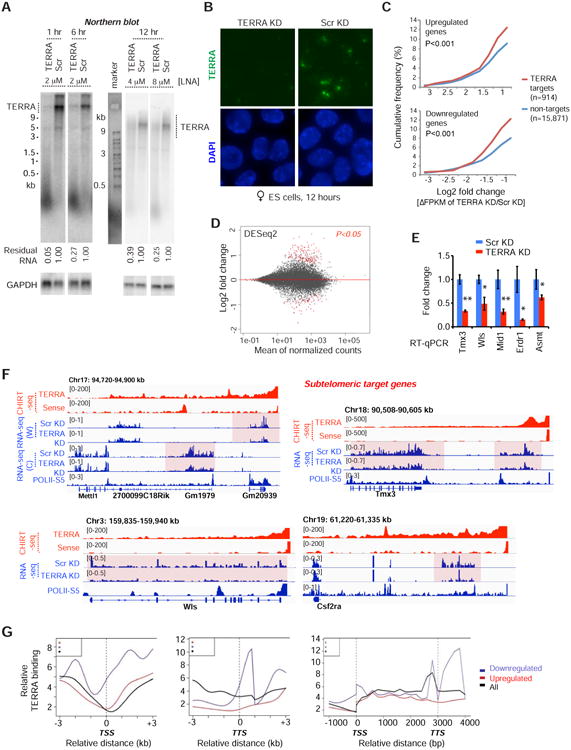
A. Northern blot analysis of TERRA RNA shows depletion by treatment with gapmer LNA at indicated time points and LNA concentrations in ES cells. Scr, scramble LNA control. GAPDH RNA is used as loading control and % remaining TERRA RNA is indicated.
B. RNA FISH confirming TERRA depletion after 12 hours of LNA treatment. Photos taken with the same exposure.
C. Cumulative frequency plots for up- and down-regulated genes, showing Log2 fold-changes (ΔFPKM) after TERRA KD for the 914 genes with or 15,871 genes without TERRA sites. P-values determined by 2-tailed Chi-square test with Yate's correction.
D. MA Bland–Altman plot to visualize RNA-seq data transformed onto the M (log2 fold-change) and A (mean average) scale. Log2 fold change represents TERRA KD vs Scr KD. Red dots, genes with significant change (P-adjust<0.05) using DESeq2 analysis.
E. RT-qPCR of sub-telomeric genes following TERRA KD. P-values (** <0.01; * <0.05) determined by the Student t-test. Error bars, S.D.
F. RNA-seq analysis. Examples of downregulated subtelomeric genes following TERRA KD. All CHIRT data are normalized to input. For all RNA-seq tracks, only the relevant strand is shown, with exception of Chr17 subtelomeric end where both are shown: W, Watson strand; C, Crick strand. RNA-seq coverage was normalized to total mapped fragments.
G. Average metasite (left, middle) and metagene (right) profiles for TERRA binding relative to the TSS, TTS, and gene body. Profiles shown for downregulated (blue), upregulated (red), and all (black) genes in TERRA KD.