
Figure 4. TERRA and ATRX target a common set of genes and are functionally antagonistic.
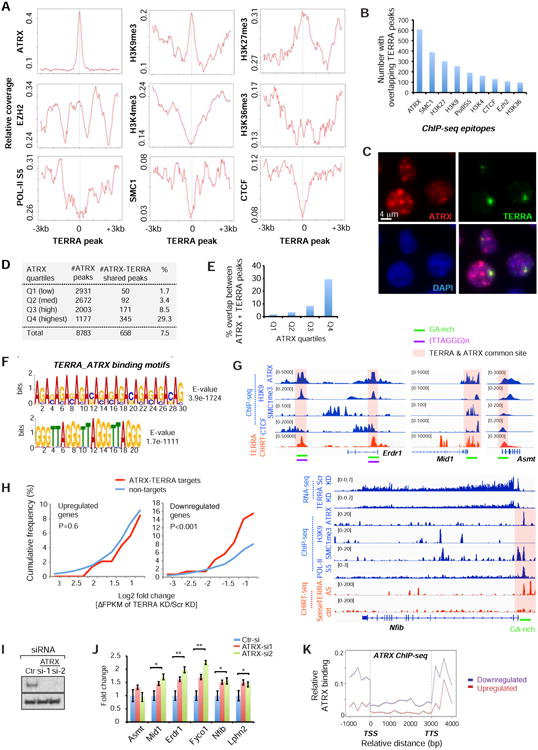
A. Metasite analysis: ChIP-seq coverage of indicated epitopes (y-axis) relative to the averaged genomic TERRA-binding site (x=0).
B. Number of ChIP-seq enriched regions (of indicated epitopes) with an overlapping TERRA peak.
C. Immuno-RNA FISH performed with anti-ATRX antibodies (red) and TERRA-specific probes (green) reveals colocalization of TERRA with a subset of ATRX domains.
D. ATRX chromatin targets in ES cells (ChIP-seq) are divided into four quartiles on the basis of coverage densities (Q4 highest). The number of ATRX peaks and those shared with TERRA are shown, along with the % ATRX peaks shared with TERRA peaks.
E. Percentage of ATRX peaks shared with TERRA is shown for each ATRX quartile.
F. De novo motif analysis using MEME reveals two dominant motifs for TERRA-ATRX target sites. E-values indicate how well each occurrence matches motif.
G. Genome browser shots of TERRA CHIRT-seq and ChIP-seq data for TERRA-ATRX target genes. RNA-seq shows downregulation of Nfib after TERRA depletion.
H. TERRA depletion decreases expression of ATRX-TERRA target genes. Cumulative frequency plots of Log2 fold-changes (ΔFPKM) for upregulated (Log2>0.75) and downregulated (Log2<- 0.75) genes after TERRA KD. Profiles for shared ATRX-TERRA targets versus non-targets are graphed. P-values determined by two-tailed Chi-squared test.
I. Western analysis of ATRX protein after ATRX knockdown (KD) by two gene-specific siRNAs. No protein is detectable after KD.
J. ATRX depletion increases expression of ATRX-TERRA target genes. RT-qPCR assay shows fold changes in expression of indicated genes in ES cells after 48 h. ATRX siRNA knockdown. Results from several biological replicates. **, P<0.01; *, P<0.05 two-tailed student t-test. Error bars, S.D.
K. Metagene analysis of ATRX binding. Profiles for genes that are upregulated (red) or downregulated (blue) after TERRA depletion are graphed separately.