

Summary
Genetic modification of plant cell walls has been posed to reduce lignocellulose recalcitrance for enhancing biomass saccharification. Since cellulose synthase (CESA) gene was first identified, several dozen CESA mutants have been reported, but almost all mutants exhibit the defective phenotypes in plant growth and development. In this study, the rice (Oryza sativa) Osfc16 mutant with substitutions (W481C, P482S) at P‐CR conserved site in CESA9 shows a slightly affected plant growth and higher biomass yield by 25%–41% compared with wild type (Nipponbare, a japonica variety). Chemical and ultrastructural analyses indicate that Osfc16 has a significantly reduced cellulose crystallinity (CrI) and thinner secondary cell walls compared with wild type. CESA co‐IP detection, together with implementations of a proteasome inhibitor (MG132) and two distinct cellulose inhibitors (Calcofluor, CGA), shows that CESA9 mutation could affect integrity of CESA4/7/9 complexes, which may lead to rapid CESA proteasome degradation for low‐DP cellulose biosynthesis. These may reduce cellulose CrI, which improves plant lodging resistance, a major and integrated agronomic trait on plant growth and grain production, and enhances biomass enzymatic saccharification by up to 2.3‐fold and ethanol productivity by 34%–42%. This study has for the first time reported a direct modification for the low‐DP cellulose production that has broad applications in biomass industries.
Keywords: biomass saccharification, cellulose, CESA, lodging resistance, rice
Introduction
Cellulose is the most abundant biomass convertible for biofuels and chemical products. As a principal component of plant cell walls, cellulose plays a central role in plant mechanical strength and morphogenesis (Somerville, 2006), but its features determine lignocellulose recalcitrance, leading to a costly biomass process (Himmel et al., 2007; Pauly and Keegstra, 2008). To reduce recalcitrance, genetic modifications of wall polymers (hemicelluloses and lignin) have been applied to enhance biomass saccharification (Bonawitz et al., 2014; Chen and Dixon, 2007; Chiniquy et al., 2012; Ding et al., 2012; Li et al., 2015; Wilkerson et al., 2014), but little has been reported about a direct alteration of cellulose in plants (Burton and Fincher, 2014).
Cellulose consists of β‐1,4‐linked glucan chains that form microfibrils by intra‐ and intermolecular hydrogen bonds. The formed hydrogen bonds significantly determine cellulose crystallinity, which is reportedly a key parameter negatively affecting biomass digestibility (Harris et al., 2012; Li et al., 2013; Zhang et al., 2013). The crystallinity index (CrI) has been broadly used to account for cellulose crystallinity and could be detected by X‐ray diffraction (XRD) patterns (Segal et al., 1959). Besides cellulose crystallinity, the degree of polymerization (DP) of crystalline cellulose is also regarded as an important cellulose feature (Zhang et al., 2013). Recent reports have indicated that cellulose CrI is positively correlated with its DP in Miscanthus samples (Zhang et al., 2013), and both cellulose features (CrI, DP) are the main factors that could negatively affect either plant lodging resistance or biomass enzymatic saccharification in plants (Li et al., 2015; Zhang et al., 2013). However, it remains largely unknown how cellulose biosynthesis process determines the cellulose features in plants.
In higher plants, cellulose is synthesized at the plasma membrane by cellulose synthase (CESA) enzymes that are organized into cellulose synthase complexes (CSCs) (Taylor et al., 2003). Since the first higher plant cellulose synthase gene was cloned from cotton in 1996 (Pear et al., 1996), the CESA superfamily has been characterized with eight transmembrane domains and a central cytoplasmic domain with D,D,D,QXXRW motif. The central cytoplasmic domain contains the plant‐conserved region (P‐CR) and class‐specific region (CSR), which may play a role in CESA protein association and assembly (Olek et al., 2014; Sethaphong et al., 2013). To dissect CESA biological functions, more than fifty distinct CESA mutants have been identified in different plant species through multiple genetic approaches (Table (Figure S1). Nevertheless, almost all mutants exhibit markedly reduced cellulose and defective growth phenotypes, and several mutants are examined with low cellulose crystallinity for high biomass enzymatic digestibility (Table (Figure S1). To our knowledge, however, little is yet reported about cellulose DP alteration from the mutants. Furthermore, the homologous and heterologous overexpression of CESA genes could not enhance cellulose products but did affect plant growth in transgenic plants (Table (Figure S1). Exceptionally, the recent rice bc13 mutant with one amino acid alteration in CESA9 showed normal plant growth and cadmium tolerance, despite a reduction in cellulose (Song et al., 2013).
Rice is a major food crop over the world with enormous biomass residues for biofuels and chemical products. In this study, we identified a novel rice CESA9 allele Osfc16 that showed a normal plant growth and high biomass production. Mutation of the CESA9 protein reduced two cellulose features (CrI, DP), leading to improved plant lodging resistance and enhanced biomass enzymatic saccharification. Further analysis revealed that the P‐CR region mutation of CESA9 protein could affect stability of secondary wall CSCs, which may early terminate the CSC track in the plasma membrane resulting in low‐DP cellulose synthesis.
Results
CESA9 conserved‐site mutation and improved agronomic traits in Osfc16
Using map‐based cloning approach, the rice Osfc16 mutant was identified as a single recessive gene, which encodes the CESA9 protein with two amino acid substitutions ( W 481 P 482 GN→ C 481 S 482 GN) in the site of P‐CR region (Figure 1a). In particular, the substituted amino acids (Trp and Pro) are fully conserved in all CESA family proteins of the eight plant species examined (Figure S1). Although several dozens of CESA mutants and overexpressed transgenic plants have been previously identified with remarkably defective phenotypes in different plant species (Table (Figure S1), the Osfc16 mutant exhibited a normal plant growth as observed in wild type (Nipponbare (NPB), a japonica variety) (Figure 1b). In 3‐year (2012–2014) independent field experiments, the Osfc16 mutant maintained grain yields (dry spike) similar to wild type (Figure 1c and Table (Figure S2). Notably, despite the relatively short height (Figure 1d), the Osfc16 mutant had significantly improved plant lodging resistance (lodging index reduced by 18%–24%) and enhanced biomass production (dry straw increased by 25%–41%), compared with wild type (Figure 1e,f and Table S2). In particular, tillers numbers (tillers/plant) were much increased in the Osfc16 mutant by 59%–68%, attributing for its higher biomass production (Table S2).
Figure 1.
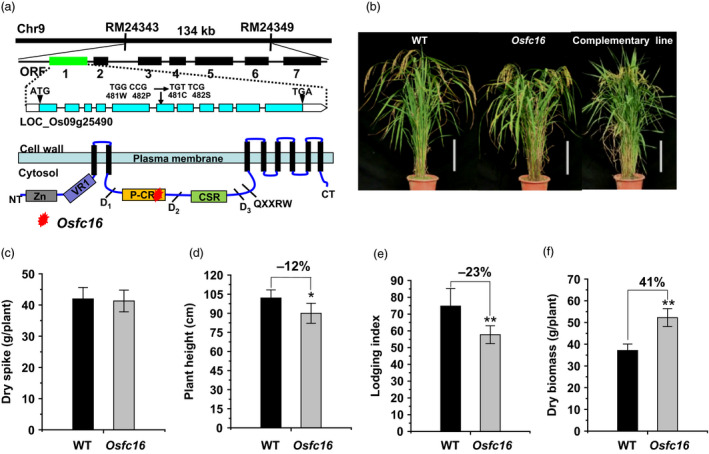
Osfc16 mutant identification and agronomic trait observation. (a) Location of Osfc16 mutation with substitutions of Trp and Pro residues with Cys and Ser at the 481 and 482 position of the CESA9 protein. (b) Plant growth in wild‐type (WT), Osfc16 mutant and complementary line (scale bar = 20 cm). (c) Dry spike. (d) Plant height. (e) Lodging index. (f) Dry biomass. * and ** indicate significant differences between WT and Osfc16 mutant by t‐test at P < 0.05 and 0.01, respectively, with the increased or decreased percentage (%) calculated by subtraction of the values between mutant and WT divided by WT. The error bar indicates SD values (n = 3).
To verify the Osfc16 mutation as the single recessive gene, the full‐length cDNA of CESA9 gene was expressed in the Osfc16 mutant. As a result, the Osfc16 mutant phenotype was fully complemented (Figure 1b), and the related major agronomic traits (lodging index and dry straw) were restored in three independent complementary transgenic lines at significant levels (Table S3).
Enhanced biomass saccharification and ethanol production in Osfc16
Using mature stem materials, we detected biomass enzymatic digestibility (saccharification) in the Osfc16 mutant by calculating the hexose yields released from enzymatic hydrolysis of pretreated biomass (Figure 2a). The Osfc16 mutant exhibited higher yields of hexoses by up to 2.3‐fold than that of wild type, under pretreatments with three concentrations of alkali (0.5%, 1% and 4% NaOH) and acid (0.5%, 1% and 2% H2SO4) or upon enzymatic hydrolysis with three dosages of cellulase (3.5, 7 and 14 FPU/g cellulose) (Figure 2b,c; Figure (Figure S2; Table S4). Such large enhancements were confirmed by visualizations of more violent destruction of stem tissue in situ (Figure 2e) and of rougher biomass residue surfaces in vitro (Figure 2f) in the Osfc16 mutant from 1% NaOH and 1% H2SO4 pretreatments and sequential enzymatic hydrolyses. Furthermore, the Osfc16 mutant, compared with wild type, exhibited higher ethanol yields by 34%–42% obtained by yeast fermentation of the sugars released from biomass enzymatic hydrolysis of rice straw upon the mild chemical (7.5% CaO, 1% H2SO4) pretreatments (Figure 2d; Table S5). This study demonstrated that the CESA9 site mutation could lead to largely enhanced biomass saccharification and ethanol productivity in the Osfc16 mutant.
Figure 2.
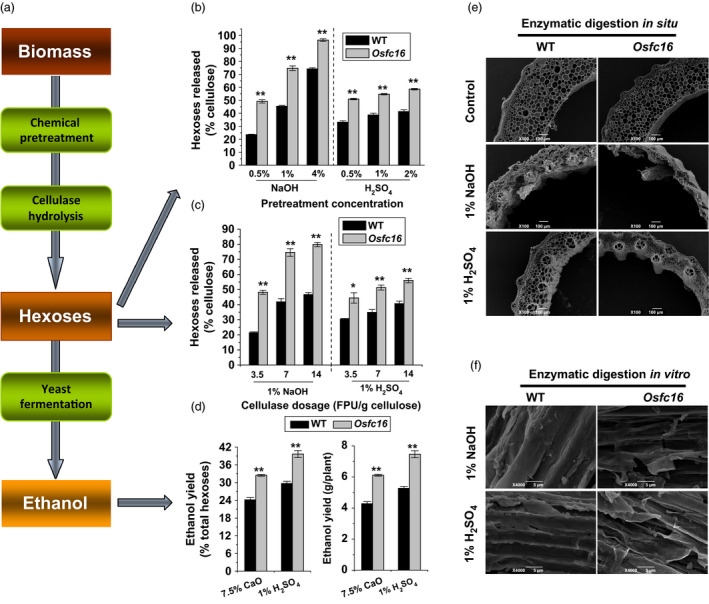
Biomass enzymatic saccharification and ethanol production. (a) Scheme for biomass enzymatic saccharification and ethanol yield. (b) Hexose yields released from enzymatic (mixed‐cellulase) hydrolysis after pretreatment with NaOH and H2 SO 4 at three concentrations. (c) Hexose yields released from three dosages of mixed‐cellulase hydrolysis after pretreatment with 1% NaOH and 1% H2 SO 4. (d) Ethanol yield obtained by yeast fermentation of the sugars from biomass enzymatic hydrolysis of the mature stems after pretreatment with 7.5% CaO or 1% H2 SO 4. Ethanol yield was expressed as either percentage of total hexoses in the biomass residues or ethanol yield per plant. (e) SEM images of in situ enzymatic digestion of stems at heading stage after 1% NaOH or 1% H2 SO 4 pretreatment and sequential enzymatic hydrolysis. (f) SEM images of in vitro enzymatic digestion of biomass residues released from enzymatic hydrolysis after 1% NaOH or 1% H2 SO 4 pretreatment. * and ** indicate significant differences between WT and Osfc16 mutant by t‐test at P < 0.05 and 0.01, respectively, and the error bar indicates SD values (n = 3).
Altered cell wall composition and structure in Osfc16
To understand the improved agronomic traits and enhanced biomass digestibility in Osfc16 mutant, we examined its cell wall composition and structure. Besides relatively smaller‐diameter stems (Figure 3a), the Osfc16 mutant showed thinner secondary cell walls than wild type (Figure 3b). Chemical analysis indicated that the Osfc16 mutant had reduced cellulose levels by 18% and increased hemicellulose levels by 16% with lignin level similar to wild type in the mature stems (Figure 3c). Furthermore, the Osfc16 mutant did not show much difference from wild type in monosaccharide composition of hemicelluloses and three monomer constituents (G, S and H) of lignin (data not shown). In addition, the cell wall composition of Osfc16 mutant could be fully restored in three independent complementary transgenic lines.
Figure 3.
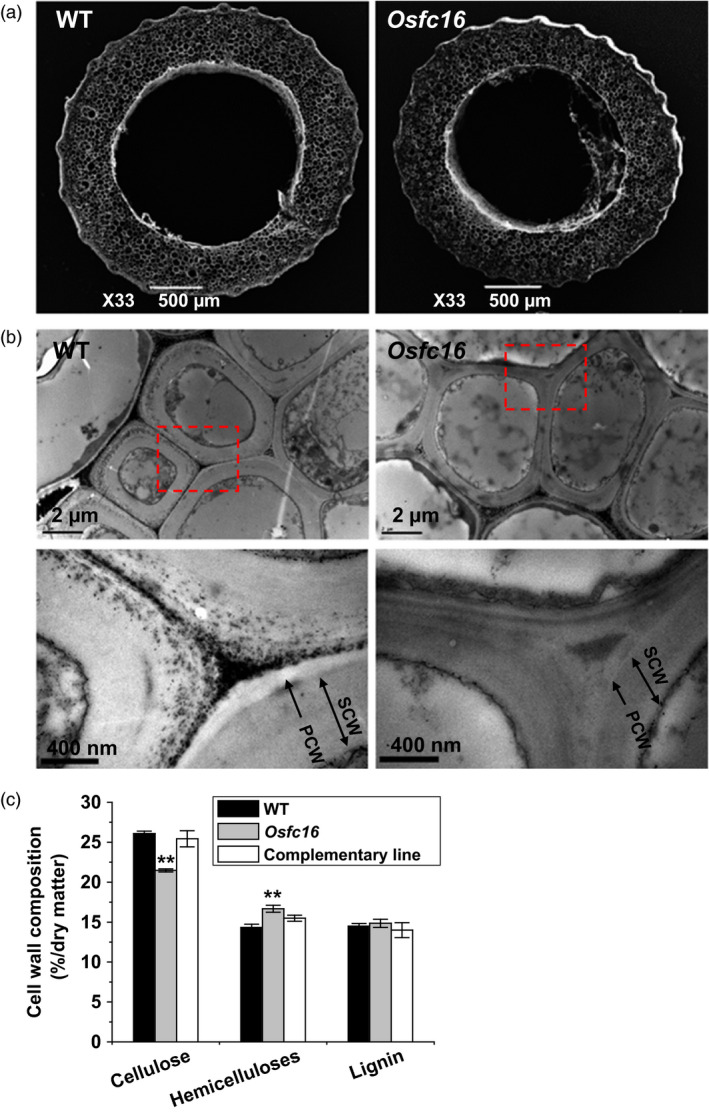
Observations of stem tissues and cell wall structures. (a) SEM images of the second‐internode stem at the heading stage of rice. (b) TEM images of the sclerenchyma cell walls. PCW: primary cell wall. SCW: secondary cell wall. (c) Cell wall composition of mature stems. ** indicates significant differences between WT and Osfc16 or complementary line by t‐test at P < 0.01, and the error bar indicates SD values (n = 3).
Reduced cellulose crystallinity in Osfc16
As a major cellulose feature, cellulose crystallinity has been characterized by determining crystalline index (CrI) of biomass samples (Li et al., 2015; Xu et al., 2012; Zhang et al., 2013). Using four internodes of stems at heading stage of rice (Figure 4a), a standard development from primary to secondary cell walls (Xie et al., 2013), the Osfc16 mutant exhibited a significant reduction of the cellulose CrI in the second, third and fourth internodes by 3.9%, 7.8% and 23.4%, respectively, compared with wild type (Figure 4b). Notably, the Osfc16 mutant had much lower CrI value than wild type by 36% in the mature stem that is rich in secondary cell walls (Figure 4b,c). Because slight different CrI values were detected between Osfc16 and wild type in the second‐internode stems that are predominately composed of primary cell walls, the data thus indicated that a major reduction of cellulose CrI occurred in the secondary cell walls of Osfc16 mutant, consistent with its thinner secondary cell walls.
Figure 4.
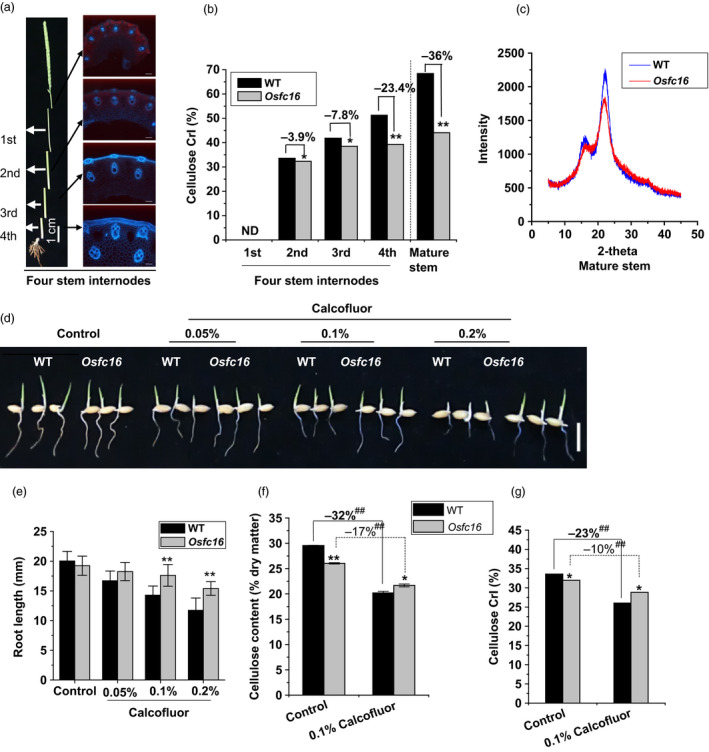
Detection of cellulose crystallinity. (a) Four‐internode stems at heading stage used for CrI and DP detection. (b) Cellulose CrI of the four internodes and mature stems using the X‐ray diffraction (XRD) method. (c) The XRD scanning patters applied for CrI calculation. (d, e) Root lengths of the germinated seedlings treated with Calcofluor for 48 h. (f, g) Cellulose content and CrI in roots of the seedlings treated with 0.1% Calcofluor for 48 h. * and ** indicate significant differences between WT and Osfc16 by t‐test at P < 0.05 and 0.01, respectively, with the increased or decreased percentage (%) calculated by subtraction of the values between mutant and WT divided by WT. The error bar indicates SD values. ## indicates significant differences between the Calcofluor treatment and control by t‐test at P < 0.01, with the increased or decreased percentage (%) calculated by subtraction of the values between the Calcofluor and control divided by control.
To further confirm the reduction of cellulose CrI in Osfc16 mutant, we applied two distinct cellulose inhibitors (Calcofluor, CGA325′615‐CGA) to treat with rice seedlings. While the germinated rice seeds were incubated with Calcofluor, an inhibitor of cellulose crystallization (Haigler et al., 1980), the Osfc16 mutant showed less retarded root growth than did the wild type (Figure 4d,e and Table S6). As Calcofluor influences microfibril crystallization by competing for hydrogen binding sites that form the crystalline lattice (Haigler et al., 1980), the Osfc16 mutant, which is rich in low‐CrI cellulose, should have less binding capability with Calcofluor, ultimately leading to less inhibited plant growth and relatively higher cellulose level and CrI value, compared with wild type (Figure 4f,g). Furthermore, while treated with CGA, the Osfc16 mutant also showed much less retarded root growth and reduced cellulose level, compared with wild type (Figure 5a–c and Table S6). Notably, the Osfc16 mutant treated with CGA had a significantly higher CrI value than wild type (Figure 5d), a similar phenomenon observed in the Calcofluor treatment (Figure 4g). Because CGA is presumed to affect CESA complex association on the plasma membrane (Crowell et al., 2009; Kurek et al., 2002; Peng et al., 2001, 2002), the wild type may be much more affected by CGA to produce low‐CrI cellulose (Figure 5d), whereas the Osfc16 mutant was less sensitive to CGA, probably due to its unstable CESA complexes as described below. Hence, in terms of its low sensitivity to two distinct cellulose inhibitors, the Osfc16 mutant had much less reduction of cellulose CrI by 10% and 7% relative to the control, whereas the wild type showed the reduced CrI by 23% and 33% (Table S6), which on the contrary confirmed that the Osfc16 mutant had a significantly reduced cellulose crystallinity.
Figure 5.
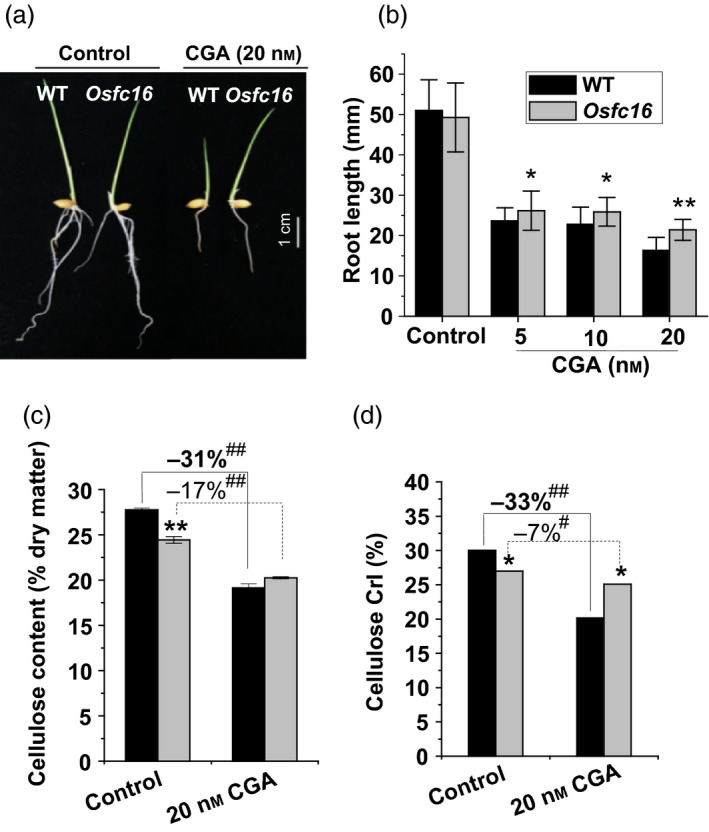
CGA effects on plant growth and cellulose crystallinity. (a, b) Root lengths of the germinated seeds treated with CGA for 72 h. (c, d) Cellulose content and CrI in roots of the seedlings treated with 20 nM CGA for 72 h. * and ** indicate significant differences between WT and Osfc16 mutant by t‐test at P < 0.05 and 0.01, respectively, and the error bar indicates SD (n = 3). # and ## indicate significant differences between the CGA treatment and control by t‐test at P < 0.05 and 0.01, respectively, with the increased or decreased percentage (%) calculated by subtraction of the values between CGA and control divided by control.
Reduced cellulose DP in Osfc16
As cellulose CrI is positively correlated with its DP (Zhang et al., 2013), it remains essential to examine cellulose DP in the Osfc16 mutant. In this study, we focused on detecting cellulose DP of stem and hull tissues in both Osfc16 mutant and wild type (Figure 6a), because both tissues are of predominately secondary cell walls containing extremely high cellulose and lignin for biomass application (Table S7). However, to distinguish cellulose DP in primary and secondary cell walls, we established a novel approach to extract intact cellulose samples by fully removing hemicelluloses and lignin with 4 M KOH and 8% NaClO2 under mild conditions and consequently gradated the purified cellulose into relatively low‐ and high‐DP cellulose fractions using ionic liquid (1‐butyl‐3‐methylimidazolium acetate) and DMSO chemicals (Figure 6b). Using the viscometry method, a classic assay for cellulose DP (Kumar et al., 2009; Li et al., 2014; Zhang et al., 2013), we examined that the Osfc16 mutant in the high‐DP cellulose fractions exhibited much lower cellulose DP values by 28%–30% than did the wild type in hull and stem tissues from two independent biological replicate experiments (Figure 6c and Table S8). By contrast, much different DP values were not determined between wild type and mutant in the low‐DP fractions (Figure 6d). These findings were confirmed by atomic force microscopy (AFM) observations in which the Osfc16 mutant exhibited much smaller cellulose particles by 44%–57% than did wild types in the high‐DP fraction (Figure 6e,g). Because the high‐DP fractions cover 10%–40% of total cellulose in the hull and stem tissues (Table S8), their cellulose is thus derived from the secondary cell walls, whereas the low‐DP fractions should contain the cellulose from primary cell walls and partial secondary cell walls. Hence, the results indicated that the Osfc16 mutant could partially synthesize the low‐DP cellulose in the secondary cell walls of hull and stem tissues, compared with wild type. In addition, although relatively small particles were observed in the low‐DP fractions, the Osfc16 mutant had significantly smaller particles by 28% than did the wild type in the hull and in the stem (Figure 6f,h). It should explain that the hull contained much more cellulose from secondary cell walls than did the stem as described above (Table S7). Taken all together, the results demonstrated that the Osfc16 mutant could synthesize low‐DP cellulose in the secondary cell walls, which should lead to thinner secondary cell wall and reduced cellulose level and CrI relative to wild type.
Figure 6.
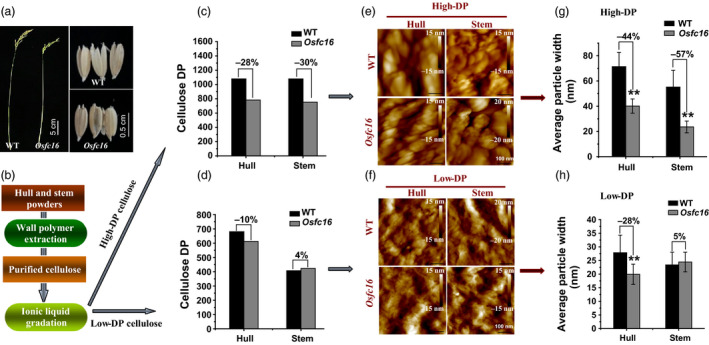
Measurements of cellulose DP in the gradated cellulose fractions of stem and hull tissues in wild type and Osfc16 mutant. (a, b) Mature stem and hull tissues collected for cellulose extraction and gradation into high‐ and low‐DP cellulose fractions. (c, d) Detection of cellulose DP in the high‐ and low‐DP fractions from one independent biological experiment (Table S8). (e, f) AFM observation of cellulose surfaces in the high‐ and low‐DP fractions. (g, h) Quantitative analysis of AFM imagine by randomly selecting ten dots in the high‐ and low‐DP factions. ** indicates significant differences between the WT and Osfc16 mutant by t‐test at P < 0.01, with the increased or decreased percentage (%) calculated by subtraction of the DP values between WT and mutant divided by WT.
Affected CESA4/7/9 complex association in Osfc16
Because the CESA4/7/9 are required to form a functional cellulose synthase complexes for secondary cell wall synthesis in rice (Huang et al., 2015; Liu et al., 2013; Tanaka et al., 2003; Wang et al., 2010), the three CESA proteins were detected by Western blot analysis of microsomal membrane extracts. Compared with wild type, the Osfc16 mutant showed much lower CESA9 protein levels by 71% as well as reduced CESA4 and CESA7 protein levels by 34% and 22%, respectively (Figure 7a). To sort out the CESA9 protein reduction in the mutant, we used MG132, a proteasome inhibitor (Smalle and Vierstra, 2004), to treat rice plants at tillering stage (Figure 7b). When treated with MG132, both Osfc16 and wild‐type plants exhibited higher CESA9 protein levels than did those treated only with DMSO (control), indicating that CESA9 is degraded in a proteasome‐dependent manner in plant cells. Notably, the Osfc16 mutant treated with MG132 had increased CESA9 protein biosynthesis rates by onefold compared with the control, whereas wild type only showed biosynthesis rate that increased by 15%, suggesting a rapid and massive proteasome degradation of the CESA9 protein in the Osfc16 mutant. Furthermore, we detected the levels of CESA9 in the CESA4/7/9 complexes pulled down by anti‐CESA4 and anti‐CESA7, respectively (Figure 7c,d). Although the levels of CESA4 and 7 proteins were reduced by 22% and 4%, the Osfc16 mutant showed much lower CESA9 protein levels by 49% and 29% than did the wild type, indicating that the Osfc16 mutant had reduced CESA9 in proportion to the CESA4/7/9 complexes. Therefore, the CESA9 conserved‐site mutation affects its association with the CESA complexes, leading to a rapid proteasome degradation. On the other hand, because CGA could affect CESA complex association, this result may also explain why the Osfc16 mutant was less sensitive to CGA treatment than was the wild type as described above.
Figure 7.
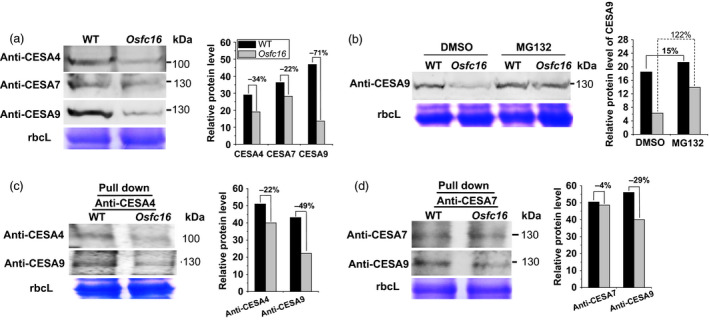
Western blot analysis of CESA proteins. (a) Detection of total CESA4, CESA7 and CESA9 proteins using microsomal membrane extracts of stems at heading stage. (b) CESA9 proteins in the stems treated with 150 μm MG132 and an equivalent dilution of DMSO (control) for 4 h. (c, d) CESA4, CESA7 and CESA9 proteins using co‐immunoprecipitation with anti‐CESA4 and anti‐CESA7. The decreased percentage (%) was calculated by subtraction of the relative protein levels between mutant and WT divided by WT.
Discussion
It has been defined that genetic modification of plant cell walls should not only enhance biomass enzymatic saccharification, but also have little effect on plant growth and development (Abramson et al., 2010). Although previous CESA mutation alleles exhibited enhanced biomass digestibility by reducing cellulose crystallinity, various defective plant growth phenotypes had been observed in almost all CESA mutants and CESA‐overexpressed transgenic plants (Table (Figure S1). Therefore, this study indicates a new genetic strategy on a direct cellulose modification by CESA mutation at plant fully conserved sites. As recent CRISPR/Cas9 technology is well developed (Doudna and Charpentier, 2014), it could be applied to generate a bunch of mutants from other conserved‐site mutations in three CESA4/7/9 isoforms, which may lead to finding out optimal mutants in rice and beyond. In addition, characterization of those generated mutants should further interpret why the CESA mutants with CESA9 conserved‐site mutations could maintain a normal plant growth and grain production in plants.
Notably, the Osfc16 mutant has exhibited much higher biomass production and plant lodging resistance than did the wild type. As the plant height is negatively correlated with tiller number in rice (Li et al., 2003; Zhao et al., 2014), the relatively thin stems and short height of Osfc16 mutant may cause its increased tiller number per plant for high biomass production. Plant lodging resistance is a major and integrated agronomic trait on plant growth and grain production (Li et al., 2015). In particular, rice lodging resistance is negatively affected with plant height and fresh weight (Crook and Ennos, 1994; Islam et al., 2007). Importantly, cellulose crystallinity has been recently demonstrated as the main factor negatively determining plant lodging resistance in rice (Li et al., 2015). Therefore, the Osfc16 mutant showing much higher lodging resistance should be due to reductions of related factors, such as shorter height, less fresh weight per tiller and lower cellulose CrI. In addition, it remains interesting to test whether the CESA conserved‐site mutation could enhance lodging resistance in other plants.
Cellulose CrI reflects the relative amount of crystalline material in cellulose, and highly crystalline cellulose is less accessible to cellulase attack than amorphous cellulose on biomass hydrolysis (Himmel et al., 2007). However, cellulose DP is another important factor on biomass digestibility, because decreasing cellulose DP could increase both number of β‐1,4‐glucan chain‐reducing ends and proportion of amorphous cellulose. In this study, it has been demonstrated that the OsCESA9 site mutation could much reduce cellulose DP and CrI for largely enhanced biomass enzymatic saccharification in the Osfc16 mutant, which is distinct from the lignin and hemicellulose modifications that increase biomass digestion by improving enzyme accessibility to the cellulose surface (Bonawitz et al., 2014; Chen and Dixon, 2007; Chiniquy et al., 2012; Ding et al., 2012; Li et al., 2015; Wilkerson et al., 2014). In addition, because hemicelluloses negatively affect cellulose crystallinity (Li et al., 2013; Xu et al., 2012), the relatively high level of hemicelluloses in the Osfc16 mutant (Figure 3c) should be an additional contributor to its biomass enzymatic saccharification.
Plant cellulose biosynthesis process principally involves in three major steps: β‐1,4‐glucan chain initiation, elongation and termination (Peng et al., 2002). Although CESA complexes are presumed to synthesize the β‐1,4‐glucan chains, little is yet known about the chain termination that determines cellulose DP. Hence, this study proposed a hypothetic model that the low‐DP cellulose synthesis in Osfc16 mutant should be due to the CESA9 site mutation that may reduce lifetime of CESA4/7/9 complexes towards a relatively early β‐1,4‐glucan chain termination (Figure 8). Here are four evidences: (i) CESA9 site mutation occurs in the P‐CR region that has been proposed to function in CESA protein association and assembly (Olek et al., 2014; Sethaphong et al., 2013); (ii) all three CESA4/7/9 proteins are reduced in the Osfc16 mutant from co‐immunoprecipitation assays; (iii) Osfc16 mutation mimics the CGA inhibition mode that could disassociate CESA complexes in plants; and (iv) Osfc16 mutation leads to a rapid proteasome degradation of CESA proteins. On the other hand, as the Cys and Ser substitution with Trp and Pro in the Osfc16 mutant may play a role in protein interaction and modification, it remains interesting to test whether both amino acids could affect CESA complex association by generating new mutants in the future.
Figure 8.
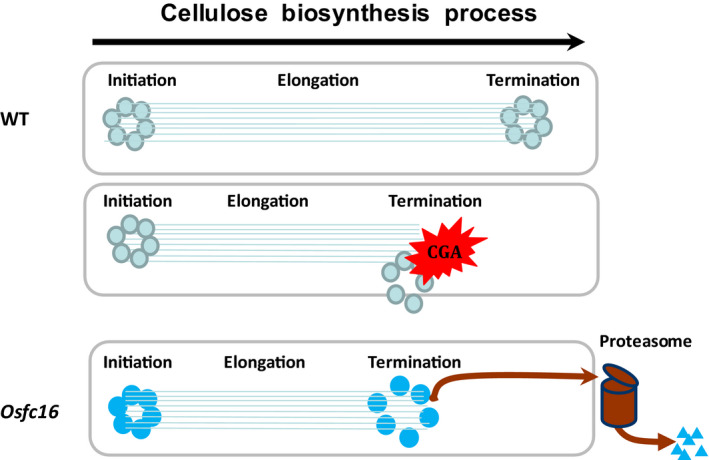
A hypothesis model on cellulose biosynthesis process involved in initiation, elongation and termination of β‐1,4‐glucan chains synthesized by CESA complexes on plasma membrane, which highlights that the CESA complexes in the Osfc16 mutant or in the WT treated with CGA may have a reduced lifetime, leading to relatively early termination of β‐1,4‐glucan chains for low‐DP cellulose biosynthesis.
In conclusion, the CESA9 conserved‐site mutation could affect its association with the CESA complexes towards a rapid proteasome degradation and cause the low‐DP cellulose synthesis for a reduced lignocellulose crystallinity, which largely enhances plant lodging resistance and biomass enzymatic saccharification in Osfc16 mutant. In addition, this study provides the perspective to find out the optimal mutants from other conserved‐site mutations in CESA4/7/9 using CRISPR/Cas9 technique. It also suggests a potential genetic manipulation on the genes that could lead to defective phenotypes from overexpression and knockout in plants.
Experimental procedures
Plant sample collections and physical character measurements
The homozygous Osfc16 mutant and wild‐type plants (japonica cultivar Nipponbare (NPB)) were respectively grown in the experimental fields of Huazhong Agricultural University, Wuhan, China, in 2012, 2013 and 2014. The collected mature stem tissues were dried at 55 °C, cut into small pieces, ground through 40‐mesh screen (0.425 × 0.425 mm) and stored in the dry container until use.
Rice dry spike and dry biomass were respectively weighed after the samples were dried in the oven at 60 °C. Plant lodging index was detected at six independent biological duplicates using the stem tissues at 30 days after flowering. The breaking resistance of the third internode was detected using a prostrate tester (DIK 7401, Japan), with the distance between fulcra of the tester at 5 cm. Fresh weight (W) of the upper portion of the plant was measured including panicle and the three internodes, leaf and leaf sheath. Bending moment (BM) and lodging index (LI) were calculated using the following formulae: BM = Length from the third internode to the top of panicle × W; and LI = BM/breaking resistance.
Genetic identification of Osfc16 mutant
The Osfc16 mutant was selected in 2008 from japonica variety Nipponbare T‐DNA mutagenesis pools. To identify the Osfc16 mutant, a F2 mapping population was generated from the crossing between Osfc16 mutant and SH838, an indica fertility‐restoring line in China. The segregation ratio in F2 population showed that the normal plants and brittle culm plants segregated as 3 : 1. Map‐based cloning approach was then used for gene identification of the Osfc16, based on ~5000 F2 mutant plants with SSR molecular markers. The Osfc16 gene was localized between RM24343 (forward primer: 5′‐AACTGCCACTGCCAATCATCG‐3′; and reverse primer: 5′‐CTCCAGCTCTCTCCACGACTCC‐3′) and RM24349 (forward primer: 5′‐GT ACTACTAGCTCGGCTGCTCTGC‐3′; and reverse primer: 5′‐GTAGTGGAGAGC GTGGACAGC‐3′) on chromosome 9 within a 134 kb in the rice genome (Figure 1a). The 134‐kb genomic region containing the CESA9 gene was amplified from the mutants and their corresponding wild‐type plants by PCR with KOD‐Plus (TOYOBO, Japan) and sequenced with a 3730 sequencer (ABI, Massachusetts, USA).
For genetic complementation of Osfc16 mutant, a 3401‐bp cDNA fragment containing the entire CESA9 coding region driven by the ubiquitin promoter was cloned into the binary vector pCAMBIA 3300 to generate the binary plasmid with forward primer 5′‐CTTCTAGACTCCTCTCCTCCTTCCTGCGTC‐3′ and reverse primer 5′‐TTCCTGCAGGGCCATCTGTCCATTCCCTCTTC‐3′. This binary plasmid was introduced into Agrobacterium tumefaciens strain EHA105 and transformed into the Osfc16 mutant. The complementary transgenic plant lines of Osfc16 mutant that expressed full‐length cDNA of wild‐type CESA9 gene were characterized as shown in Figures 1b and 3c and Table S3. To examine the T‐DNA insertion in the Osfc16 mutant, TAIL‐PCR was performed to analyse the genetic cosegregation of the mutant phenotype with T‐DNA insertion based on the known T‐DNA sequences. As a result, the T‐DNA insertion occurred in the nonfunctional gene and did not exhibit association with the brittle culm phenotypes.
Plant cell wall fractionations
Plant cell wall fractionations were performed as described previously (Peng et al., 2000), with minor modifications as follows: the dry biomass powder (40 mesh) samples (0.1–1.0 g) were washed twice with 5.0 mL buffer and twice with 5.0 mL distilled water. The remaining pellet was stirred with 5.0 mL chloroform–methanol (1 : 1, v/v) for 1 h at 40 °C and washed twice with 5.0 mL methanol, followed by 5.0 mL acetone. The pellet was washed once with 5.0 mL distilled water. The remaining pellet was added with 5.0‐mL aliquot of DMSO–water (9 : 1, v/v), rocked gently on a shaker overnight. After centrifugation, the pellet was washed twice with 5.0 mL DMSO–water and then with 5.0 mL distilled water three times. The remaining pellet was defined as crude cell wall. The remaining crude cell wall was suspended in 0.5% (w/v) ammonium oxalate (5.0 mL) and heated for 1 h in a boiling water bath. During this step, the sample was stirred vigorously every 10 min to prevent the accumulation of materials at the tube surface. After centrifugation and washing the pellet once with 5.0 mL ammonium oxalate and twice with 5.0 mL distilled water, the pellet was suspended in 4 M KOH containing 1.0 mg/mL sodium borohydride (5.0 mL) and incubated for 1 h at 25 °C. During this step, the sample was stirred vigorously every 10 min. After centrifugation, the pellet was washed once with 5.0 mL 4 m KOH and twice with 5.0 mL distilled water. The remaining pellet was defined as crude cellulose. Meanwhile, the remaining pellet from KOH extraction (crude cellulose) was also suspended in 5.0 mL acetic acid–nitric acid–water (8 : 1 : 2, v/v/v) and heated for 1 h in a boiling water bath with stirring every 10 min. After centrifugation, the pellet was washed twice with 5.0 mL water and the remaining pellet was defined as crystalline cellulose sample.
Cellulose extraction and gradation
The dry biomass powders (0.2–1 g) of hull and stem samples were treated with 4 m KOH containing 1.0 mg/mL sodium borohydride (10 mL) at 25 °C for 1 h and then centrifuged (2810 g ) for 5 min. The pellet was retreated with 4 m KOH for one more time and washed with distilled water five times until pH at 7.0. The remaining pellet was further added with 8% NaClO2 (10 mL) at 25 °C for 72 h (NaClO2 change every 12 h). After centrifugation, the pellet samples were washed with distilled water for five times until pH 7.0 and then further treated with 50 U xylanase (Lot 91101c; Megazyme, Ireland) at 60 °C for 24 h. The remaining pellet was retreated with 8% NaClO2 for one more time and dried as purified cellulose sample, which were verified with nondetectable lignin and less than 1%–2% (of dry matter) pentoses.
The purified cellulose samples (40 mg) were further treated with 3 mL 1‐butyl‐3‐methylimidazolium acetate at 70 °C for 25 min (stem) and 40 min (hull), respectively. The samples were added with 3 mL DMSO and then fully suspended. After centrifugation (2810 g ) for 5 min, the supernatant was collected as low‐DP cellulose sample for cellulose level assay and atomic force microscopy (AFM) observation as described below. The remaining pellet was retreated with 2 mL 1‐butyl‐3‐methylimidazolium acetate at 90 °C until fully dissolved, and then well mixed with 2 mL DMSO as collection of high‐DP cellulose sample for cellulose level assay and AFM observation. The high‐ and low‐DP cellulose samples were respectively mixed with distilled water (1 : 1, v/v) at 50 °C and centrifuged (2810 g ) for 5 min. The precipitated residues were then collected as high‐ and low‐DP cellulose samples for DP detection by the viscometry method described below.
Cell wall composition determinations
Cellulose level was determined using the anthrone/H2SO4 method (Fry, 1988), and total hemicellulose contents were calculated subjective to total hexoses and pentoses in the hemicellulose fraction. Total pentoses were detected using the orcinol/HCl method (Dische, 1962). To eliminate the interference of pentoses on hexoses reading at 620 nm, a deduction from pentoses reading at 660 nm was carried out for final hexoses calculation. A standard curve referred for the deduction was drawn using a series of xylose concentrations, which was confirmed by GC‐MS analysis. Total lignin content was determined by the two‐step acid hydrolysis method according to the Laboratory Analytical Procedure of the National Renewable Energy Laboratory, USA (Sluiter et al., 2008). All experiments were conducted in the biological triplicates.
Cellulose CrI and DP detections
The X‐ray diffraction (XRD) method was applied for detection of the lignocellulose crystallinity index (CrI) in the crude cell wall materials using Rigaku‐D/MAX instrument (Ultima III; Japan) as described by Zhang et al. (2013). The XRD method was detected with SD at ±0.05–0.15 using five representative samples in triplicate. The relative DP of cellulose was independently measured by the viscometry method as described by Zhang et al. (2013).
Microscopic observations
Scanning electron microscopy (SEM; JSM‐6390/LV, Hitachi, Tokyo, Japan) was applied for observations of biomass residues and plant tissues obtained from pretreatments and sequential enzymatic hydrolysis as described by Li et al. (2015). For plant tissue in situ enzymatic digestion, the second‐stem transverse sections at heading stages were pretreated with 1% NaOH or 1% H2SO4 as described below, washed with distilled water until pH 7.0 and incubated with 1 g/L mixed cellulase for 2 h at 50 °C. After enzymatic hydrolysis, the tissue samples were sputter‐coated with gold and observed for 5–10 times with the photography of representative images. The mixed cellulase containing β‐glucanase (≥6 × 10⁴ U), cellulase (≥600 U) and xylanase (≥1.0 × 10⁵ U) was commercially available from Imperial Jade Bio‐technology Co., Ltd (Ningxia, 750002, China).
Transmission electron microscopy (TEM) was used to observe cell wall structures in the third leaf veins of three‐leave‐old seedlings. The samples were post‐fixed in 2% (w/v) OsO4 for 1 h after extensively washing in the PBS buffer and embedded with Super Kit (Sigma). Sample sections were cut with an Ultracut E ultramicrotome (Leica) and picked up on formvar‐coated copper grids. After poststaining with uranyl acetate and lead citrate, the specimens were viewed under a Hitachi H7500 transmission electron microscope.
AFM was applied to observe cellulose particles. The cellulose samples obtained as previously described in the ‘Cellulose extraction and gradation’ section were suspended in ultrahigh‐purity water and placed on mica using a pipette. The mica was glued onto a metal disc (15 mm diameter) after removal of extra water under nitrogen and then placed on the piezo scanner of AFM (MultiMode VIII; Bruker, Santa Barbara, CA). AFM imaging was carried out in ScanAsyst‐Air mode using Bruker ScanAsyst‐Air probes (tip radius, 2 nm; and silicon nitride cantilever; spring constant, 0.4 N/m) with a slow scan rate of 1 Hz. All AFM images were third‐flattened and analysed quantitatively using NanoScope Analysis software (Bruker). Ten dots of each AFM image were randomly selected, and the width (nm) of each dot was measured by NanoScope Analysis software (Bruker). The average particle width of each image was calculated from the selected ten particles.
Biomass pretreatment and enzymatic hydrolysis
The chemical (H2SO4, NaOH) pretreatment and sequential enzymatic hydrolysis were performed as described by Xu et al. (2012). The CaO pretreatment was performed as follows: the well‐mixed biomass powder samples were treated with CaO (7.5% w/w) and shaken at 150 rpm for 36 h at 50 °C. SEM observation was described above using the biomass residues obtained from pretreatment and enzymatic digestion.
Yeast fermentation and ethanol measurement
Saccharomyces cerevisiae (Angel yeast Co., Ltd, Yichang, China) was used in all the fermentation reactions, and the yeast powder was dissolved in 0.2 m phosphate buffer (pH 4.8) for 30 min for activation prior to use. The well‐mixed biomass powders were pretreated with CaO (7.5% w/w) and 1% H2SO4 as described above. After pretreatments, the biomass residues and supernatants were neutralized to pH 4.8 using appropriate amounts of CaO or H2SO4 and were autoclaved for 20 min. Then, mixed cellulases were loaded into each solution with the final enzyme concentration at 3.2 g/L (64 mg/g dry matter) and incubated at 50 °C under 150 rpm for 48 h. After that, the activated yeast was inoculated into the mixture of enzymatic hydrolysates and residues, and to the initial cell mass concentration at 0.5 g/L. The fermentation experiments were performed at 37 °C for 48 h, and the tube cover was loosened a bit to remove the generated CO2. The fermentation solution was distilled after 48 h for determination of ethanol content. All samples were carried out in the biological triplicates.
Ethanol content was measured using the dichromate oxidation method (Fletcher and van Staden, 2003) with minor modifications (Li et al., 2014).
Calcofluor, CGA325′615 and MG132 treatments in the plant growth
The germinated seeds of Osfc16 mutant and wild type were transferred onto the MS media supplied with Calcofluor White dye (Sigma‐Aldrich Co. LLC, California, USA) at different concentrations. After 24‐h incubation, the root tissues were measured every 24 h and harvested after 48 h for cellulose content, DP and CrI assays. For CGA325′615 (CGA) treatment, the germinated seeds were incubated with 20 nm CGA (kindly provided by Syngenta Com., Switzerland) in the MS media for 72 h. The root tissues were then measured and harvested for cellulose content, DP and CrI assays. All experiments were performed in the biological triplicates.
For the MG132 treatment, 6‐week‐old seedlings were incubated with 150 mm MG132 (dissolved in 1% DMSO; purchased from Alabiochem Tech. Co., Ltd, China) for 4 h. The seedlings were also treated with 1.5% DMSO as control. After treatments, total proteins of the seedlings were extracted in the extraction buffer (50 mm MOPS/NaOH buffer, pH 7.5, 0.25 m sucrose, 1.0 mm PMSF, 1.0 μm pepstatin A and 1.0 μm leupeptin), transferred to 15‐mL tubes and centrifuged at 2000 g for 10 min at 4 °C. The supernatant was incubated with 100 mm MG132 or the solvent DMSO for 1 h in room temperature. The protein concentration was determined using the BCA kits (Yeasen Tech. Co., Ltd, China). The reactions were stopped by the addition of SDS‐PAGE loading buffer.
Microsomal membrane extractions
Microsomal membranes were extracted as described by Peng et al. (2002) using fresh rice stem tissues (14 g) at heading stage with minor modification. The samples were ground to a fine powder in liquid nitrogen and extracted with 70 mL of ice‐cold extraction buffer (50 mm MOPS/NaOH buffer, pH 7.5, 0.25 m sucrose) containing protease inhibitors (1.0 mm PMSF, 1.0 μm pepstatin A and 1.0 μm leupeptin). The extracts were transferred to 15‐mL tubes and centrifuged at 2000 g for 10 min at 4 °C. The resultant supernatant was filtered through two layers of gauze, and the filtrate was centrifuged at 100 000 g for 30 min. The remaining pellet was suspended in extraction buffer containing protease inhibitors and incubated for 30 min at 4 °C under continuous stirring in the presence of 0.05% digitonin. Finally, the homogenate was centrifuged at 5000 g for 15 min. The protein concentration in the supernatant was determined using the BCA kits (Yeasen Tech. Co., Ltd, China).
Immunoprecipitation and Western blot analysis
Microsomal membrane extracts were suspended in the extraction buffer containing protease inhibitors and held under continuous stirring for 30 min at 4 °C in the presence of 2% Triton X‐100. The homogenates were then centrifuged at 5000 g for 15 min, and the extracted proteins were measured by the BCA kits as used at the same amounts in mutant and wild‐type plants. 500 μL supernatants (2% Triton X‐100 soluble) was mixed with 5 μL (9 μg) of anti‐CESA4/7 and incubated for 1 h at 4 °C. Next, 40 μL of protein A–agarose was added into sample tubes and gently shaken for 1 h at 4 °C with end‐over‐end rotation. After centrifugation for 1 min at 2000 g , the harvested pellets were washed three times with ice‐cold extraction buffer and heated in 50 μL of sampling buffer at 70 °C for 5 min, then at 100 °C for 5 min. The obtained proteins were loaded into a 10% SDS‐PAGE gel.
Following electrophoresis separation, the proteins were transferred to a PVDF membrane. The membrane was blocked with TBS buffer (20 mm Tris‐HCl and 500 mm NaCl, pH 7.5) plus 5% nonfat dry milk for 1.5 h, rinsed with TTBS buffer (0.05% Tween‐20 in TBS) for three times and incubated with primary antibody serum (CESA4 antibody, 1 : 400 dilution; CESA7 antibody, 1 : 400 dilution; CESA9 antibody, 1 : 500 dilution) for 1 h at room temperature. Generations of CESA4‐, CESA7‐ and CESA9‐specific antibodies were described previously (Zhang et al., 2009). After three times of washing with TTBS, the membrane was incubated with secondary antibody (affinity‐purified phosphatase‐labelled goat anti‐rabbit IgG at a 1 : 10000) for 1 h at room temperature. The membrane was finally washed three times with TTBS and one time with TBS (200 mm Tris‐HCl, 150 mm NaCl, pH 7.5). The reactions were detected by the ECL Plus Western Blotting Detection. The relative protein levels were calculated using Quantity One software and the RuBisCO large subunit protein (RbcL) of SDS‐PAGE gel as internal reference.
Supporting information
Figure S1. CESA9 mutation at the fully conserved CESA site in all CESA family proteins of plant species examined in rice, Arabidopsis, cotton, sorghum, maize, Brachypodium, poplar and Eucalyptus. ** indicates Osfc16 mutation site.
Figure S2. Biomass enzymatic saccharification of mature stems in Osfc16 and WT. Hexose yields released from time course enzymatic hydrolysis after (a) 1% NaOH or (b) 1% H2SO4 pretreatment.
Table S1. Information on CESA mutants and transgenic lines in plants.
Table S2. Agronomic traits in WT and Osfc16 in the three paddy field experiments from 2012 to 2014.
Table S3. Agronomic traits of WT, Osfc16 and complementary line in field experiment.
Table S4. Hexoses released from enzymatic (mixed‐cellulase) hydrolysis after pretreatments with NaOH and H2SO4.
Table S5. Ethanol yields obtained by yeast fermentation from biomass enzymatic hydrolysis of the mature stems after chemical pretreatments.
Table S6. Effects of Calcofluor and CGA on cellulose level, CrI and DP in WT and Osfc16.
Table S7. Cell wall composition (% dry matter) in WT and Osfc16.
Table S8. Cellulose DP of two gradated fractions in hull and stem of WT and Osfc16.
Acknowledgements
This work was supported in part by grants from the National Science Foundation of China (31670296; 31571721), Fundamental Research Funds for the Central Universities of China (Program No. 2662015PY018), the National 111 Project (B08032), the National Transgenic Project (2009ZX08009‐119B) and the Doctoral Scientific Research Foundation of Liaoning Province (201601107). We would like to thank Dr. Qifa Zhang for general comments on the manuscript and Dr Yihua Zhou for kindly providing partial OsCESA4, OsCESA7 and OsCESA9 antibodies. Also, we thank all colleagues in Biomass and Bioenergy Research Center for reading and discussion of the manuscript.
Conflict of interest
The authors declare no conflict of interest.
References
- Abramson, M. , Shoseyov, O. and Shani, Z. (2010) Plant cell wall reconstruction toward improved lignocellulosic production and processability. Plant Sci. 178, 61–72. [Google Scholar]
- Bonawitz, N.D. , Kim, J.I. , Tobimatsu, Y. , Ciesielski, P.N. , Anderson, N.A. , Ximenes, E. , Maeda, J. et al. (2014) Disruption of Mediator rescues the stunted growth of a lignin‐deficient Arabidopsis mutant. Nature, 509, 376–380. [DOI] [PubMed] [Google Scholar]
- Burton, R.A. and Fincher, G.B. (2014) Plant cell wall engineering: applications in biofuel production and improved human health. Curr. Opin. Biotechnol. 26, 79–84. [DOI] [PubMed] [Google Scholar]
- Chen, F. and Dixon, R.A. (2007) Lignin modification improves fermentable sugar yields for biofuel production. Nat. Biotechnol. 25, 759–761. [DOI] [PubMed] [Google Scholar]
- Chiniquy, D. , Sharma, V. , Schultink, A. , Baidoo, E.E. , Rautengarten, C. , Cheng, K. , Carroll, A. et al. (2012) XAX1 from glycosyltransferase family 61 mediates xylosyltransfer to rice xylan. Proc. Natl Acad. Sci. USA, 109, 17117–17122. [DOI] [PMC free article] [PubMed] [Google Scholar]
- Crook, M.J. and Ennos, A.R. (1994) Stem and root characteristics associated with lodging resistance in four winter wheat cultivars. J. Agric. Sci. 123, 167–174. [Google Scholar]
- Crowell, E.F. , Bischoff, V. , Desprez, T. , Rolland, A. , Stierhof, Y.D. , Schumacher, K. , Gonneau, M. et al. (2009) Pausing of Golgi bodies on microtubules regulates secretion of cellulose synthase complexes in Arabidopsis. Plant Cell, 21, 1141–1154. [DOI] [PMC free article] [PubMed] [Google Scholar]
- Ding, S.Y. , Liu, Y.S. , Zeng, Y. , Himmel, M.E. , Baker, J.O. and Bayer, E.A. (2012) How does plant cell wall nanoscale architecture correlate with enzymatic digestibility? Science, 338, 1055–1060. [DOI] [PubMed] [Google Scholar]
- Dische, Z . (1962) Color reactions of carbohydrates. In Methods in Carbohydrate Chemistry, vol. 1 ( Whistler, R.L. and Wolfrom, M.L. , eds), pp. 477–512. New York: Academic Press. [Google Scholar]
- Doudna, J.A. and Charpentier, E. (2014) The new frontier of genome engineering with CRISPR‐Cas9. Science, 346, 1258096. [DOI] [PubMed] [Google Scholar]
- Fletcher, P.J. and van Staden, J.F. (2003) Determination of ethanol in distilled liquors using sequential injection analysis with spectrophotometric detection. Anal. Chim. Acta, 499, 123–128. [Google Scholar]
- Fry, S.C. (1988) The Growing Plant Cell Wall: Chemical and Metabolic Analysis. London: Longman, pp. 95–97. [Google Scholar]
- Haigler, C.H. , Brown, R.M. and Benziman, M. (1980) Calcofluor white ST Alters the in vivo assembly of cellulose microfibrils. Science, 210, 903–906. [DOI] [PubMed] [Google Scholar]
- Harris, D.M. , Corbin, K. , Wang, T. , Gutierrez, R. , Bertolo, A.L. , Petti, C. , Smilgies, D.M. et al. (2012) Cellulose microfibril crystallinity is reduced by mutating C‐terminal transmembrane region residues CESA1A903V and CESA3T942I of cellulose synthase. Proc. Natl Acad. Sci. USA, 109, 4098–4103. [DOI] [PMC free article] [PubMed] [Google Scholar]
- Himmel, M.E. , Ding, S.Y. , Johnson, D.K. , Adney, W.S. , Nimlos, M.R. , Brady, J.W. and Foust, T.D. (2007) Biomass recalcitrance: engineering plants and enzymes for biofuels production. Science, 315, 804–807. [DOI] [PubMed] [Google Scholar]
- Huang, D. , Wang, S. , Zhang, B. , Shang‐Guan, K. , Shi, Y. , Zhang, D. , Liu, X. et al. (2015) A Gibberellin‐Mediated DELLA‐NAC signaling cascade regulates cellulose synthesis in rice. Plant Cell, 27, 1681–1696. [DOI] [PMC free article] [PubMed] [Google Scholar]
- Islam, M.S. , Peng, S. , Visperas, R.M. , Ereful, N. , Bhuiya, M.S.U. and Julfiquar, A.W. (2007) Lodging‐related morphological traits of hybrid rice in a tropical irrigated ecosystem. Field. Crop. Res. 101, 240–248. [Google Scholar]
- Kumar, R. , Mago, G. , Balan, V. and Wyman, C.E. (2009) Physical and chemical characterizations of corn stover and poplar solids resulting from leading pre‐treatment technologies. Bioresour. Technol. 100, 3948–3962. [DOI] [PubMed] [Google Scholar]
- Kurek, I. , Kawagoe, Y. , Jacob‐Wilk, D. , Doblin, M. and Delmer, D. (2002) Dimerization of cotton fiber cellulose synthase catalytic subunits occurs via oxidation of the zinc‐binding domains. Proc. Natl Acad. Sci. USA, 99, 11109–11114. [DOI] [PMC free article] [PubMed] [Google Scholar]
- Li, X. , Qian, Q. , Fu, Z. , Wang, Y. , Xiong, G. , Zeng, D. , Wang, X. et al. (2003) Control of tillering in rice. Nature, 422, 618–621. [DOI] [PubMed] [Google Scholar]
- Li, F. , Ren, S. , Zhang, W. , Xu, Z. , Xie, G. , Chen, Y. , Tu, Y. et al. (2013) Arabinose substitution degree in xylan positively affects lignocellulose enzymatic digestibility after various NaOH/H2SO4 pretreatments in Miscanthus . Bioresour. Technol. 130, 629–637. [DOI] [PubMed] [Google Scholar]
- Li, M. , Si, S. , Hao, B. , Zha, Y. , Wan, C. , Hong, S. , Kang, Y. et al. (2014) Mild alkali‐pretreatment effectively extracts guaiacyl‐rich lignin for high lignocellulose digestibility coupled with largely diminishing yeast fermentation inhibitors in Miscanthus . Bioresour. Technol. 169, 447–454. [DOI] [PubMed] [Google Scholar]
- Li, F. , Zhang, M. , Guo, K. , Hu, Z. , Zhang, R. , Feng, Y. , Yi, X. et al. (2015) High‐level hemicellulosic arabinose predominately affects lignocellulose crystallinity for genetically enhancing both plant lodging resistance and biomass enzymatic digestibility in rice mutants. Plant Biotechnol. J. 13, 514–525. [DOI] [PubMed] [Google Scholar]
- Liu, L. , Shang‐Guan, K. , Zhang, B. , Liu, X. , Yan, M. , Zhang, L. , Shi, Y. et al. (2013) Brittle Culm1, a COBRA‐like protein, functions in cellulose assembly through binding cellulose microfibrils. PLoS Genet. 9, e1003704. [DOI] [PMC free article] [PubMed] [Google Scholar]
- Olek, A.T. , Rayon, C. , Makowski, L. , Kim, H.R. , Ciesielski, P. , Badger, J. , Paul, L.N. et al. (2014) The structure of the catalytic domain of a plant cellulose synthase and its assembly into dimers. Plant Cell, 26, 2996–3009. [DOI] [PMC free article] [PubMed] [Google Scholar]
- Pauly, M. and Keegstra, K. (2008) Cell‐wall carbohydrates and their modification as a resource for biofuels. Plant J. 54, 559–568. [DOI] [PubMed] [Google Scholar]
- Pear, J.R. , Kawagoe, Y. , Schreckengost, W.E. , Delmer, D.P. and Stalker, D.M. (1996) Higher plants contain homologs of the bacterial celA genes encoding the catalytic subunit of cellulose synthase. Proc. Natl Acad. Sci. USA, 93, 12637–12642. [DOI] [PMC free article] [PubMed] [Google Scholar]
- Peng, L. , Hocart, C.H. , Redmond, J.W. and Williamson, R.E. (2000) Fractionation of carbohydrates in Arabidopsis root cell walls shows that three radial swelling loci are specifically involved in cellulose production. Planta, 211, 406–414. [DOI] [PubMed] [Google Scholar]
- Peng, L. , Xiang, F. , Roberts, E. , Kawagoe, Y. , Greve, L.C. , Kreuz, K. and Delmer, D.P. (2001) The experimental herbicide CGA 325′615 inhibits synthesis of crystalline cellulose and causes accumulation of non‐crystalline beta‐1,4‐glucan associated with CesA protein. Plant Physiol. 126, 981–992. [DOI] [PMC free article] [PubMed] [Google Scholar]
- Peng, L. , Kawagoe, Y. , Hogan, P. and Delmer, D. (2002) Sitosterol‐β‐glucoside as primer for cellulose synthesis in plants. Science, 295, 147–150. [DOI] [PubMed] [Google Scholar]
- Segal, L. , Creely, J.J. , Martin, A.E. and Conrad, C.M. (1959) An empirical method for estimating the degree of crystallinity of native cellulose using the X‐Ray diffractometer. Text. Res. J. 29, 786–794. [Google Scholar]
- Sethaphong, L. , Haigler, C.H. , Kubicki, J.D. , Zimmer, J. , Bonetta, D. , DeBolt, S. and Yingling, Y.G. (2013) Tertiary model of a plant cellulose synthase. Proc. Natl Acad. Sci. USA, 110, 7512–7517. [DOI] [PMC free article] [PubMed] [Google Scholar]
- Sluiter, A. , Hames, B. , Ruiz, R. , Scarlata, C. , Sluiter, J. , Templeton, D. and Crocker, D. (2008) Determination of structural carbohydrates and lignin in biomass (Tech. Rep. NREL/TP‐510‐42618, NREL, Golden, Co).
- Smalle, J. and Vierstra, R.D. (2004) The ubiquitin 26S proteasome proteolytic pathway. Annu. Rev. Plant Biol. 55, 555–590. [DOI] [PubMed] [Google Scholar]
- Somerville, C.R. (2006) Cellulose synthesis in higher plants. Annu. Rev. Cell Dev. Biol. 22, 53–78. [DOI] [PubMed] [Google Scholar]
- Song, X.Q. , Liu, L.F. , Jiang, Y.J. , Zhang, B.C. , Gao, Y.P. , Liu, X.L. , Lin, Q.S. et al. (2013) Disruption of secondary wall cellulose biosynthesis alters cadmium translocation and tolerance in rice plants. Mol. Plant, 6, 768–780. [DOI] [PubMed] [Google Scholar]
- Tanaka, K. , Murata, K. , Yamazaki, M. , Onosato, K. , Miyao, A. and Hirochika, H. (2003) Three distinct rice cellulose synthase catalytic subunit genes required for cellulose synthesis in the secondary wall. Plant Physiol. 133, 73–83. [DOI] [PMC free article] [PubMed] [Google Scholar]
- Taylor, N.G. , Howells, R.M. , Huttly, A.K. , Vickers, K. and Turner, S.R. (2003) Interactions among three distinct CesA proteins essential for cellulose synthesis. Proc. Natl Acad. Sci. USA, 100, 1450–1455. [DOI] [PMC free article] [PubMed] [Google Scholar]
- Wang, L. , Guo, K. , Li, Y. , Tu, Y. , Hu, H. , Wang, B. , Cui, X. et al. (2010) Expression profiling and integrative analysis of the CESA/CSL superfamily in rice. BMC Plant Biol. 10, 282. [DOI] [PMC free article] [PubMed] [Google Scholar]
- Wilkerson, C.G. , Mansfield, S.D. , Lu, F. , Withers, S. , Park, J.Y. , Karlen, S.D. , Gonzales‐Vigil, E. et al. (2014) Monolignol ferulate transferase introduces chemically labile linkages into the lignin backbone. Science, 344, 90–93. [DOI] [PubMed] [Google Scholar]
- Xie, G. , Yang, B. , Xu, Z. , Li, F. , Guo, K. , Zhang, M. , Wang, L. et al. (2013) Global identification of multiple OsGH9 family members and their involvement in cellulose crystallinity modification in rice. PLoS ONE, 8, e50171. [DOI] [PMC free article] [PubMed] [Google Scholar]
- Xu, N. , Zhang, W. , Ren, S. , Liu, F. , Zhao, C. , Liao, H. , Xu, Z. et al. (2012) Hemicelluloses negatively affect lignocellulose crystallinity for high biomass digestibility under NaOH and H2SO4 pretreatments in Miscanthus . Biotechnol. Biofuels, 5, 58. [DOI] [PMC free article] [PubMed] [Google Scholar]
- Zhang, B. , Deng, L. , Qian, Q. , Xiong, G. , Zeng, D. , Li, R. , Guo, L. et al. (2009) A missense mutation in the transmembrane domain of CESA4 affects protein abundance in the plasma membrane and results in abnormal cell wall biosynthesis in rice. Plant Mol. Biol. 71, 509–524. [DOI] [PubMed] [Google Scholar]
- Zhang, W. , Yi, Z. , Huang, J. , Li, F. , Hao, B. , Li, M. , Hong, S. et al. (2013) Three lignocellulose features that distinctively affect biomass enzymatic digestibility under NaOH and H2SO4 pretreatments in Miscanthus . Bioresour. Technol. 130, 30–37. [DOI] [PubMed] [Google Scholar]
- Zhao, J. , Wang, T. , Wang, M. , Liu, Y. , Yuan, S. , Gao, Y. , Yin, L. et al. (2014) DWARF3 participates in an SCF complex and associates with DWARF14 to suppress rice shoot branching. Plant Cell Physiol. 55, 1096–1109. [DOI] [PubMed] [Google Scholar]
Associated Data
This section collects any data citations, data availability statements, or supplementary materials included in this article.
Supplementary Materials
Figure S1. CESA9 mutation at the fully conserved CESA site in all CESA family proteins of plant species examined in rice, Arabidopsis, cotton, sorghum, maize, Brachypodium, poplar and Eucalyptus. ** indicates Osfc16 mutation site.
Figure S2. Biomass enzymatic saccharification of mature stems in Osfc16 and WT. Hexose yields released from time course enzymatic hydrolysis after (a) 1% NaOH or (b) 1% H2SO4 pretreatment.
Table S1. Information on CESA mutants and transgenic lines in plants.
Table S2. Agronomic traits in WT and Osfc16 in the three paddy field experiments from 2012 to 2014.
Table S3. Agronomic traits of WT, Osfc16 and complementary line in field experiment.
Table S4. Hexoses released from enzymatic (mixed‐cellulase) hydrolysis after pretreatments with NaOH and H2SO4.
Table S5. Ethanol yields obtained by yeast fermentation from biomass enzymatic hydrolysis of the mature stems after chemical pretreatments.
Table S6. Effects of Calcofluor and CGA on cellulose level, CrI and DP in WT and Osfc16.
Table S7. Cell wall composition (% dry matter) in WT and Osfc16.
Table S8. Cellulose DP of two gradated fractions in hull and stem of WT and Osfc16.