

Abstract
Background/Aim
The epidemiology of hepatocellular carcinoma (HCC) has changed in the United States (US) recently. The aim of this study is to evaluate the recent trends of HCC epidemiology in the Olmsted County, Minnesota, US.
Method
Residents aged over 20 with newly diagnosed HCC were identified using the Rochester Epidemiology Project database. Clinical information was compared among patients diagnosed between 2000 and 2009 (era 1) and 2010–2014 (era 2).
Result
Over 1.6 million person years of follow up, 93 residents were diagnosed with HCC. The mean age was 67 and 71% were male. The age- and sex-adjusted incidence rates were 6.3 and 7.0 per 100,000 person-years in the first and second eras (P=0.64). The proportion with HBV etiology increased from 4% to 21% between the two eras (P<0.01) while there was a trend toward a decreasing proportion of HCV etiology from 42% to 29% (P=0.20). Only 39% of HCC surveillance candidates had HCCs detected under surveillance and 41% of cirrhotic patients had unrecognized cirrhosis at the time of HCC diagnosis. NAFLD was associated with unrecognized cirrhosis and absence of cirrhosis at HCC diagnosis. More than half (56%) of patients presented at BCLC stage C or D and the median survival was 9.7 months. The overall survival had not changed over time.
Conclusion
The incidence of HCC remained stable after 2010 in Olmsted County. The proportion of HBV-induced HCC increased while there was a trend of decreasing proportion of HCV-induced HCC. The overall survival in community residents with HCC remains poor.
Keywords: liver cancer, incidence, surveillance
Introduction
Incidence rates of hepatocellular carcinoma (HCC) in the United States (US) have increased rapidly over the past several decades.1 The main driver of the increased HCC incidence rates in the US has been the high prevalence of chronic hepatitis C virus (HCV) infection in the cohort of persons born between 1945 and 1965.2, 3 A previous population based study of HCC incidence trends in Olmsted County, Minnesota, from 1976 to 2008 confirmed the increasing incidence rates of HCC reported nationally. In addition, HCV was validated as the main driver of the increase in HCC incidence rates after 2000.4
Results from the Surveillance, Epidemiology and End Results (SEER) database have recently shown that the steep rate of rise in incidence rates of HCC in the US over the past 3–4 decades began to slow down between 2007 and 2010.5 Changing prevalences of the risk factors for HCC may explain these changes in the incidence trends. While the disease burden of HCV associated HCC is expected to decrease over the next decade due to wide spread use of potent antiviral agents against HCV, nonalcoholic fatty liver disease (NAFLD) is emerging as a major etiology of HCC.6, 7 However, trends in the relative contributions of HCV and NAFLD as etiologies of HCC in the general population remain to be determined.
Surveillance of persons at high risk for HCC is associated with earlier detection of HCC and better clinical outcomes.6 Previous studies have reported substantial underutilization of HCC surveillance in the US, which at least in part explains the relatively poor outcomes of patients with HCC in the US.8 Awareness of the value of HCC surveillance has improved over the past decade, but it is not clear whether the utilization of HCC surveillance or the detection of HCC have increased in the US general population.9
The aim of this study is to evaluate the recent temporal trends in the incidence rates, etiology, surveillance, treatment, and survival of Olmsted County, Minnesota residents diagnosed with HCC between 2000 and 2014.
Method
Database
The Rochester Epidemiology Project (REP) database has been previously described in detail.10 In brief summary, population-based epidemiologic research can be conducted in Olmsted County, Minnesota because medical records for the entire population are available from most health care providers in the county. Medical records are indexed into the same system and are also available for use in approved studies. The REP database is a robust data linkage system that integrates medical records in a searchable database. Eighty-seven percent of Olmsted County residents are seen by a health care provider at least once a year and over 95% of residents are seen within any given 4 year period. The REP database contains information on almost all of the medical care provided in Olmsted County and the coverage is essentially 100% for diseases such as HCC as specialty services necessary for diagnosis and treatment are provided at Mayo Clinic.
Patients
All Olmsted county residents aged over 20 with a newly diagnosed HCC between 2000 and 2014 were identified using the Rochester Epidemiology Project database. We identified patients with HCC using ICD-9 codes (155;155.0;155.1;155.2). To assure complete identification of HCC, the following Hospital International Classification of Disease Adaptation (HICDA) codes were also used: hepatocellular carcinoma, primary (01550150); neoplasm, malignant, liver primary (01550110); hepatoma, nos (malignant) (01550140); carcinoma, hepatocellular, code also neoplasm, malignant by site - liver (01550141); carcinoma, liver cell (01550151).
HCC diagnosis was confirmed based on histology or radiology. Radiologic confirmation of HCC was based on the American Association for the Study of Liver Disease (AASLD) guideline (larger than 1cm nodules in cirrhotic liver with enhancement in the arterial phase and washout in the portal venous or delayed phase).11 In addition, a small number of patients who did not meet the AASLD criteria but were diagnosed with HCC by clinician`s consensus and underwent HCC-specific treatment (n=6, 6.5%) were also included.
In order to prevent inclusion of patients who might have moved into Olmsted County for the management of HCC or liver disease, residents who lived within Olmsted County for less than one year prior to HCC diagnosis were excluded (N=31). The institutional review boards of Mayo Clinic and Olmsted Medical Center approved the study.
Clinical Information
Clinical information was abstracted from the medical records. There included demography, etiology of HCC, blood test including liver function test, detection of HCC under surveillance, tumor characteristic, primary treatment modality, and survival status.
HBV etiology was confirmed based on positive HBsAg. HCV were confirmed by HCV RNA or anti-HCV with chronic liver disease. Alcohol was considered as a cause of HCC when patient had documented history of alcoholic liver disease or significant history of alcohol abuse or alcohol addiction.12 NAFLD or NASH was diagnosed with a radiologic or histologic evidence of fatty infiltration or inflammation without any history of significant alcohol intake (<20 g per day) at HCC diagnosis or at any time before HCC diagnosis.13 In the current study, alcohol or NAFLD was considered as a main etiology of HCC in the absence of viral hepatitis or other genetic/metabolic/biliary etiology of HCC.
HCC was considered to be detected during semi-annual surveillance if imaging by abdominal ultrasound, computed tomography (CT) or magnetic resonance imaging (MRI) was repeated at regular intervals of 1 year or less with the intent of surveillance and the most recent imaging study had been obtained between 3 and 9 months prior to the diagnosis of HCC.6 If the most recent imaging study had been obtained between 10 and 12 months prior to the diagnosis of HCC, HCC was considered to be detected during annual surveillance.
Cirrhosis was defined by histology (34%) or without histology (66%) based on characteristic finding of cirrhosis or portal hypertension in the cross-sectional images (nodular configuration of liver or sign of portal hypertension such as varices, splenomegaly, dilated portal vein, ascites) and thrombocytopenia (platelet<150K).6 Tumor characteristics were abstracted based on cross-sectional images at the time of HCC diagnosis. Vital status of study subjects was assessed as of November 11, 2015.
Statistical Analysis
JMP (v.10; SAS Institute Inc., Cary, NC) was used for statistical analyses. Student t test or Wilcoxon–Mann–Whitney test was used to assess the difference of continuous variables and the chi-square or Fisher’s exact test was used to for comparison of categorical variables. Patient survival was assessed from the time of HCC diagnosis to the last known follow-up or death. Survival probabilities were estimated using the Kaplan-Meier method and compared by the log rank test. Cox proportional hazard model were used for the survival analysis.
SAS (SAS Institute, Cary, NC) was used to calculate incidence rates. The entire population of Olmsted County aged ≥20 years was considered to be at risk. Gender-specific person-year incidence rates were estimated from decennial census data with linear interpolation for the population between census years. With the assumption that incident cases follow a Poisson distribution, 95% confidence intervals for incidence rates were calculated. Overall and gender-specific incidence rates were adjusted for the age distribution of the total population structure of the United States in 2010.
Result
Patient Characteristics
Baseline clinical features of patients are summarized in Table 1. The mean age was 67 and 71% were male. The proportion of Non-Whites and foreign born patients increased in the recent era. The proportion of patients with cirrhosis, severity of underlying liver dysfunction, extent of tumor (number of nodules, size, vascular invasion, and extrahepatic metastasis) were similar between the two eras. More than half (56%) of patients presented at BCLC stage C or D. Overall 44% of patients received potentially curative treatment (resection, liver transplantation, ablation), and the proportion of patients receiving potentially curative treatment has not changed in the recent era.
Table 1.
Clinical characteristics
| Era 1 2000–2009 (N=55) |
Era 2 2010–2014 (N=38) |
Overall (N=93) |
P value | |
|---|---|---|---|---|
| Age | 69.3 ± 11.9 | 64.8 ± 13.4 | 67.4 ± 12.7 | 0.09 |
| Male | 36 (65.5%) | 30 (79.0%) | 66 (71.0%) | 0.15 |
| Race | 0.04* | |||
| White | 43 (78.2%) | 22 (57.9%) | 65 (69.9%) | |
| Black | 2 (3.6%) | 5 (13.2%) | 7 (7.5%) | |
| Asian/Others | 10 (18.2%) | 11 (29.0%) | 21 (22.6%) | |
| Immigrants | 9 (16.4%) | 15 (39.5%) | 24 (25.8%) | 0.01 |
| Liver cirrhosis | 44 (80.0%) | 29 (76.3%) | 73 (78.5%) | 0.67 |
| Histologic diagnosis of HCC |
30 (54.6%) | 21 (55.3%) | 51 (54.8%) | 0.95 |
| Laboratory data | ||||
| INR | 1.2 ± 0.2 | 1.2 ± 0.3 | 1.2 ± 0.2 | 0.21 |
| Albumin | 3.4 ± 0.6 | 3.5 ± 0.7 | 3.5 ± 0.6 | 0.60 |
| Bilirubin | 1.6 ± 2.3 | 1.6 ± 1.7 | 1.6 ± 2.1 | 0.89 |
| Creatinine | 1.2 ± 0.4 | 1.1 ± 0.6 | 1.1 ± 0.5 | 0.69 |
| MELD | 10.9 ± 4.2 | 11.2 ± 4.3 | 11.0 ± 4.3 | 0.69 |
| AFP, median [IQR] | 27 [5.2–304.8] | 6.6 [3.1–1066] | 14 [4.6–417.5] | 0.36 |
| Tumor characteristics |
||||
| Number of tumor | 2.1 ± 1.6 | 1.9 ± 1.3 | 2.0 ± 1.5 | 0.55 |
| Tumor size | 5.2 ± 4.2 | 4.5 ± 3.6 | 4.9 ± 3.9 | 0.38 |
| Vascular invasion | 9 (16.4%) | 7 (18.4%) | 16 (17.2%) | 0.80 |
| Metastasis | 8 (14.6%) | 6 (15.8%) | 14 (15.1%) | 0.87 |
| Performance status | 0.92 | |||
| 0 | 25 (45.5%) | 16 (42.1%) | 41 (44.1%) | |
| 1 | 18 (32.7%) | 13 (34.2%) | 31 (33.3%) | |
| 2 | 7 (12.7%) | 4 (10.5%) | 11 (11.8%) | |
| 3 | 5 (9.1%) | 5 (13.2%) | 10 (10.8%) | |
| Child Pugh | 0.60 | |||
| A | 11 (20.8%) | 5 (13.2%) | 16 (17.6%) | |
| B | 38 (71.7%) | 29 (76.3%) | 67 (73.6%) | |
| C | 4 (7.6%) | 4 (10.5%) | 8 (8.8%) | |
| BCLC staging | 0.57 | |||
| 0-A | 20 (37.7%) | 12 (31.6%) | 32 (35.2%) | |
| B | 3 (5.7%) | 3 (7.9%) | 6 (6.6%) | |
| C | 23 (43.4%) | 14 (36.8%) | 37 (40.7%) | |
| D | 7 (13.2%) | 9 (23.7%) | 16 (17.6%) | |
| Treatment | 0.85 | |||
| Resection | 7 (12.7%) | 3 (7.9%) | 10 (10.8%) | |
| Liver transplant | 8 (14.6%) | 4 (10.5%) | 12 (12.9%) | |
| Ablation | 11 (20.0%) | 8 (21.1%) | 19 (20.4%) | |
| TARE/TACE** | 10 (18.2%) | 11 (29.0%) | 21 (22.6%) | |
| Sorafenib/Systemic | 3 (5.5%) | 2 (5.3%) | 5 (5.4%) | |
| BSC*** | 16 (29.1%) | 10 (26.3%) | 26 (28.0%) |
comparison between White vs other race
transarterial chemoembolization/transarterial radioembolization
best supportive care
HCC Incidence Rates
Table 2 summarizes the temporal trends in the incidence rates of HCC in Olmsted County between 2000 and 2014. In the first era (2000–2009), the age-adjusted incidence rates of HCC were 9.2 per 100,000 person year for males and 3.9 per 100,000 person years for females, with an age and sex adjusted incidence rate of 6.3 per 100,000 person years. In the second era (2010–2014), the age-adjusted incidence rates of HCC were similar to the first era (12.1, 2.7, and 7.0 per 100,000 person years for males, females, and the overall population).
Table 2.
Incidence rates and incidence rate ratios of HCC
| Era 1, 2000–2009 | Era 2, 2010–2014 | Ratio: Era 2 VS. Era 1 | ||
|---|---|---|---|---|
| Incidence rate (95% CI) | Incidence rate (95% CI) | Incidence rate ratio (95% CI) | P value | |
| Gender1 | ||||
| Men | 9.2 (6.2 – 12.3) | 12.1 (7.8 – 16.4) | 1.3 (0.8 – 2.1) | 0.26 |
| Women | 3.9 (2.1 – 5.6) | 2.7 (0.8 – 4.6) | 0.7 (0.3 – 1.6) | 0.38 |
| Overall2 | 6.3 (4.6 – 7.9) | 7.0 (4.8 – 9.3) | 1.1 (0.8 – 2.1) | 0.64 |
Incidence rates calculated using the US total census population.
Incidence rates reported are age-adjusted sex-specific rates.
Incidence rates reported are age- and sex-adjusted rates.
Etiology of HCC
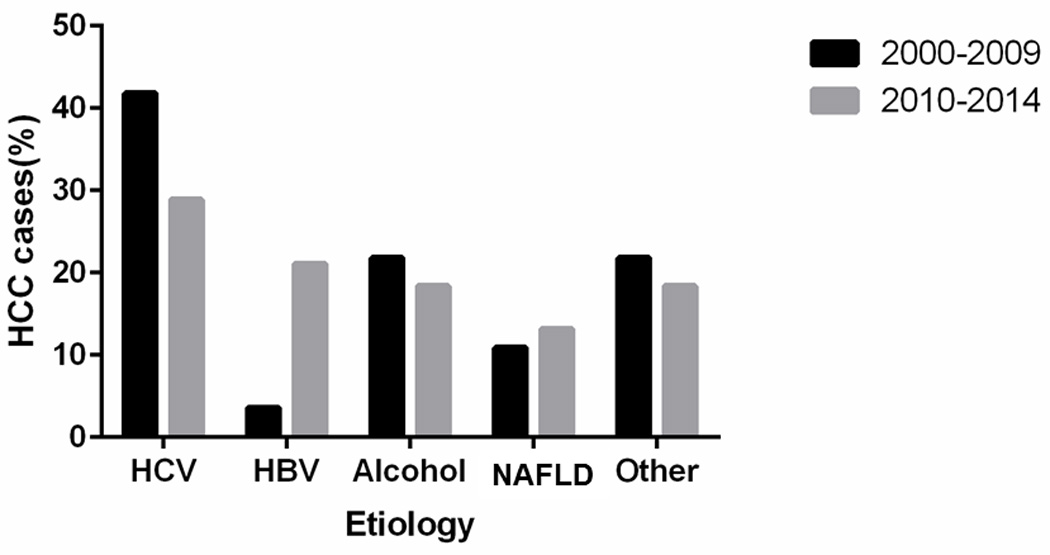
Figure 1 describes the temporal changes in the risk factors for HCC. In the first era (2000–2009), HCV was the leading risk factor for HCC (42%). About a third of HCV patients (35%) had evidence of coexisting alcoholic liver disease. Alcohol was the second most common risk factor for HCC (22%). NAFLD was the third most common cause of HCC (11%), followed by HBV (4%). The remaining 12 (22%) of HCCs had other or idiopathic etiologies. Among the 12 patients with other or idiopathic etiology, 7 patients had cirrhosis (2 primary biliary cirrhosis, 1 hereditary hemochromatosis, and 4 cryptogenic cirrhosis without evidence of metabolic syndrome) and 5 patients (of whom 3 had metabolic syndrome) had no cirrhosis.
Figure 1.
Trends in the risk factors for hepatocellular carcinoma among Olmsted County, Minnesota, residents, 2000–2009 vs. 2010–2014. HBV = hepatitis B virus; HCV = hepatitis C virus; NAFLD = nonalcoholic fatty liver disease
The proportion with HBV etiology increased from 4% to 21% between the first (2000–2009) and second (2010–2014) eras (P<0.01) while there was a trend toward a decreasing proportion of HCV etiology from 42% to 29% (P=0.20). The proportion of alcohol (18%), NAFLD (13%), and other etiologies (18%) in the second era remained largely stable, when compared to the first era. Among the 7 patients in the second era with other or idiopathic etiologies, 4 patients had cirrhosis (3 primary biliary cirrhosis, 1 cryptogenic cirrhosis with metabolic syndrome) and 3 patients (of whom 1 had metabolic syndrome) had no cirrhosis.
When NAFLD was considered as the underlying etiology of HCC in patients with cryptogenic cirrhosis or idiopathic etiology with metabolic syndrome defined by the National Cholesterol Education Program ATP III criteria14 even without radiologic or histologic evidence of steatosis and/or steatohepatitis, 16% and 18% of HCCs were attributed to NAFLD in the first and second era, respectively (P=0.80).
HCC Surveillance
Trends in HCC detection under surveillance are shown in Table 3. Most patients were eligible for HCC surveillance (81%) at the time of HCC diagnosis based on the presence of cirrhosis or HBV etiology. Proportion of patients with cirrhosis was higher in patients with viral hepatitis or alcohol etiology and lower in patients with NAFLD or idiopathic/other etiologies (P=0.01) (Table 4). With the extended definition of NAFLD, only 56% of patients with NAFLD induced HCC had cirrhosis of liver.
Table 3.
Trend of HCC detection under surveillance
| Era 1 2000–2009 |
Era 2 2010–2014 |
Total | P value | |
|---|---|---|---|---|
| Diagnosis of chronic liver disease made prior to HCC diagnosis |
41 (74.6%) | 27 (71.1%) | 68 (73.1%) | 0.71 |
| Diagnosis of cirrhosis made prior to HCC diagnosis among cirrhotics |
30 (68.2%) | 13 (44.8%) | 43 (58.9%) | 0.05 |
| HCC surveillance Indicated | 44 (80%) | 31 (81.6%) | 75 (80.7%) | 0.85 |
| Semiannual surveillance* | 16 (36.4%) | 8 (25.8%) | 24 (32.0%) | 0.33 |
| Annual surveillance* | 4 (9.1%) | 1 (3.2%) | 5 (6.7%) | 0.40 |
among individuals for whom surveillance was indicated
Table 4.
HCC Etiology and proportion of patients with cirrhosis of liver
| Proportion of cirrhosis | P value* | |
|---|---|---|
| Etiology | 0.01 | |
| HCV | 88.2% | |
| HBV | 80.0% | |
| Alcohol | 84.2% | |
| NAFLD** | 72.7% | |
| NAFLD (extended definition)*** | 56.2% | |
| Other/idiopathic etiologies | 57.9% |
Comparison between viral hepatitis and alcohol vs NAFLD, Other/idiopathic etiologies
NAFLD is defined by radiologic or histologic evidence of fatty infiltration or inflammation
NAFLD is defined by 1)radiologic or histologic evidence of fatty infiltration or inflammation or 2) cryptogenic cirrhosis or idiopathic etiology with metabolic syndrome
Among individuals eligible for HCC surveillance, HCCs were detected during semiannual surveillance in 32% of patients and during annual surveillance in 7% of patients. The proportion of HCCs detected under surveillance did not change significantly in the second compared to the first era. Among individuals eligible for HCC surveillance, a higher proportion of HCV (47%) or HBV (40%) associated HCCs were detected under surveillance than the proportion of alcohol (31%), NAFLD (25%), or other/idiopathic etiologies (36%) associated HCCs. This association was not statistically significant due to the small sample sizes (P= 0.76).
The low rate of surveillance appeared to be in part because the diagnosis of cirrhosis was not made prior to HCC diagnosis. Among 73 patients with cirrhosis at the time of HCC diagnosis, only 59% (N=43) were diagnosed with cirrhosis prior to HCC diagnosis (Table 3). Interestingly, this proportion (cirrhosis diagnosis prior to HCC diagnosis) was lower in the recent era (45%, 2010–2014) than in the previous era (68%, 2000–2009) (P=0.05) and lower in NAFLD- (38%), and HBV-induced HCC (38%) than in HCV- (70%), Alcohol- (63%) or other/idiopathic etiologies (55%) associated HCC (P=0.05).
Two thirds of patients (28/43, 65.1%) in whom cirrhosis was recognized before the diagnosis of HCC were diagnosed with HCC while under surveillance. Recognition of cirrhosis before the diagnosis of HCC was associated with earlier stage at diagnosis of HCC; 50% of patients in whom cirrhosis was recognized before the diagnosis of HCC had BCLC 0-A stage HCC, compared to only 24% of patients in whom cirrhosis was not recognized before the diagnosis of HCC (P=0.03).
As expected, HCC detection under surveillance was associated with BCLC 0-A stage of HCC (P= 0.02), higher likelihood of receiving curative surgical treatment and lower likelihood of receiving best supportive care (P=0.03) (Table 5).
Table 5.
Impact of Surveillance on BCLC staging and treatment among individuals for whom surveillance was indicated
| Surveillance (N=29) |
No surveillance (N=46) |
Overall (N=75) |
P value | |
|---|---|---|---|---|
| BCLC stage | 0.02* | |||
| 0-A | 17 (58.6%) | 12 (27.3%) | 29 (39.7%) | |
| B | 1 (3.5%) | 4 (9.1%) | 5 (6.9%) | |
| C | 7 (24.1%) | 20 (45.5%) | 27 (37.0%) | |
| D | 4 (13.8%) | 8 (18.2%) | 12 (13.8%) | |
| Treatment | 0.03** | |||
| Resection | 2 (6.9%) | 3 (6.5%) | 5 (6.7%) | |
| Liver transplant | 8 (27.6%) | 4 (8.7%) | 12 (16.0%) | |
| Ablation | 5 (17.2%) | 11 (23.9%) | 16 (21.3%) | |
| TARE/TACE*** | 9 (31.0%) | 10 (21.7%) | 19 (25.3%) | |
| Sorafenib/Systemic | 2 (6.9%) | 2 (4.4%) | 4 (5.3%) | |
| BSC**** | 3 (10.3%) | 16 (34.8%) | 19 (25.3%) |
comparison between BCLC 0-A vs B–D
comparison between curative surgical treatment (Resection, LTx) vs (Ablation, TACE/TARE/sorafenib/systemic treatment) vs BSC
transarterial chemoembolization/transarterial radioembolization
best supportive care
Overall Survival
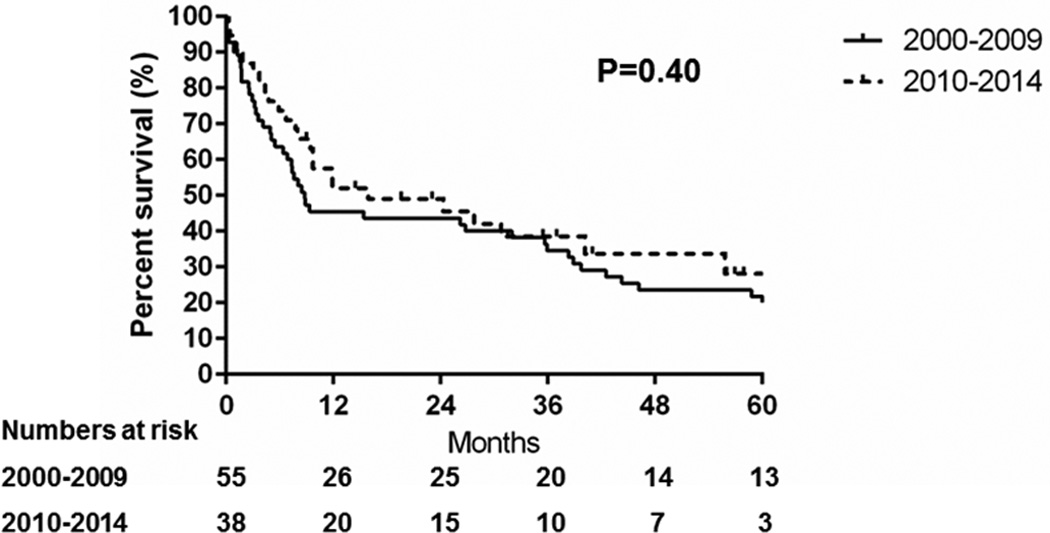
Figure 2 shows the survival probability after HCC diagnosis. The median survival was 9.7 months and the overall survival had not changed in the second compared to the first era (hazard ratio [HR]: 0.8, 95% confidence interval [CI]: 0.5–1.3, P=0.40). Consistent with the literature, HCC detection under surveillance was associated with a longer median survival (38 months with surveillance vs 8.8 months without surveillance, P=0.02) and overall survival (HR: 0.5, 95% CI: 0.3–0.9, P=0.01) (Figure 3).
Figure 2.
Trends in the survival of Olmsted County, Minnesota, residents with hepatocellular carcinoma, 2000–2009 vs. 2010–2014
Figure 3.
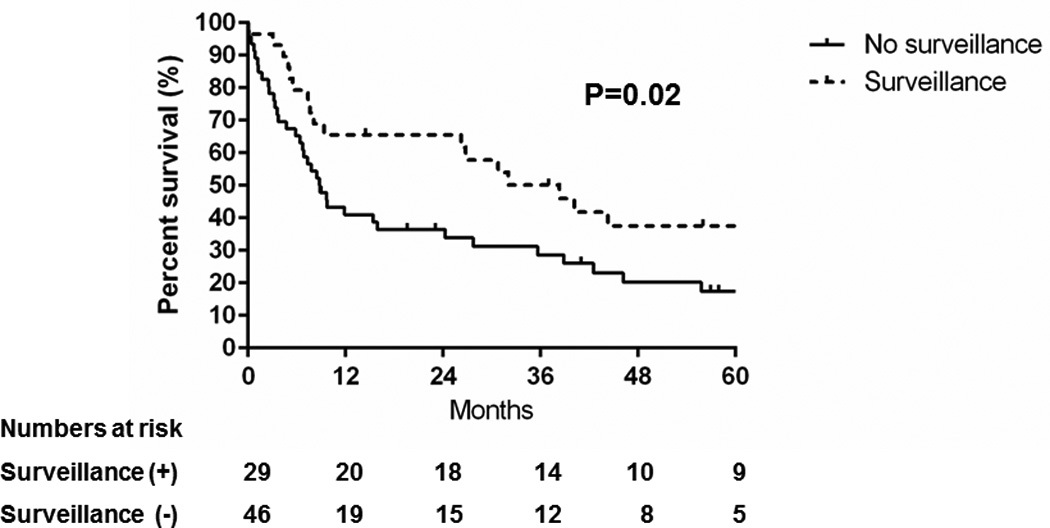
Comparison of overall survival of patients with hepatocellular carcinoma detected under surveillance vs. no surveillance
Discussion
The incidence rates of HCC rose steeply in Olmsted County between 1976 and 2008.4 The current study showed that since 2010 the recent age- and sex-adjusted incidence rates of HCC have remained relatively stable in Olmsted County, when comparison to the increasing trend in incidence rates of HCC between 2000 and 2009. Although HCV still remains as the leading etiology of HCC, there was a trend towards a decreasing proportion of HCV-induced HCC (P=0.20) and an increasing proportion of HBV-induced HCC (P<0.01). The proportion of HCCs with NAFLD or alcohol etiology remained stable. While most patients (81%) were candidates for HCC surveillance, only 32% of HCCs were detected under semi-annual surveillance among individuals for whom surveillance was indicated. The low rate of surveillance was in part because the diagnosis of cirrhosis was not made prior to HCC diagnosis: 41% of cirrhotic patients were first diagnosed with cirrhosis at the time of HCC diagnosis. This proportion of unrecognized cirrhosis was significantly higher in NAFLD (62%) and HBV (62%) associated HCC (P=0.05), highlighting the need for special attention to detection of cirrhosis in this group of patients. The overall survival (P=0.40) and proportion of HCCs detected under surveillance (P=0.14) had not improved in the recent era. As a result of the lower rate of HCC detection under surveillance, more than half (56%) of patients presented with advanced or terminal stage HCC and the median overall survival was only 9.7 months.
Data on secular trends in HCC incidence in the US from SEER has shown that the incidence rates of HCC increased significantly by 5.4% per year between 2000 and 2007. However, the rate of increase declined to 2.3% per year between 2007 and 2010 and the trend was no longer statistically significant between 2007 and 2010. Thus, the trend of steeply rising incidence rates of HCC in the US slowed down between 2007 and 2010.5 The stable incidence rates for HCC in Olmsted County since 2010 suggest that the rising incidence rates of HCC in the US may be reaching their peak. These trends in HCC incidence rates will need close monitoring and will require verification in nationwide studies.
Recent trends showing a decreasing proportion of HCV associated HCC in Olmsted County could be a reflection of better management of the causes of chronic liver disease. While the prevalence of HCV infection peaked in the early 2000s and has been decreasing in the US15, 16, an increasing proportion of HCV patients have advanced stage liver disease.17 Therefore, the absolute number of HCV patients who remain at high risk for HCC may have increased. Successful HCV eradication has been shown to be associated with an 81% reduction in the risk of HCC development in HCV patients with advanced fibrosis or cirrhosis.18 Routine use of highly potent directly-acting antiviral agents against HCV, particularly in patients with advanced disease, could have decreased the risk of HCC development among high risk HCV patients in Olmsted County in the more recent era.19, 20 While the burden of HCV-induced HCC appears to be decreasing, the increasing proportion of HBV induced HCCs in the more recent era is notable. Indeed, a recent population based study of the SEER-Medicare linkage database between 2004 and 2009 also showed an increasing trend of HBV associated HCC, with an annual increase of 10 to 11%. Of note, that study may have underestimated the burden of HBV induced HCC as most patients diagnosed with HCC before the age of 65 were not included while HBV infection is associated with earlier onset HCC. Based on the 2010 and 2000 Census, there was 16% increase in the total population of Olmsted County with 10% increase in White, 47% increase in Asian, and 106% increase in Black. Increased representation of Asian and Black in the recent era may have contributed to increasing proportion of HBV as an etiology of HCC. Nonetheless, the recent increasing trend of HBV associated HCC in Olmsted country may be a true reflection of HCC trends in the US and requires further validation in future studies.
NAFLD is now the most common cause of chronic liver disease and the second leading cause of listing for liver transplant in the US.21 The proportion of NAFLD induced HCC in the current study are comparable to the result in the recent population based SEER- Medicare linkage database study where 14% of HCC were attributed to NAFLD.22 However, the results of current study indicated that NAFLD is yet to be the leading etiology of HCC and the proportion of NAFLD as an etiology of HCC has not significantly changed recently in Olmsted County.
The proportion of HCCs detected under surveillance was low. This was in part due to the lack of recognition of cirrhosis before the diagnosis of HCC. A recent VA based study showed that a quarter of HCC patients had unrecognized cirrhosis prior to HCC diagnosis.23 Similar to the finding in the current study, the VA study showed that NAFLD was associated with a 4.8-fold increased risk of having unrecognized cirrhosis. Considering that close to two thirds of NAFLD induced HCC in our cohort had unrecognized cirrhosis at the time of cancer diagnosis, rigorous evaluation for cirrhosis in this group of patients should be considered in clinical practice. As expected, patients with unrecognized cirrhosis were 6.5 times more likely to present with advanced stage HCC. A single center study from a large urban safety-net hospital in the US reported that 39% of patients had unrecognized cirrhosis prior to the diagnosis of HCC.24 Our Olmsted County data substantiate data from other studies and underscore the importance of systematic evaluation and recognition of cirrhosis in high-risk populations as a strategy for increasing the surveillance rate for HCC, which would translate to better outcomes in HCC.
The relative over-representation of White/Non-Hispanic persons in Olmsted County is a major limitation of the current study. Thus our data may not be completely generalizable to the entire United States. This might be particularly relevant considering that the incidence rates and HCC etiologies vary substantially among individuals from different racial and ethnic backgrounds. The relatively small number of HCC cases did not permit detailed subgroup and multivariate analysis to investigate the association between etiology and clinical features of HCC or surveillance practices/failures. In addition, small sample size and limited statistical power could have led to false negative results. In spite of these limitations, the strengths of being able to identify all HCC patients and the complete enumeration of the denominator population provide a unique opportunity to calculate the incidence rates of HCC while fully characterizing demographic and detailed clinical features of individual patients, which is not feasible in other nation-wide population based databases such as SEER.
In conclusion, in comparison to the prior increasing trend in HCC incidence, the incidence rates of HCC in Olmsted County, MN stabilized between 2010 and 2014. The proportion of HBV-induced HCC increased while there was a trend towards a decreasing proportion of HCV-induced HCC, which may in part reflect increasing trend of Non-White population in Olmsted County. More than half of patients presented at an advanced or terminal stage of HCC, resulting in a median overall survival of only 9.7 months. The overall survival in community residents with HCC remains poor due to the low rate of HCC detection under surveillance, which is in part due to a lack of recognition of cirrhosis before HCC diagnosis. Our results suggest that screening the at risk population for chronic liver disease, a high index of suspicion and systematic evaluation for cirrhosis in patients with chronic liver disease, particularly NAFLD, are important interventions to decrease the burden of morbidity and mortality from HCC in the US.
Acknowledgments
We appreciate generous support from American Liver Foundation: 2016 Hans Popper Memorial Postdoctoral Research Fellowship award (to JY)
Fundings: This publication was supported by Grant Number T32 DK07198 from the National Institute of Diabetes and Digestive and Kidney Diseases (NIDDK) (to JY) and CA165076 from the National Cancer Institute (NCI)(to LRR). This study was made possible using the resources of the Rochester Epidemiology Project, which is supported by the National Institute on Aging of the National Institutes of Health under Award Number R01AG034676. Its contents are solely the responsibility of the authors and do not necessarily represent the official views of the NIH.
Footnotes
Conflict of Interest: Nothing to disclose
Author`s contribution:
Contributed to study design, acquisition of data, analysis, interpretation of data, and drafting of the manuscript: Ju Dong Yang
Contributed to acquisition of data, interpretation of data, and critical revision of the manuscript: Hager F Ahmed Mohammed
Contributed to analysis, interpretation of data, and critical revision of the manuscript: William S. Harmsen; Felicity Enders
Contributed to study concept, design, interpretation of data, and critical revision of the manuscript: Gregory J Gores; Lewis R Roberts
References
- 1.Njei B, Rotman Y, Ditah I, et al. Emerging trends in hepatocellular carcinoma incidence and mortality. Hepatology. 2015;61:191–199. doi: 10.1002/hep.27388. [DOI] [PMC free article] [PubMed] [Google Scholar]
- 2.Yang JD, Roberts LR. Hepatocellular carcinoma: A global view. Nature reviews. Gastroenterology & hepatology. 2010;7:448–458. doi: 10.1038/nrgastro.2010.100. [DOI] [PMC free article] [PubMed] [Google Scholar]
- 3.El-Serag HB. Epidemiology of viral hepatitis and hepatocellular carcinoma. Gastroenterology. 2012;142:1264–1273. e1. doi: 10.1053/j.gastro.2011.12.061. [DOI] [PMC free article] [PubMed] [Google Scholar]
- 4.Yang JD, Kim B, Sanderson SO, et al. Hepatocellular carcinoma in olmsted county, Minnesota, 1976–2008. Mayo Clinic proceedings. 2012;87:9–16. doi: 10.1016/j.mayocp.2011.07.001. [DOI] [PMC free article] [PubMed] [Google Scholar]
- 5.Altekruse SF, Henley SJ, Cucinelli JE, et al. Changing hepatocellular carcinoma incidence and liver cancer mortality rates in the United States. The American journal of gastroenterology. 2014;109:542–553. doi: 10.1038/ajg.2014.11. [DOI] [PMC free article] [PubMed] [Google Scholar]
- 6.Yang JD, Harmsen WS, Slettedahl SW, et al. Factors that affect risk for hepatocellular carcinoma and effects of surveillance. Clinical gastroenterology and hepatology : the official clinical practice journal of the American Gastroenterological Association. 2011;9:617–623. e1. doi: 10.1016/j.cgh.2011.03.027. [DOI] [PubMed] [Google Scholar]
- 7.Welzel TM, Graubard BI, Quraishi S, et al. Population-attributable fractions of risk factors for hepatocellular carcinoma in the United States. The American journal of gastroenterology. 2013;108:1314–1321. doi: 10.1038/ajg.2013.160. [DOI] [PMC free article] [PubMed] [Google Scholar]
- 8.El-Serag HB, Kramer JR, Chen GJ, et al. Effectiveness of AFP and ultrasound tests on hepatocellular carcinoma mortality in HCV-infected patients in the USA. Gut. 2011;60:992–997. doi: 10.1136/gut.2010.230508. [DOI] [PubMed] [Google Scholar]
- 9.El-Serag HB, Alsarraj A, Richardson P, et al. Hepatocellular carcinoma screening practices in the Department of Veterans Affairs: findings from a national facility survey. Digestive diseases and sciences. 2013;58:3117–3126. doi: 10.1007/s10620-013-2794-7. [DOI] [PMC free article] [PubMed] [Google Scholar]
- 10.Melton LJ., 3rd History of the Rochester Epidemiology Project. Mayo Clinic proceedings. 1996;71:266–274. doi: 10.4065/71.3.266. [DOI] [PubMed] [Google Scholar]
- 11.Bruix J, Sherman M. Management of hepatocellular carcinoma: an update. Hepatology. 2011;53:1020–1022. doi: 10.1002/hep.24199. [DOI] [PMC free article] [PubMed] [Google Scholar]
- 12.Donato F, Tagger A, Gelatti U, et al. Alcohol and hepatocellular carcinoma: the effect of lifetime intake and hepatitis virus infections in men and women. American journal of epidemiology. 2002;155:323–331. doi: 10.1093/aje/155.4.323. [DOI] [PubMed] [Google Scholar]
- 13.Adams LA, Lymp JF, St Sauver J, et al. The natural history of nonalcoholic fatty liver disease: a population-based cohort study. Gastroenterology. 2005;129:113–121. doi: 10.1053/j.gastro.2005.04.014. [DOI] [PubMed] [Google Scholar]
- 14.Grundy SM, Cleeman JI, Daniels SR, et al. Diagnosis and management of the metabolic syndrome: an American Heart Association/National Heart, Lung, and Blood Institute Scientific Statement. Circulation. 2005;112:2735–2752. doi: 10.1161/CIRCULATIONAHA.105.169404. [DOI] [PubMed] [Google Scholar]
- 15.Davis GL, Alter MJ, El-Serag H, et al. Aging of hepatitis C virus (HCV)-infected persons in the United States: a multiple cohort model of HCV prevalence and disease progression. Gastroenterology. 2010;138:513–521. 521 e1–521 e6. doi: 10.1053/j.gastro.2009.09.067. [DOI] [PubMed] [Google Scholar]
- 16.Denniston MM, Jiles RB, Drobeniuc J, et al. Chronic hepatitis C virus infection in the United States, National Health and Nutrition Examination Survey 2003 to 2010. Annals of internal medicine. 2014;160:293–300. doi: 10.7326/M13-1133. [DOI] [PMC free article] [PubMed] [Google Scholar]
- 17.Udompap P, Mannalithara A, Heo N, et al. Increasing Prevalence of Cirrhosis among US Adults Aware or Unaware of their Chronic Hepatitis C Virus Infection. Journal of hepatology. 2016 doi: 10.1016/j.jhep.2016.01.009. [DOI] [PMC free article] [PubMed] [Google Scholar]
- 18.van der Meer AJ, Veldt BJ, Feld JJ, et al. Association between sustained virological response and all-cause mortality among patients with chronic hepatitis C and advanced hepatic fibrosis. JAMA. 2012;308:2584–2593. doi: 10.1001/jama.2012.144878. [DOI] [PubMed] [Google Scholar]
- 19.Hsu YC, Wu CY, Lin JT. Hepatitis C virus infection, antiviral therapy, and risk of hepatocellular carcinoma. Seminars in oncology. 2015;42:329–338. doi: 10.1053/j.seminoncol.2014.12.023. [DOI] [PubMed] [Google Scholar]
- 20.Hosaka T, Suzuki F, Kobayashi M, et al. Long-term entecavir treatment reduces hepatocellular carcinoma incidence in patients with hepatitis B virus infection. Hepatology. 2013;58:98–107. doi: 10.1002/hep.26180. [DOI] [PubMed] [Google Scholar]
- 21.Wong RJ, Aguilar M, Cheung R, et al. Nonalcoholic steatohepatitis is the second leading etiology of liver disease among adults awaiting liver transplantation in the United States. Gastroenterology. 2015;148:547–555. doi: 10.1053/j.gastro.2014.11.039. [DOI] [PubMed] [Google Scholar]
- 22.Younossi ZM, Otgonsuren M, Henry L, et al. Association of nonalcoholic fatty liver disease (NAFLD) with hepatocellular carcinoma (HCC) in the United States from 2004 to 2009. Hepatology. 2015;62:1723–1730. doi: 10.1002/hep.28123. [DOI] [PubMed] [Google Scholar]
- 23.Walker M, El-Serag HB, Sada Y, et al. Cirrhosis is under-recognised in patients subsequently diagnosed with hepatocellular cancer. Alimentary pharmacology & therapeutics. 2016;43:621–630. doi: 10.1111/apt.13505. [DOI] [PMC free article] [PubMed] [Google Scholar]
- 24.Singal AG, Yopp AC, Gupta S, et al. Failure rates in the hepatocellular carcinoma surveillance process. Cancer prevention research. 2012;5:1124–1130. doi: 10.1158/1940-6207.CAPR-12-0046. [DOI] [PMC free article] [PubMed] [Google Scholar]