Abstract
Body size is a key trait in diversification among animal species, and revealing the gene regions responsible for body size diversification among populations or related species is important in evolutionary biology. We explored the genomic regions associated with body size differences in Carabus japonicus ground beetle populations by quantitative trait locus (QTL) mapping of F2 hybrids from differently sized parents from two populations using restriction site-associated DNA sequencing and de novo assembly of the beetle whole genome. The assembled genome had a total length of 191 Mb with a scaffold N50 of 0.73 Mb; 14,929 protein-coding genes were predicted. Three QTLs on different linkage groups had major effects on the overall size, which is composed chiefly of elytral length. In addition, we found QTLs on autosomal and X chromosomal linkage groups that affected head length and width, thoracic width, and elytral width. We determined the gene loci potentially related to control of body size in scaffolds of the genome sequence, which contained the QTL regions. The genetic basis of body size variation based on a small number of major loci would promote differentiation in body size in response to selection pressures related to variations in environmental conditions and inter-specific interactions.
Introduction
Body size, a key trait for all organisms, affects various aspects of survival and reproduction of individuals in their interactions with their physical and biological environments. In animals, divergence of body size among related populations is often related to adaptation to differing environmental conditions1 and/or mitigation of interactions with other species through resource competition and/or reproductive interference2–4. Revealing the genetic basis for body size differences between closely related populations is important in understanding the adaptive divergence of populations, which may ultimately result in speciation.
Genes involved in the control of animal body size have been examined in various mammals and insects5, 6. Several pathways have been investigated in Drosophila melanogaster, including the insulin signalling pathway, which contributes to the regulation of growth rates and body size in response to environmental cues, such as the presence of nutrients6. For example, overexpression of an insulin-like peptide during development can increase body size7. Mutations in genes involved in insulin signalling and other developmental pathways regulating larval growth8 may also be involved in the evolution of overall body size in insects. However, the genetic basis for body size differences among populations or closely related species remains largely unknown. Although several genetic loci or markers in Drosophila show strong associations with geographic variation in body size9–14, the relationships between genes or alleles and the regulation of body size that affect body size evolution remain unclear6.
Here, we explored the genetic basis for inter-population body size differences in the carabid ground beetle Carabus (Ohomopterus) japonicus (Fig. 1a). The subgenus Ohomopterus, which is endemic to the Japanese islands, shows marked variation in body size (body length) within and among species15, 16. Notably, two or three species with different body sizes co-occur in a large region of the subgenus’ range; the size differences are the main contributors to the avoidance of hybridisation4. C. japonicus is sympatric with one or two larger species existing within the majority of its range16; however, it exhibits larger bodies in several solitary islands, consistent with the pattern of character release17. Such inter-population divergence might be an initial step in speciation via recurrent secondary contacts between populations of differently sized individuals.
Figure 1.
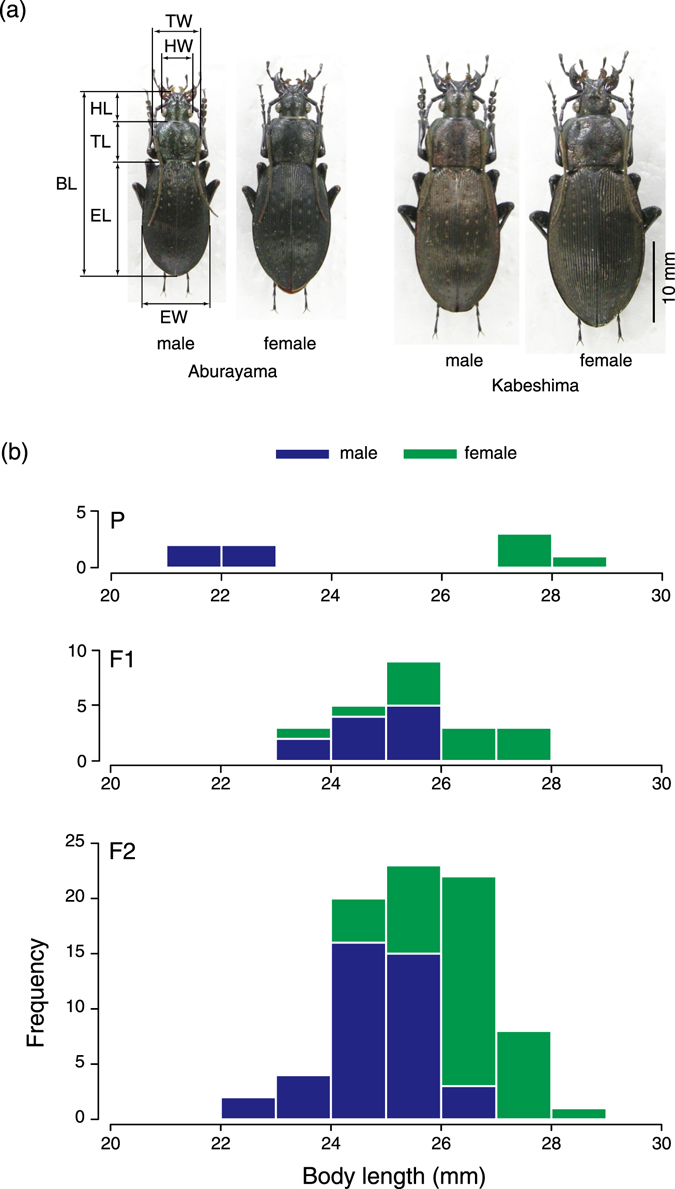
The body lengths of adult P, F1, and F2 Carabus japonicus beetles. (a) Males and females from Mt. Aburayama and Kabeshima Island were used in the present study. Measurements of body dimensions are shown. BL, body length; HW, head width; HL, head length; TW, thoracic width; TL, thoracic length; EW, elytral width; EL, elytral length. (b) BLs of parents and F1 and F2 individuals in the crossing experiment.
In this study, we used a traditional approach of accessing the loci responsible for quantitative traits (i.e., QTL mapping) combined with whole genome sequencing and gene prediction to determine the genomic region and gene loci responsible for inter-population body size differences. First, we assembled the genomic sequence of C. japonicus and predicted protein-coding genes on the scaffolds. Second, we obtained F2 individuals by crossing females and males from populations with large and small bodies and measured their body size dimensions. Then, we obtained a large number of restriction site-associated DNA (RAD) sequences for F2 individuals to construct linkage maps and to perform QTL mapping. The locations of QTLs for body size on the linkage maps were estimated from the correlations between the phenotypic values of a body dimension and genotypes among F2 individuals. Finally, we searched for protein-coding genes potentially related to the body size differences by exploring the scaffolds of the C. japonicus genomic sequence containing QTLs for body size with reference to the known functions of annotated genes.
Results
By experimental crossings, we obtained 40 male and 40 female F2 adults (Fig. 1b). Although the initial first instar weight (BW1) and total development time from larval hatching to adult eclosion (TDT) showed no difference between the sexes (BW1, F 1,75 = 0.073, P = 0.7879; TDT, F 1,77 = 2.327, P = 0.1312), the growth rate in terms of increasing body weight during the immature stages was larger in females than in males (F 1,74 = 7.875, P = 0.0064), leading to larger body sizes in females. Excluding the effect of sex, the geometric mean of all adult body dimensions (GM) was positively related to the initial larval body weight (proxy of egg size), developmental time from oviposition to adult emergence, and growth rate (Fig. 2; Table 1). Of these three variables, growth rate had the largest effect, while the remaining two variables had comparable effects. Overall body length (BL; Fig. 1a) was closely correlated with GM (r = 0.962, P < 0.0001) and showed almost identical responses to the four variables (results not shown). Because of the sexual dimorphism in body dimensions, we used sex-adjusted dimensions in the QTL analyses. Hereafter, symbols for individual body dimensions (HL, HW, TL, TW, EL and EW; Fig. 1a) and overall body size dimensions (GM and BL) are used for log10 transformed, sex-adjusted values. All of these variables were significantly correlated with each other except for two cases (Fig. 3).
Figure 2.
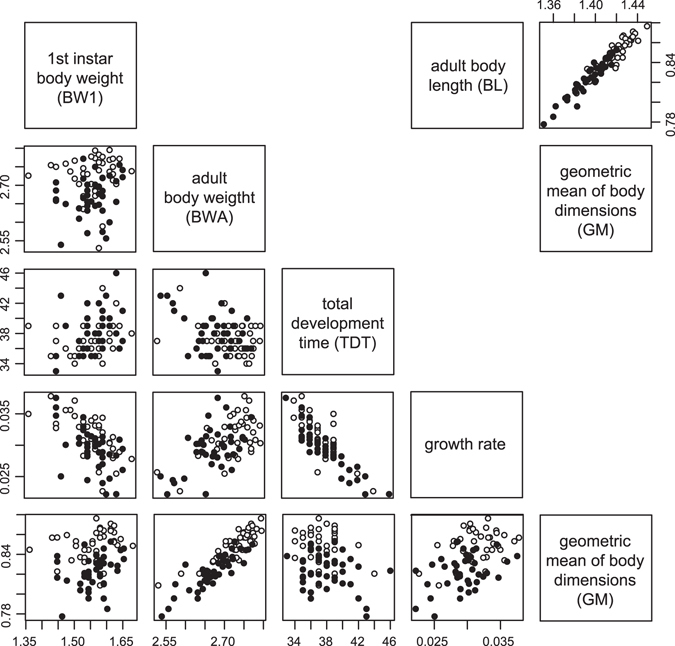
Correlations between developmental trait values and body size dimensions. Open and closed circles indicate male and female individuals, respectively. BW1, BWA and BL are log10 transformed values, and GM (geometric mean of all body dimensions) was calculated as the arithmetic mean of all log10 transformed body dimensions except BL.
Table 1.
Effects of sex, developmental time (DT), larval weight at hatching, and growth rate on the geometric mean of all adult body dimensions (GM; log10 transformed).
| Variable | Effect | SE | df | t | P |
|---|---|---|---|---|---|
| Sex [female-male] | 0.419 | 0.063 | 1,70.11 | 6.67 | <0.0001 |
| Initial larval weight (BW1) | 0.613 | 0.072 | 1,70.25 | 8.49 | <0.0001 |
| Development time (TDT) | 0.187 | 0.069 | 1,70.11 | 2.73 | 0.0080 |
| Growth rate | 0.824 | 0.088 | 1,70.17 | 9.37 | <0.0001 |
All variables (other than sex) were standardised. Family was incorporated as a random variable.
Figure 3.
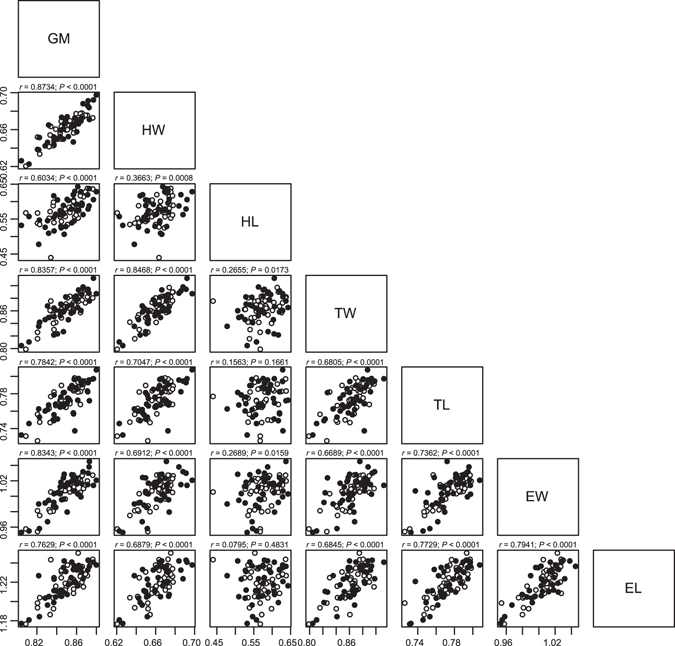
Correlations between body size dimensions. The values in millimetres were log10 transformed and adjusted for sex differences. Open and closed circles indicate male and female individuals, respectively. Pearson correlation coefficients (r) and P values are given in the panels. The body dimensions are described in the legend of Fig. 1.
Sequence assembly resulted in the construction of 76,540 scaffolds with an N50 of 734,069 bp (max. 6,537,065) and total length of 191,032,029 bp (N, 8%; GC, 35.0%). A total of 14,929 protein-coding genes were predicted; of these, 10,624 (71%) were assigned to known genes by a blast search.
We constructed 23 autosomal linkage groups with a total length of 1,029 cM from 319 RAD loci and an X-chromosome linkage group of 91 cM from 56 RAD loci (a total of 1,120 cM with 375 markers; Fig. 4). Based on shared scaffolds, the number of autosomal linkage groups could be reduced to 17, which was still larger than the actual haploid autosome number of 13.
Figure 4.
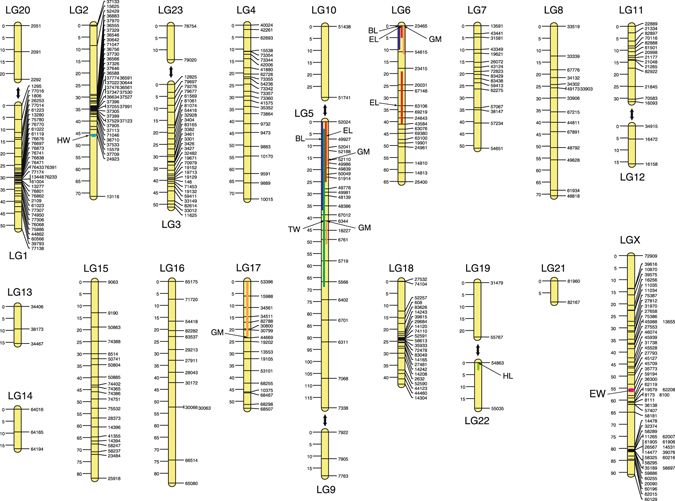
Linkage map of Carabus japonicus showing the locations (peak and range) of the body dimension quantitative trait loci (QTLs). Two-way arrows connect linkage groups probably located on the same chromosomes.
Among the autosomal linkage groups, we found two QTLs of large effect for body length (BL) and geometric mean of all body dimensions (GM) on LG5 and LG6 (R 2 = 0.26–0.35; Figs 4 and 5; Table 2). Of the components of BL, elytral length (EL), which comprises 63.1% of BL on average, had two QTLs corresponding to those of BL on LG5 and LG6 and an additional QTL on LG6; these QTLs had large effects (R 2 = 0.36−0.44). In addition, a QTL for GM occurred on LG17 (R 2 = 0.43) and was related to peaks of other dimensions, which were not significant. We found one QTL for head width (HW) on LG2, one QTL for head length (HL) on LG22, and one QTL for thoracic width (TW) on LG5, but no QTL for thoracic length (TL). All QTLs, except that for HW, exhibited large dominance effects (Table 2). The X chromosome contained a QTL for elytral width (EW), but it had a relatively low logarithm of odds (LOD) score (Table 2; Fig. 5).
Figure 5.
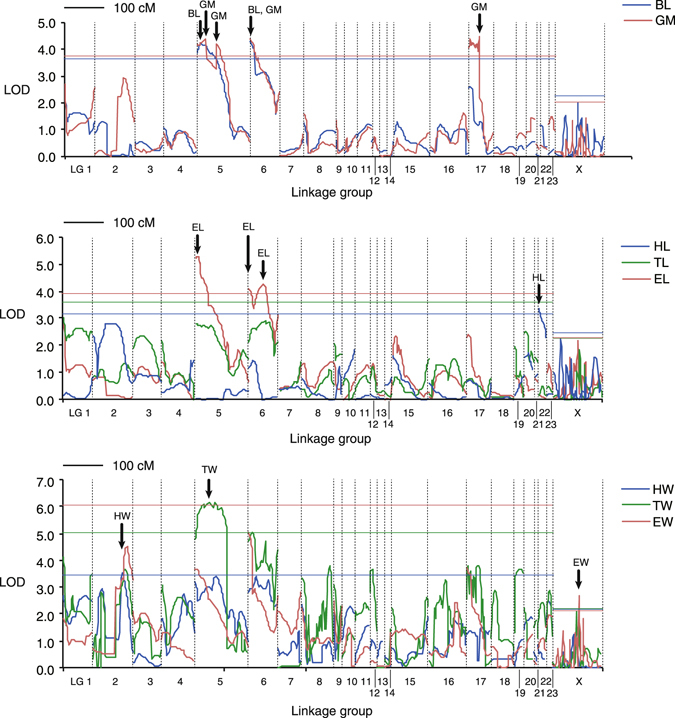
LOD scores for QTLs of body dimensions in the composite interval mapping analysis. Horizontal lines indicate threshold LOD values at α = 0.05. Arrows indicate peaks of LOD score.
Table 2.
Significant QTLs for body size dimensions.
| Trait | LG | Position (cM) | LOD | Effect | R 2 | ||
|---|---|---|---|---|---|---|---|
| Peak | Range | peak value | a | d | |||
| BL | LG5 | 7.3 | 0.0–37.1 | 4.283 | 0.0111 | 0.0216 | 0.2862 |
| BL | LG6 | 0.0 | 0.0–10.0 | 4.299 | 0.0103 | 0.0191 | 0.3514 |
| GM | LG5 | 16.6 | 0.0–18.3 | 4.390 | 0.0187 | 0.0212 | 0.2733 |
| GM | LG5 | 41.3 | 41.3–51.1 | 4.216 | 0.0216 | 0.0199 | 0.2620 |
| GM | LG6 | 0.0 | 0.0–11.9 | 4.377 | 0.0187 | 0.0208 | 0.3546 |
| GM | LG17 | .23.2 | 0.0–23.2 | 4.466 | -0.0226 | 0.0176 | 0.4304 |
| HL | LG22 | 0.0 | 0.0–3.0 | 3.350 | 0.0437 | 0.0246 | 0.3355 |
| HW | LG2 | 45.8 | 45.5–46.8 | 3.567 | -0.0291 | 0.0049 | 0.4790 |
| TW | LG5 | 45.3 | 3.0–68.7 | 6.056 | 0.0297 | 0.0345 | 0.3078 |
| EL | LG5 | 6.0 | 0.0–25.1 | 5.295 | 0.0098 | 0.0261 | 0.4397 |
| EL | LG6 | 0.0 | 0.0–5.0 | 4.119 | 0.0125 | 0.0256 | 0.4101 |
| EL | LG6 | 33.5 | 19.8–41.1 | 4.274 | 0.0079 | 0.0341 | 0.3606 |
| EW | LGX | 55.6 | 55.5–56.6 | 2.655 | -0.0118 | — | 0.2373 |
Trait: body size dimensions, which were log10-transformed and sex-adjusted.
LG: linkage group.
Effect: a, additive; d, dominance. R 2, proportion of variance explained.
From 2,304 gene loci involved in 24 scaffolds with body size QTLs, we obtained 1,566 RefSeq protein IDs and determined 110 candidate genes by referring to the gene ontology terms (Table 3; see also Table S3, Supplementary Information, for details of all candidate genes found in the scaffolds with QTL regions). In the two linkage groups (LG5, LG6) with major QTLs, LG5 contained Wnt/wingless genes and several other genes related to the regulation of cell proliferation, cell size, and wing size; namely, the vein locus existed near the peak position of the QTL for BL/EL, and the ribosomal protein L8, E2F transcription factor 1 and topoisomerase 1 loci occurred around the peak position of the QTL for GM (Fig. 6a; Table S3, Supplementary Information). The beetle elytra correspond to the forewings of flies; therefore, the wingless gene may be related to the regulation of elytral size. The peak position of the QTL for EL is located in the terribly reduced optic lobes (trol) gene region; however, whether this gene is related to the regulation of body size is unknown. The QTL region for HW/GM on LG5 (not shown in Fig. 6a) contained the CG11940 (pico), humpty dumpty, CG4207 (bonsai) and Stat92E loci, which are involved in regulation of cell proliferation/size and growth (Table S3, Supplementary Information). For LG6 (Fig. 6b), the composition and order of scaffolds are unclear. Near the QTL for BL/EL/GM on LG6, we found the menin 1 and syntaxin 5 genes, which are involved in regulation of cell proliferation. The QTL region for EL in LG6 contains the pudgy loci; this gene negatively regulates the insulin receptor signalling pathway. Additionally, the decapentaplegic gene, a key morphogen affecting cell proliferation, exists near the EL QTL region. For the QTL for HW on LG2, we found the dumpy and Keren genes, which are involved in regulation of wing size and cell proliferation, respectively (Table S3, Supplementary Information). For the QTL for HL on LG22, we found the Smurf gene, involved in cell size regulation, and the frizzled 2 gene of the Wnt signalling pathway. Also, the CG7467 (osa) gene, which affects the Wnt signalling pathway, was found in the QTL for EW (Table S3, Supplementary Information).
Table 3.
Scaffolds of C. japonicus with body size QTLs.
| Linkage group | Scaffold no. | QTL traits | Length, bp | No. gene loci | No. candidate genes |
|---|---|---|---|---|---|
| LG2 | 226 | HW* | 51101 | 0 | 0 |
| LG2 | 350 | HW | 4247482 | 325 | 12 |
| LG5 | 50 | BL, TW | 1511372 | 122 | 10 |
| LG5 | 51 | BL*, GM, TW, EL* | 1040234 | 68 | 4 |
| LG5 | 52 | BL, GM*, TW, EL | 2524599 | 292 | 17 |
| LG5 | 119 | GM*, TW | 6535796 | 603 | 19 |
| LG5 | 1761 | GM, TW* | 1462 | 6 | 0 |
| LG5 | 69886 | TW | 348051 | 12 | 0 |
| LG6 | 216 | BL*, GM*, EL* | 167963 | 15 | 1 |
| LG6 | 588 | GM | 226143 | 30 | 2 |
| LG6 | 19857 | EL | 4139 | 1 | 0 |
| LG6 | 69888 | EL | 158683 | 8 | 0 |
| LG6 | 69783 | EL* | 236463 | 23 | 0 |
| LG6 | 69899 | EL | 599710 | 51 | 0 |
| LG6 | 224 | EL | 1599484 | 158 | 7 |
| LG6 | 4437 | EL | 11584 | 0 | 0 |
| LG17 | 15 | GM | 341150 | 27 | 0 |
| LG17 | 54 | GM | 1309841 | 101 | 3 |
| LG17 | 2833 | GM* | 75834 | 11 | 0 |
| LG17 | 3109 | GM | 41374 | 5 | 0 |
| LG17 | 3143 | GM | 34205 | 1 | 0 |
| LG22 | 59 | HL* | 3237164 | 265 | 21 |
| LGX | 341 | EW | 799159 | 76 | 5 |
| LGX | 644 | EW | 874966 | 104 | 9 |
| Total | 2577959 | 2304 | 110 |
Asterisks indicate that the LOD peaks of the traits exist on the corresponding scaffolds.
For candidate gene numbers, the numbers accounting for multi-locus genes on the same scaffold are given.
Figure 6.
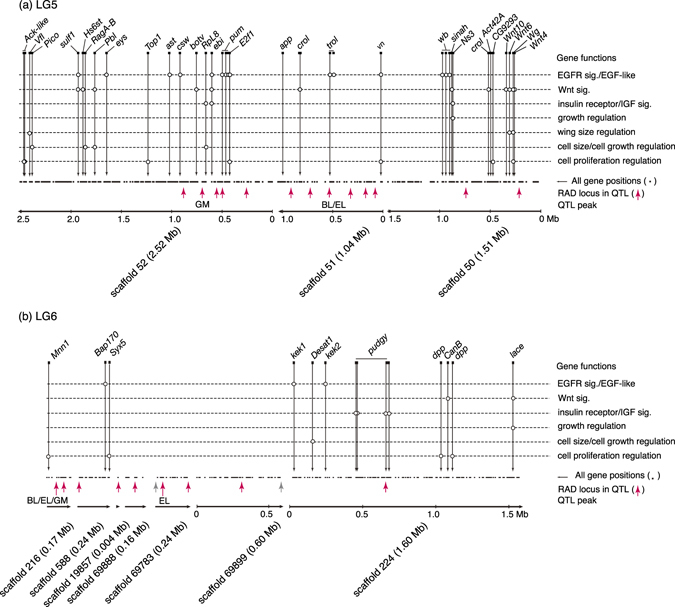
Genes potentially related to body size QTLs on scaffolds of two linkage groups, LG5 (a) and LG6 (b). Red upward asterisks indicate restriction site-associated DNA (RAD) loci with significant QTL LOD scores. Genes shown here are those related to the regulation of cell proliferation, cell size/cell growth, and wing size, and growth; and those involved in or regulating the insulin receptor/insulin-like growth factor signalling pathway, the Wnt signalling pathway, and the epidermal growth factor/epidermal growth factor receptor signalling pathway. Open circles indicate functions known for the gene located at the position. See Table S3 (Supplementary Information) for precise gene names and gene ontology terms.
Discussion
The inferred genome size of C. japonicus is approximately 191 Mb, and the number of predicted genes is ~14,900. This moderate genome size and gene number may render this species suitable for the study of the genomic basis of adaptive traits. However, a disadvantage of this species is its low fecundity, which makes construction of a large F2 population difficult. In this study, the use of multiple parents was necessary to obtain F1 beetles and a total of 80 F2 beetles with a sex ratio of 1:1. The limited number of F2 individuals was a factor reducing the accuracy of the QTL analysis.
Through the hybridisation of differently sized males and females from two populations, we obtained F2 individuals showing large variation in body size (Fig. 1b). Thus, the body size dimensions likely had a polygenic basis. In F2 individuals, larger body sizes were related positively to larger live body weight of first instars and larger growth rate in body weight from the first instar to the emerging adult stage (Fig. 2). Therefore, the larger initial size (egg size) and the larger immature growth rate contributed to the larger adult body size17.
We found that two regions on LG5 and LG6 regulated the overall body size (BL and GM), with relatively large effects. These regions contained QTLs for EL, which occupies a large proportion of BL, and a QTL for TW. There was another QTL for GM on LG17, where we found no QTL for body part dimensions, suggesting that this QTL regulates sizes of body parts in a different way from that of the QTLs on LG5 and LG6. If the body size of C. japonicus is actually controlled by a few gene loci with large phenotypic effects, body size divergence may occur readily in response to different habitat conditions, such as temperature and food resources17.
The pattern of body size QTL distribution is similar to that found in previous QTL studies for D. melanogaster and its allied species, in which a major QTL region for wing and other body sizes was located on chromosome 3 and an additional QTL region was located on chromosome 29, 11, 14. The Drosophila studies focused on latitudinal variations in body size, and adaptive body size divergence between beetles and flies may have a similar genetic basis. In Drosophila species, several genes with allelic differences are associated with latitudinal body size variations. However, the functions of those genes in controlling body size remain undetermined. In this C. japonicus study, determination of responsible genes was difficult due to the low marker density and limited linkage map. The QTL regions may involve some degree of sequence differences in several regulatory genes that affect cell proliferation, cell size, or growth rate. Future studies are required to detect the sequence differences in the QTL regions that correspond to body size differences by re-sequencing multiple samples from populations with different body sizes.
Methods
Experimental crossing and body size analysis
We constructed an F2 adult population from four pairs of large females from Kabeshima Island, Saga (33°32′55″N, 129°52′56″E, 30 m a.s.l.), and small males from Mt. Aburayama, Fukuoka (33°30′43″N, 130°21′52″E, 580 m a.s.l.; Fig. 1a). By crossing F1 males and females, we obtained 40 adult males and 40 adult females in the F2 generation for linkage map construction and QTL analysis (Fig. 1b). The rearing methods were identical to those described by Okuzaki et al.17.
We measured the body weights of the first, second, and third instar and adult individuals just after hatching/eclosion. We also measured the duration of the various developmental stages to analyse the variations in growth and development patterns in F2 individuals. Using log10 transformed values for the initial first instar weight (BW1) and adult body weight at eclosion (BWA), and the total development time from hatching to adult eclosion (TDT; not log10 transformed), we calculated the larval growth rate as (BWA–BW1)/TDT. Approximately 1 month after adult emergence, F2 beetles were fixed in ethanol. We measured six body dimensions (Fig. 1a; Table S1, Supplementary Information) using a digital calliper (Mitsutoyo, Japan): the BL, from the apex of the labrum to the apex of the elytra; the HW, represented by the distance between the outer margins of the eyes; the TW, the maximum width of the thorax; the TL, the length of the thorax; the EW, the maximum width of the elytra; and the EL, from the base to the tip of the right elytra. HL was determined as BL–TL–EL. All body size dimensions were log10 transformed. Although BL is the most straightforward measurement for overall body size and has been used in previous studies of Carabus beetles4, 15, 16, we also used log10 transformed value of the geometric mean of all body dimensions except BL18–20. The logged geometric mean is effectively the arithmetic mean of log10 transformed dimensions and is denoted simply by GM in this paper. Consistent with sexual dimorphism in body size, the females were generally larger than males. Therefore, male body dimensions were adjusted so that their means were equal to the means of females.
RAD sequences
Using the Genomic DNA Purification Kit (Promega) or DNeasy Kit (Qiagen), total DNA was extracted from the gonads and muscle tissues of the parents and F2 adults preserved in ethanol. The library for RAD sequencing was constructed as described by Etter et al.21. The extracted DNA was adjusted to 25 ng/μl, and a 12-μl aliquot was digested with the endonuclease PstI; the digested fragments were ligated with P1 adaptors containing a 5-bp barcode sequence. Subsequent library construction procedures and 100-bp single-end sequencing with Illumina HiSeq. 2000 were conducted by Hokkaido System Science Co. Ltd. (Sapporo, Japan). The RAD sequences obtained and their accession numbers in the DNA Data Bank of Japan are listed in Table S2 (Supplementary Information).
Genome sequencing and gene prediction
Total DNA was extracted from the testes of two males from Kabeshima Island. A paired-end library with 170-bp insertion (j-1–170) and two mate-pair libraries with 2,000-bp and 5,000-bp insertions (j-1-2K, j-2-5K) were constructed and sequenced using one lane of a HiSeq. 4000 sequencer (Illumina). We obtained 297 M clean reads for j-1-170 (Q20, 98.6%), 117 M reads for j-1-2K (Q20, 98.3%) and 110 M reads for j-2-5K (Q20, 98.0%). The raw reads were deposited at the DNA Data Bank of Japan (DDBJ DRA; BioProject, PRJDB5403; DRR089090-089092). The sequences were assembled using Platanus version 1.2.122. We annotated the assembled scaffolds by combining evidence from multiple gene prediction procedures. Ab-initio gene prediction was conducted with Augustus version 3.123 and GeneMark-ES version 4.3224. Augustus was run with parameters trained using Tribolium castaneum, which is the closest available genome. A self-training procedure implemented in GeneMark-ES was used to optimise the parameters for prediction. In addition to the ab-initio predictions, the coding sequences (CDS) of 15,607 genes predicted in the Carabus uenoi draft genome (T. Fujisawa et al., unpublished) were aligned to the scaffolds using Exonerate25 (Slater & Birney 2005) with a percentage similarity of 80%. The evidence from ab-initio prediction and CDS alignment was combined by EVidenceModeler26, with evidence weights of 5 for CDS alignment and 1 for ab-initio prediction. The translated sequences of the predicted gene set were searched against the RefSeq protein database and its D. melanogaster subset using BLASTp (BLAST + ver. 2.2.30)27 to obtain orthological information.
Linkage map construction
We used the genome sequence of C. japonicus to determine the RAD loci segregating between parents and genotyping of F2 individuals for the orthologous loci using the Stacks programme (ver. 1.35)28. The karyotype of the genus Carabus is 2n = 28, with an XY sex chromosome system29. After genotyping, we discriminated loci on the X chromosomes from those on autosomes in males, as the male X chromosome markers would have contained no heterozygote. We constructed autosomal linkage maps and an X chromosomal linkage map separately using the JoinMap® 4.1 programme (Kyazma V.B., Wageningen, The Netherlands). For autosomal chromosomes, we used 1,463 loci and obtained 23 linkage groups with a total length of 1,029 cM from 319 loci at an LOD score of 6. For the X chromosome, we used 171 putative X-chromosome loci from males (haploid) and obtained a linkage map with 56 loci and 90.83 cM in length at an LOD score of 2.
QTL mapping
We conducted composite interval mapping using Windows QTL Cartographer version 2.5_01130 for autosomal loci with male and female data combined (F2 cross) and for the X chromosome with male data only because the linkage map was constructed exclusively from male data. We conducted composite interval mapping31 with a walk speed of 1 cM (using a standard background control method with forward and backward regression, control marker number of 5, and probability of into/out of a 0.1 window size of 10 cM). The LOD threshold values at α = 0.05 were obtained by 1,000 permutations.
Candidate genes
For the predicted genes located in the QTL regions, functional annotations were made using DAVID Bioinformatics Resources 6.832, 33. The RefSeq protein ID for each locus based on Drosophila melanogaster genes was used for input, and three gene ontology terms (biological process, cell component, and molecular function), protein domains (InterPro), and pathway (KEGG) annotations were obtained. D. melanogaster was used as the background genome in the DAVID annotation. We used genes existing in scaffolds with the QTLs of body dimensions. We focused on genes related functionally to the regulation of cell proliferation, cell size, cell growth, wing size, and general growth. In addition, we considered genes involved in pathways related to the regulation of body size and growth, the Wnt signalling pathway, the insulin receptor signalling pathway, the insulin-like growth factor signalling pathway, and the epidermal growth factor/epidermal growth factor receptor signalling pathway6, 8.
Electronic supplementary material
Acknowledgements
Supported by JSPS KAKENHI (nos 26251044, 25128707, 23128507).
Author Contributions
Conception of the study: T.S. and R.K. Experiment and data analysis: R.K., T.S and Y.O. Genome assembly and analyses: T.F. and T.S. Wrote the paper: T.S.
Competing Interests
The authors declare that they have no competing interests.
Footnotes
Electronic supplementary material
Supplementary information accompanies this paper at doi:10.1038/s41598-017-08362-7
Publisher's note: Springer Nature remains neutral with regard to jurisdictional claims in published maps and institutional affiliations.
References
- 1.Blanckenhorn WU, Demont M. Bergmann and converse Bergmann latitudinal clines in arthropods: two ends of a continuum? Integr. Comp. Biol. 2004;44:413–424. doi: 10.1093/icb/44.6.413. [DOI] [PubMed] [Google Scholar]
- 2.Brown WL, Wilson EO. Character displacement. Syst. Biol. 1956;5:49–64. [Google Scholar]
- 3.Hutchinson GE. Homage to Santa Rosalia or why are there so many kinds of animals? Am. Nat. 1959;93:145–159. doi: 10.1086/282070. [DOI] [Google Scholar]
- 4.Okuzaki Y, Takami Y, Sota T. Resource partitioning or reproductive isolation: the ecological role of body size differences among closely related species in sympatry. J. Anim. Ecol. 2010;79:383–392. doi: 10.1111/j.1365-2656.2009.01645.x. [DOI] [PubMed] [Google Scholar]
- 5.Kemper KE, Visscher PM, Goddard ME. Genetic architecture of body size in mammals. Genome Biol. 2012;13:244. doi: 10.1186/gb-2012-13-4-244. [DOI] [PMC free article] [PubMed] [Google Scholar]
- 6.Nijhout, H. F. et al. The developmental control of size in insects. WIREs Devel. Biol., doi: 10.1002/wdev.124 (2013) [DOI] [PMC free article] [PubMed]
- 7.Brogiolo W, et al. An evolutionarily conserved function of the Drosophila insulin receptor and insulin-like peptides in growth control. Curr. Biol. 2001;11:213–221. doi: 10.1016/S0960-9822(01)00068-9. [DOI] [PubMed] [Google Scholar]
- 8.Lavine L, Gotoh H, Brent CS, Dworkin I, Emlen DJ. Exaggerated trait growth in insects. Ann. Rev. Entomol. 2015;60:453–472. doi: 10.1146/annurev-ento-010814-021045. [DOI] [PubMed] [Google Scholar]
- 9.Gockel J, Robinson SJW, Kennington WJ, Goldstein DB, Partridge L. Quantitative genetic analysis of natural variation in body size in Drosophila melanogaster. Heredity. 2002;89:145–153. doi: 10.1038/sj.hdy.6800121. [DOI] [PubMed] [Google Scholar]
- 10.Weeks AR, McKechnie SW, Hoffmann AA. Dissecting adaptive clinal variation: markers, inversions and size/stress associations in Drosophila melanogaster from a central field population. Ecol. Lett. 2002;5:756–763. doi: 10.1046/j.1461-0248.2002.00380.x. [DOI] [Google Scholar]
- 11.Calboli FCF, Kennington WJ, Partridge L. QTL mapping reveals a striking coincidence in the positions of genomic regions associated with adaptive variation in body size in parallel clines of Drosophila melanogaster on different continents. Evolution. 2003;57:2653–2658. doi: 10.1111/j.0014-3820.2003.tb01509.x. [DOI] [PubMed] [Google Scholar]
- 12.Hoffmann AA, Weeks AR. Climatic selection on genes and traits after a 100 year-old invasion: a critical look at the temperate-tropical clines in Drosophila melanogaster from eastern Australia. Genetica. 2007;129:133–147. doi: 10.1007/s10709-006-9010-z. [DOI] [PubMed] [Google Scholar]
- 13.Lee SF, Rako L, Hoffmann AA. Genetic mapping of adaptive wing size variation in Drosophila simulans. Heredity. 2011;107:22–29. doi: 10.1038/hdy.2010.150. [DOI] [PMC free article] [PubMed] [Google Scholar]
- 14.Lee SF, et al. Polymorphism in the neurofibromine gene, Nf1, is associated with antagonistic selection on wing size and development time in Drosophila melanogaster. Mol. Ecol. 2013;22:2716–2725. doi: 10.1111/mec.12301. [DOI] [PMC free article] [PubMed] [Google Scholar]
- 15.Sota T, Nagata N. Diversification in a fluctuating island setting: rapid radiation of Ohomopterus ground beetles in the Japanese islands. Phil. Trans. Roy. Soc. B. 2008;363:3377–3390. doi: 10.1098/rstb.2008.0111. [DOI] [PMC free article] [PubMed] [Google Scholar]
- 16.Sota T, Takami Y, Kubota K, Ujiie M, Ishikawa R. Interspecific body size differentiation in species assemblages of the carabid subgenus Ohomopterus in Japan. Popul. Ecol. 2000;42:279–291. doi: 10.1007/PL00012006. [DOI] [Google Scholar]
- 17.Okuzaki Y, Sugawara H, Sota T. Body size evolution under character release in the ground beetle Carabus japonicus. J Biogeogr. 2015;42:2145–2158. doi: 10.1111/jbi.12575. [DOI] [Google Scholar]
- 18.Jungers WL, Falsetti AB, Wall CE. Size, relative size, and size-adjustments in morphometrics. Yearb. Phys. Anthropol. 1995;38:137–161. doi: 10.1002/ajpa.1330380608. [DOI] [Google Scholar]
- 19.Komuma J, Sota T, Chiba S. Quantitative genetic analysis of subspecific differences in body shape in the snail-feeding carabid beetle Damaster blaptoides. Heredity. 2013;110:86–93. doi: 10.1038/hdy.2012.68. [DOI] [PMC free article] [PubMed] [Google Scholar]
- 20.Komuma J, Yamamoto S, Sota T. Morphological integration and pleiotropy in the adaptive body shape of the snail-feeding carabid beetle Damaster blaptoides. Mol. Ecol. 2014;23:5843–5854. doi: 10.1111/mec.12976. [DOI] [PubMed] [Google Scholar]
- 21.Etter, P. D., Bassham, S., Hohenlohe, P.A., Johnson, E. A., Cresko, W. A. SNP discovery and genotyping for evolutionary genetics using RAD sequencing. Pp. 157–178. In: Orgogozo, V. & Rockman, M.V. (eds) Molecular Methods for Evolutionary Genetics (Humana Press, New York, 2011). [DOI] [PMC free article] [PubMed]
- 22.Kajitani R, et al. Efficient de novo assembly of highly heterozygous genomes from whole-genome shotgun short reads. Genome Res. 2014;24:1384–95. doi: 10.1101/gr.170720.113. [DOI] [PMC free article] [PubMed] [Google Scholar]
- 23.Stanke M, Waack S. Gene prediction with a hidden Markov model and a new intron submodel. Bioinformatics. 2003;19:215–225. doi: 10.1093/bioinformatics/btg1080. [DOI] [PubMed] [Google Scholar]
- 24.Lomsadze A, Ter-Hovhannisyan V, Chernoff YO, Borodovsky M. Gene identification in novel eukaryotic genomes by self-training algorithm. Nuc. Acid Res. 2005;33:6494–6506. doi: 10.1093/nar/gki937. [DOI] [PMC free article] [PubMed] [Google Scholar]
- 25.Slater G, Birney E. Automated generation of heuristics for biological sequence comparison. BMC Bioinformatics. 2005;6:31. doi: 10.1186/1471-2105-6-31. [DOI] [PMC free article] [PubMed] [Google Scholar]
- 26.Haas BJ, et al. Automated eukaryotic gene structure annotation using EVidenceModeler and the program to assemble spliced alignments. Genome Biol. 2008;9:R7. doi: 10.1186/gb-2008-9-1-r7. [DOI] [PMC free article] [PubMed] [Google Scholar]
- 27.Altschul S. Gapped BLAST and PSI-BLAST: a new generation of protein databse search programs. Nuc. Acids Res. 1997;25:3389–3402. doi: 10.1093/nar/25.17.3389. [DOI] [PMC free article] [PubMed] [Google Scholar]
- 28.Catchen J, Hohenlohe P, Bassham S, Amores A, Cresko W. Stacks: an analysis tool set for population genomics. Mol. Ecol. 2013;22:3124–3140. doi: 10.1111/mec.12354. [DOI] [PMC free article] [PubMed] [Google Scholar]
- 29.Serrano, J. & Galian, J. A review of karyotypic evolution and phylogeny of carabid beetles (Coleoptera). In Ball, G.E., Casalle, A. & Taglianti, A.V. (eds) Phylogeny and Classification of Caraboidea (Coleoptera: Adephaga), pp. 191–228. (Museo Regionale di Scienze Naturali, Torino, 1998).
- 30.Wang, S., Basten, C.J., Zeng, Z. B. Windows QTL Cartographer 2.5, Department of Statistics, North Carolina State University, Raleigh, North Carolina. http://statgen.ncsu.edu/qtlcart/WQTLCart.html (2012).
- 31.Silva, L. D. C. E., Wang, S. & Zeng, Z. B. Composite interval mapping and multiple interval mapping: procedures and guidelines for using Windows QTL cartographer. Pp. 75–119. In (ed.) S.A. Rifkin, Quantitative Trait Loci (QTL). Methods and Protocols. Methods in Molecular Biology Vol. 871 (Springer, New York, 2012). [DOI] [PubMed]
- 32.Huang DW, Sherman BT, Lempicki RA. Systematic and integrative analysis of large gene lists using DAVID Bioinformatics Resources. Nature Protoc. 2009;4:44–57. doi: 10.1038/nprot.2008.211. [DOI] [PubMed] [Google Scholar]
- 33.Huang DW, Sherman BT, Lempicki RA. Bioinformatics enrichment tools: paths toward the comprehensive functional analysis of large gene lists. Nucleic Acids Res. 2009;37:1–13. doi: 10.1093/nar/gkn923. [DOI] [PMC free article] [PubMed] [Google Scholar]
Associated Data
This section collects any data citations, data availability statements, or supplementary materials included in this article.


