

Abstract
Metabolite profiling has significantly contributed to a deeper understanding of the biochemical metabolic networks and pathways in cancer cells. Metabolomics-based biomarker discovery would greatly benefit from the ability to interrogate retrospective annotated clinical specimens archived as formalin-fixed, paraffin-embedded (FFPE) material. Mass spectrometry–based metabolomic analysis was performed in matched frozen and FFPE human prostate cancers as well as isogenic prostate cancer cell lines. A total of 352 and 460 metabolites were profiled in human tissues and cell lines, respectively. Classes and physical–chemical characteristics of the metabolites preserved in FFPE material were characterized and related to their preservation or loss following fixation and embedding. Metabolite classes were differentially preserved in archival FFPE tissues, regardless of the age of the block, compared with matched frozen specimen, ranging from maximal preservation of fatty acids (78%) to loss of the majority of peptides and steroids. Generally, FFPE samples showed a decrease of metabolites with functional groups, such as carboxamide. As an adjunct technique, metabolic profiles were also obtained in situ from FFPE tissue sections where metabolites were extracted in a manner that preserves tissue architecture. Despite the fact that selected metabolites were not retained after processing, global metabolic profiles obtained from FFPE can be used to predict biologic states and study biologic pathways. These results pave the way for metabolomics-based biomarker discovery/validation utilizing retrospective and clinically annotated FFPE collections.
Implications
Metabolic profiles can be performed in archival tissue and may be used to complement other profiling methods such as gene expression for biomarker discovery or pathway analysis in the assessment of biologic states.
Introduction
Metabolomics is the study of the metabolite repertoire, resulting from both biosynthetic and catabolic pathways within a biological system, such as a cell (1), tissue (1, 2), or biofluid (3–6), or originating from host-specific microbes as well as from the intake of food nutrients (7) and pharmaceuticals during physiologic or pathologic conditions (8). Metabolomics captures a snapshot of the complex interactions between genetic alterations, enzymatic activity, and metabolic reactions, providing information on whether unique metabolic profiles are driven by specific genetic events (1). Thus, it represents an extraordinary tool to profile tumors and advance personalized medicine.
A bottleneck in the human metabolomics research field is a lack of repositories with a sufficient number of well-annotated frozen samples available for retrospective studies. This limitation could be overcome using formalin-fixed, paraffin-embedded (FFPE) tissue specimens acquired during routine medical care for diagnostic purposes. Tissue from individuals with long-term follow-up is available almost exclusively in retrospective FFPE databases (8). Because of the widespread availability and long-term stability of these samples, accurate profiling of their metabolite content could greatly accelerate the rate of discovery and validation of clinically useful biomarkers.
The technical feasibility and reproducibility of using targeted liquid chromatography (LC) coupled with tandem mass spectrometry (MS) in FFPE samples has been recently examined in a small set of soft-tissue sarcoma samples with promising results (9). Alternative protocols have been proposed in a pilot study on the feasibility of using untargeted gas chromatography (GC) coupled with tandem MS in FFPE material (10). Recently, Fourier transform ion cyclotron resonance (FT-ICR) MS coupled to matrix-assisted laser desorption/ionization (MALDI) has been also utilized for metabolic imaging of tissues, including breast, gastric, renal, and esophageal tumors. However, MALDI-MS imaging has very low metabolome coverage and requires a matrix for co-crystallization with analytes, which interferes in the low mass range (<500 Da). Moreover, the suboptimal resolution of the MALDI instruments (11) could limit the ability to delineate the tumor and normal tissue area in heterogeneous and multifocal tumors such as prostate cancer. These promising albeit incomplete feasibility studies prompted us to perform a controlled, comprehensive analysis of the classes of metabolites detectable in FFPE material. The ultimate goal of this study was to establish MS-based metabolic profiling as a valid technique for retrospective studies using FFPE clinical specimen.
Frozen and FFPE prostate cancer cell lines and human prostate tumor samples were compared to determine the composition of metabolites preserved after fixation and paraffin embedding, using untargeted MS-based metabolomics. Physical and chemical properties of the metabolites obtained from FFPE tissues were investigated and their recovery determined as a function of their physical–chemical characteristics. We also assessed the ability of metabolomics profiling to distinguish metabolic profiles obtained from isogenic hormone-sensitive from those of castration-resistant cell lines as well as normal from tumor human prostate biopsy punches. In addition, metabolites were extracted and profiled directly from FFPE tissue sections on glass slides preserving the tissue architecture. This allows for the subsequent histopathologic evaluation of the tissues after metabolite extraction and identifying metabolites with potentially derived from epithelium and stroma. The results from the current study pave the way for the application of metabolomics in FFPE samples for which thorough clinical annotations and long-term follow-up data are available.
Materials and Methods
Cell line model
LNCaP cells were obtained from ATCC whereas LNCaP-Abl cells were kindly provided by Dr. Brown (Dana-Farber Cancer Institute, Boston, MA; DFCI). Cell lines were authenticated using short tandem repeat analysis [DDC Medical for LNCaP (10/28/2014) and Promega Service for LNCaP-Abl (11/11/2014)]. To prepare frozen samples, adherent cells were directly quenched with 1 mL of 80% methanol in the dish culture to avoid trypsin use, and cells were gently detached using a cell lifter. The methanol solution containing the quenched cells was pipetted into a 2-mL centrifuge tube for extraction. In the case of FFPE samples, the adherent cells were directly quenched with 1 mL of 4% formalin. The formalin solution was kept in the culture dish for 20-minute cross-links at room temperature. Then, the adherent cells were washed 3 times with PBS, detached using a cell lifter, and then embedded in paraffin following the standard procedure. The detailed protocol to produce flash-frozen cell line and FFPE cell line samples is described in Supplementary Information.
Human prostate tissue
Samples from radical prostatectomies were utilized in the study. All samples were collected with informed consent approved by DFCI Institutional Review Board. Both optimal cutting temperature (OCT)-embedded and FFPE tissue blocks were collected from each prostatectomy. Tissue blocks were sectioned at 5 μm and were stained with hematoxylin and eosin (H&E) to identify tumor and normal area in each block. Section of 20 μm were used for the metabolomic analysis and then stained with H&E to evaluate the tissue architecture. Histopathologic evaluation was performed to assess the percentage of tumor and the Gleason score in each tissue samples. From each tissue block, 2-mm biopsy punch samples were collected from both the tumor and normal tissue compartments.
Metabolite extraction with methanol
The metabolome from frozen samples was extracted incubating the tissue in 1 mL of 80% methanol at room temperature on a benchtop for 4 hours. After centrifugation at 14,000 × g (10 minutes), the supernatant was collected and stored at −80 °C. Metabolite extraction from FFPE samples was performed as described by Yuan and colleagues (12). The protocol is briefly described in Supplementary Information.
Metabolite profiling
Metabolite profiling was conducted by the company Metabolon Inc. as previously described by Evans and colleagues (13). Sample preparation, MS analysis, data quality management, and compound identification are described in Supplementary Information.
Pre-processing
Contaminants present in FFPE samples (i.e., DMSO, lauryl sulfate, and melanine) and OCT-embedded samples (i.e., heptaethylene glycol, hexaethylene glycol, octaethylene glycol, pentaethylene glycol, and tetraethylene glycol) were not considered in the analysis. Compounds with more than 90% of missing value were not considered to be reliable and therefore excluded. Probabilistic quotient normalization (14) was used to normalize data due to dilution effects in the extraction procedure.
For multivariate analysis, compounds with more than 25% of missing values were not used. Otherwise, missing metabolite measurements were imputed using k nearest neighbor (kNN) algorithm (15) with k = 5. Data were log-transformed, mean-centered, and scaled to unit variance. The cell line data were centered to the mean of all samples, and human samples were centered to the mean of each patient.
Statistical analysis
The Fisher exact test was used for testing the null hypothesis of independence of rows and columns in a contingency table. Pairwise comparisons were made using the Mann–Whitney test for independent data. Spearman rho was used to correlate each metabolite with the age of the FFPE block. Pearson product moment correlation coefficient (r) was used to correlate metabolites between pair of replicates and metabolic signature with the epithelial tissue percentage. The threshold for significance was P < 0.05 for all tests. To account for multiple testing, a false discovery rate (FDR) of <10% was applied to reduce identification of false-positives. FDRs were calculated using the q conversion algorithm (16) in multiple comparison.
Furthermore, orthogonal signal correction (OSC) applied to the partial least square (PLS) model (17), a supervised pattern recognition approach, was used to visualize differences in metabolite composition in samples and as a predictive model in cross-validation analysis using the values of the orthogonal latent variable.
Metabolite set enrichment analysis (MSEA) was carried out using the tool GSEA (Gene Pattern software, Broad Institute, http://genepattern.broadinstitute.org). The metabolite sets were built using the human pathway information available in the Human Metabolome Database (http://www.hmdb.ca). The loadings of OSC-PLS were used for the ranking in the MSEA.
Heatmaps were ordered according to hierarchical clustering (Ward linkage) on the basis of the KODAMA dissimilarity matrix (18) implemented in R package KODAMA (19). For human FFPE samples of the training set, KODAMA was performed with sample replicates constrained to cluster together. Analyses were carried out using R software (20) with scripts developed in-house.
Non-negative matrix factorization (NMF; refs. 14, 21) was used to deconvolute a KxG matrix of metabolic profiles into a KxN matrix of metabolic signature and an NxG matrix of metabolic presence (where G is the number of samples, K is the number of metabolites, and N is the number of estimated metabolic signatures). The number of possible signatures ranged from 2 to 10, N was chosen using the smallest value of the cophenetic correlation coefficient for which this coefficient starts decreasing (22).
Results
Isogenic prostate cancer cell lines
Metabolite recovery in FFPE samples
To compare metabolomic data generated from frozen and FFPE material, we profiled prostate cancer isogenic hormone-sensitive LNCaP and castration-resistant LNCaP-Abl cell lines using untargeted ultrahigh performance liquid chromatography (UPLC)-MS and GC-MS. Using the protocol schematized in Fig. 1A Both FFPE and frozen cell line samples were generated from replicates of 10-cm culture dishes (48 hours after seeding 5 ×10⁻⁶ cells). A total of 252 metabolites were detected and quantified in both frozen and FFPE samples. An additional 208 metabolites were identified in frozen samples (Fig. 1B). Extraction yield from FFPE samples was estimated to be 12-fold less than frozen samples as determined by comparing intensity values of recovered metabolite signals (Fig. 1C).
Figure 1.
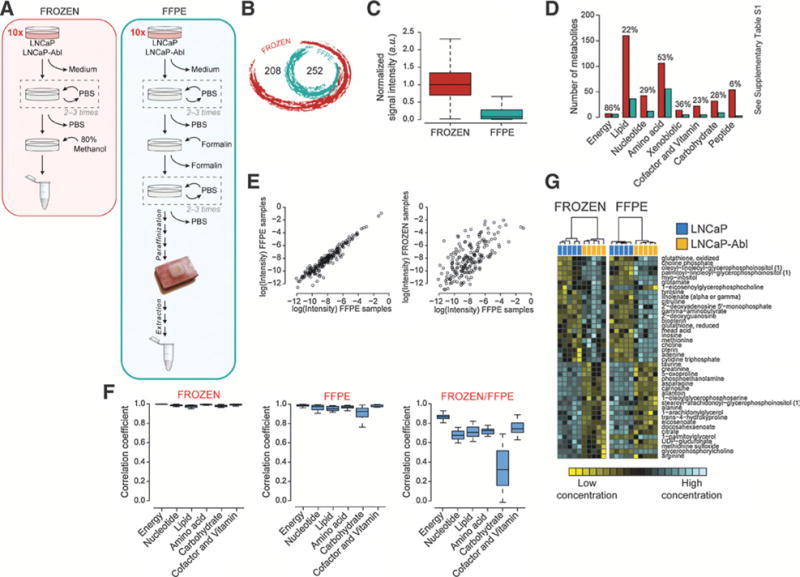
Isogenic cell lines. A, Schematic overview of the protocol used to prepare frozen and FFPE cell samples. The steps are discussed in Supplementary Methods. B, Venn diagram showing the intersection between frozen and FFPE metabolomic data in the experimental settings. C, Box-and-whisker plot representing the relative signal intensity of all shared metabolites found in frozen and FFPE samples. D, Bar plot of the metabolite number found in frozen and FFPE samples. The metabolites are categorized according to the class membership. The percentage above each bar represents the number of detectable metabolites (of each class) found in FFPE compared with frozen samples. E, Correlation plots between FFPE cell replicates and between frozen and FFPE cell samples. F, Box-and-whisker plots of the correlation coefficients, categorized to the class membership, between frozen replicates, FFPE replicates, and frozen and FFPE samples. G, Heatmap of selected metabolites from cell line samples. Hierarchical clustering (Ward method) based on KODAMA dissimilarity matrix is used for unsupervised classification. The phenotypic labels of the samples (i.e., LNCaP and LNCaP-Abl) are indicated as a colored band on top of the heatmap.
Next, we used the metabolite categorization (i.e., superclass, class, subclass, and metabolic pathway), substituents (an atom or group of atoms taking the place of another atom group or occupying a specific position in a molecule), and chemical/physical properties as annotated in the Human Metabolome Database (HMDB, http://www.hmdb.ca/), Small Molecule Pathway Database (SMPDB, http://smpdb.ca), and Kyoto Encyclopedia of Genes and Genomes (KEGG, http://www.genome.jp/kegg) to provide a detailed analysis of the metabolites detectable in FFPE samples. As shown in Fig. 1D, the rate of detection in FFPE samples compared with the corresponding frozen material varied according to the class and the chemical/physical properties of the metabolite. We used Fisher exact test to evaluate the differences in the number of metabolites belonging to a specific category detected or nondetected in FFPE samples. Significant differences are listed in Supplementary Table S1. At the extremes, only 6 peptides of 56 were detected (11%, P = 4.56 × 10⁻¹³; FDR = 3.65 × 10⁻¹²), whereas 114 lipids of 171 analyzed (67%, P = 1.01 × 10⁻⁴; FDR = 4.03 × 10⁻⁴) were preserved in FFPE samples. The majority of fatty acids (93%, P = 4.74 × 10⁻⁶; FDR = 5.93 × 10⁻⁵), including lysophosphatidylethanolamine (94%, P = 4.18 × 10⁻⁴; FDR = 4.73 × 10⁻³), glycerolipids (100%, P = 2.97 × 10⁻³; FDR = 2.47 × 10⁻²), pyrimidine nucleotides (92%, P = 8.24 × 10⁻³; FDR = 5.15 × 10⁻²), and purine nucleotides (85%, P = 4.50 × 10⁻²; FDR = 1.87 × 10⁻¹), were detectable in FFPE samples, whereas monosaccharides (23%, P = 2.11 × 10⁻²; FDR = 1.05 × 10⁻¹), phosphatidylcholines (0%, P = 1.30 × 10⁻³; FDR = 1.11 × 10⁻²), and lysophosphatidylcholines (46%, P = 5.74 × 10⁻¹; FDR = 7.65 × 10⁻¹) were poorly detectable in FFPE samples. FFPE samples showed a decrease of metabolites with characteristic functional groups, such as secondary carboxylic acid amide (28%, P = 7.43 × 10⁻¹²; FDR = 6.42 × 10⁻¹⁰), present in peptides and quaternary ammonium salts (33%, P = 1.01 × 10⁻³; FDR = 2.30 × 10⁻²) present in glycerophosphocholines and absent in glycerophosphoethanolamines. We did not observe any specific depletion of metabolic pathway information. Nonparametric Wilcoxon–Mann–Whitney test was used to evaluate the difference between chemical/physical properties. Interestingly, lipophilic metabolites showed high detectability in FFPE samples (P = 8.09 × 10⁻⁵; FDR = 1.29 × 10⁻³).
Metabolites lost during FFPE procedure
We investigated potential chemical reasons that might affect selectively specific classes of metabolites during the formalin-fixing and paraffin-embedding process (Supplementary Fig. S2). We identified as major factors: (i) solubility in formalin solution, (ii) covalent bonding to cellular component (e.g., protein, DNA/RNA), and (iii) solubility in ethanol and xylene. Using the protocol schematized in Supplementary Fig. S1A, we collected and profiled cell samples immediately after the formalin fixation before the paraffin-embedding procedure and the supernatant solutions of formalin used during the fixation. In Supplementary Fig. S1B, Venn diagrams show metabolomic data collected during the different steps of the procedures and their rate of detection according to the superclass they belong to.
The formalin fixation and paraffin-embedding is a multistep procedure. The first step consists of the immersion of the tissue in the formalin solution. During this step, polar metabolites may dissolve in the formalin solution whereas some metabolites may react with formaldehyde forming covalent bonds with cellular components. After fixation, the tissue is dehydrated via a series of graded ethanols followed by xylenes and finally liquid paraffin. Apolar metabolites could dissolve in ethanol/ xylene solvents.
First, we compared metabolites found in the supernatant (n = 132) with those found in the extracts from frozen samples (n = 437), as described in Supplementary Table S2 to identify those that are soluble in formalin and could, as a result, be lost in the analysis. The majority of these metabolites were classified as amino acids (and derivatives). Specifically, in the supernatant, we detected 53% of all amino acids present in the frozen samples (P = 2.33 × 10⁻⁸; FDR = 1.87 × 10⁻⁷). Analyzing their chemical–physical properties, metabolites soluble in formalin are characterized by lower molecular weight (P = 2.35 × 10⁻²⁴; FDR = 2.10 × 10⁻²³), polarizability (P = 6.86 × 10⁻²³; FDR = 3.66 × 10⁻²²), refractivity (P = 2.58 × 10⁻²⁰; FDR = 2.23 × 10⁻¹⁹), number of rotatable bond (P = 4.80 × 10⁻¹⁷; FDR = 1.54 × 10⁻¹⁶), and a higher solubility (P = 7.81 × 10⁻¹¹; FDR = 1.56 × 10⁻¹⁰).
Second, we identified metabolites that might be lost in FPPE due to their reaction with formaldehyde when tissues are immersed in a formalin solution. Metabolites interacting with formalin could form covalent bonds with cellular components (insoluble or with high molecular weight) and thus be no longer detectable by MS. In Supplementary Table S3, we list the metabolites that were not detected in either formalin solution, nor in the extract from FF samples. Overall, we observed that peptides (78%, P = 2.29 × 10⁻¹⁹; FDR = 1.84 × 10⁻¹⁸) and carbohydrates (47%, P = 4.09 × 10⁻³; FDR = 1.09 × 10⁻²) probably reacted with formaldehyde. In particular, some metabolites with substituents (an atom or group of atoms taking the place of another atom or group or occupying a specific position in a molecule), such as n-substituted-alpha-amino acid (73%, P = 1.87 × 10⁻¹⁵; FDR = 2.88 × 10⁻¹³) and carboxamide group (54%, P = 1.61 × 10⁻¹⁴; FDR = 1.23 × 10⁻¹²), were severely affected by the fixation procedure, whereas other classes of metabolites, such as fatty acid ester (0%, P = 2.33 × 10⁻⁸; FDR = 8.90 × 10⁻⁷) and phosphocholine (0%, P = 1.13 × 10⁻³; FDR = 1.84 × 10⁻²), remained intact.
These results confirm the analysis reported in Supplementary Table S4 for the comparison between the metabolites found in formalin-fixated and frozen extracts where we observed that peptides (22%, P = 9.70 × 10⁻¹⁷; FDR = 4.69 × 10⁻¹⁶) and carbohydrates (53%, P = 1.32 ×10⁻²; FDR = 3.51 × 10⁻²) were poorly detectable after the fixation procedure. Although, we reported that the amino acid concentration could be severely affect when tissues are immersed in an aqueous solution (i.e., formalin), they were still detectable after the fixation procedure.
Finally, we investigated how the paraffin-embedding procedure affects the metabolome. We thus compared metabolites extracted from the samples before and after the paraffin embedding and we observed a global depletion of metabolites in all classes (Supplementary Table S5). In particular, the major depletion was found for membrane lipids, such as glycerophospholipids (60%, P = 4.76 × 10⁻²; FDR = 3.33 × 10⁻¹). In particular some metabolites with substituents, such as quaternary ammonium salt (42%, P = 2.68 × 10⁻⁶; FDR = 6.13 × 10⁻⁴) and phosphocholine (33%, P = 2.35 × 10⁻⁵; FDR = 2.69 × 10⁻³), were severely affected by the paraffin-embedding procedure.
The relative susceptibility of each class of metabolites to each factor described above (solubility in formalin, the covalent bonding to cellular component, and solubility in ethanol and xylene) is summarized in Supplementary Table S6. Taking this into account, we defined a score to rank the reliability of each metabolite on the base of sensitivity to each factors and to highlight the most stable metabolites during the procedure of formalin fixation and paraffin-embedding. To each metabolite was assigned a score to rank the reliability of its concentration value in extract from FFPE samples. This score ranges from 0 to 3, and it is defined as the sum of the 3 parts. Each part is equal to 1 if the metabolite belongs at the least to one of the selected classes listed in Supplementary Table S6, otherwise is counted as 0. The basal set of metabolites, that is unchanged despite tissue processing, is represented by the metabolites ranked with a score equal to 0.
Reproducibility of metabolic data and consistency between FFPE and frozen samples
To evaluate data reproducibility in different biologic replicates, we performed correlation analyses among the shared metabolites in the 5 replicates of each cell culture set. Pairwise correlation coefficients were consistently high for both frozen and FFPE samples indicating a minimal variability among replicates. The correlation coefficients, calculated in FFPE cell line samples (an example in Fig. 1E, left plot), ranged between 0.904 and 0.986 (median value of 0.956), which were slightly lower than those in frozen samples ranging between 0.968 and 0.994 (median value of 0.989).
To confidently expand metabolomic analyses to retrospective studies, metabolic data from FFPE samples need to be consistent with those obtained from frozen material. To test this, we correlated the relative concentration of metabolites between frozen and FFPE samples. The correlation coefficients, calculated in cell line samples, ranged between 0.550 and 0.709 (median value of 0.651; an example is shown in Fig. 1E, right plot).
Finally, we compared the reproducibility in the detection of different metabolite classes between FFPE and frozen samples. We calculated the correlation coefficients for each metabolic class (i.e., energy, nucleotides, lipids, amino acids, carbohydrates, cofactors, and vitamins) between cell lines replicates. The results, shown in Fig. 1F, indicate that data reproducibility is maintained in all analyzed classes in both frozen and FFPE replicates. When we compared the correlation coefficients between frozen and FFPE samples, we observed good correlation for all the classes (median correlation value ranges between 0.676 and 0.867) except for carbohydrates (correlation value of 0.322).
Detecting biologic differences between isogenic prostate cancer cell lines
We next sought to use metabolic profiling to distinguish androgen-dependent LNCaP cells from their isogenic, androgen-independent LNCaP-Abl using both frozen and formalin-fixed samples. To perform a comparative analysis between LNCaP and LNCaP-Abl cells, we considered only the shared metabolites found with less than 25% missing values in both frozen and FFPE samples. From 189 metabolites retained for analysis, we applied the hierarchical clustering on the basis of the KODAMA dissimilarity matrix to show unique metabolic profiles of LNCaP and LNCaP-Abl cells. This unsupervised method was chosen, as it has been previously shown to be very robust even when applied to noisy data, such as those in metabolic profiling (1, 18). Using the 189 shared metabolites between frozen and FFPE samples, we were able to distinguish the 2 cell lines with a high degree of accuracy on the basis of their metabolic profiling, in both fixed and frozen states (Supplementary Fig. S3).
When LNCaP and LNCaP-Abl cells were compared, 108 metabolites in frozen samples and 65 in FFPE samples were found to be significantly different. Forty-two metabolites were significantly different in both frozen and FFPE samples (Fig. 2G). Almost the totality of these were concordant in the directionality of their expression (down- or upregulated). Interestingly, we observed that the levels of some amino acids, such as alanine (Pfrozen = 7.94 × 10⁻³; PFFPE = 7.94 × 10⁻³), asparagine (Pfrozen = 7.94 × 10⁻³; PFFPE = 7.94 × 10⁻³), and glutamate (Pfrozen = 7.94 × 10⁻³; PFFPE = 7.94 × 10⁻³), were significantly decreased in androgen-independent LNCaP-Abl cells. This supports the observation that androgen signaling regulates amino acid metabolism, consistent with previous studies (23, 24). The complete list of metabolites is reported in Supplementary Table S7.
Figure 2.
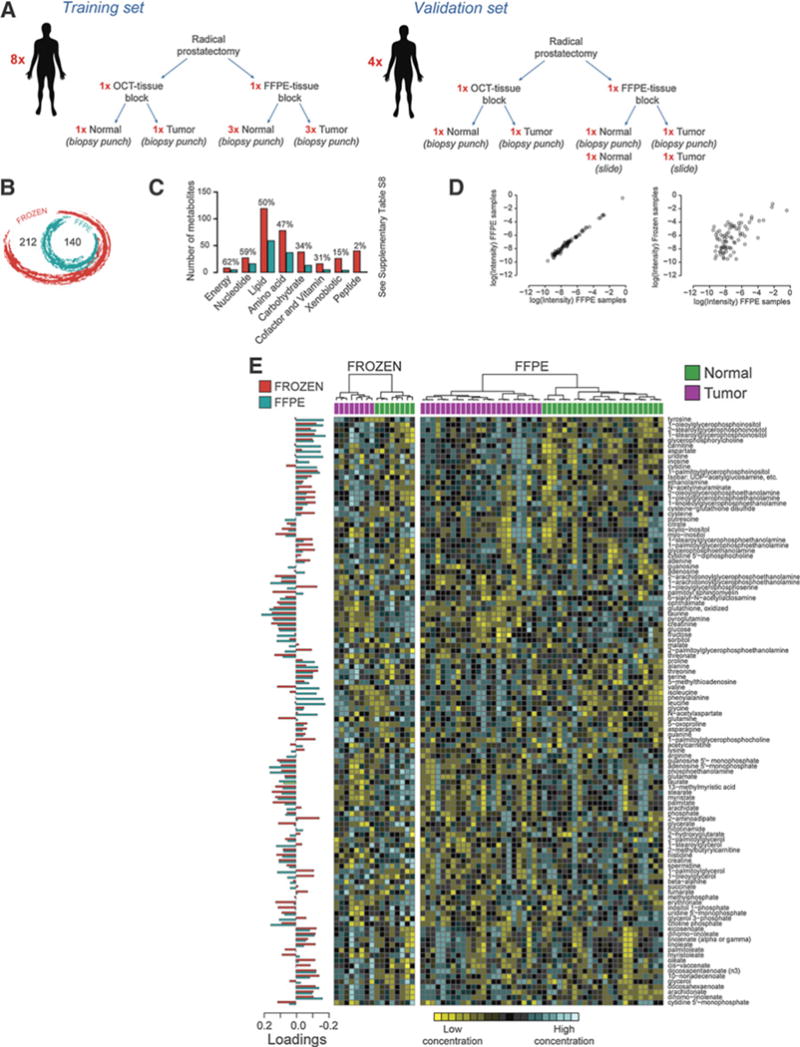
Human prostate. A, Schematic diagram of the human samples used. B, Venn diagram showing the intersection between frozen and FFPE metabolomic data in the experimental settings. C, Bar plot of the metabolite number found in frozen and FFPE samples. The metabolites are categorized according to the class membership. The percentage above each bar represents the number of detectable metabolites (for each class) found in FFPE compared with frozen samples. D, Correlation plots between FFPE cell replicates and between frozen and FFPE cell samples. E, Heatmap of selected metabolites from cell line samples. Hierarchical clustering (Ward method) based on KODAMA dissimilarity matrix is used for unsupervised/semisupervised classification. The phenotypic labels of the samples (i.e., normal and tumor tissue) are indicated as a colored band on top of the heatmap.
Human prostate cancer
Metabolite recovery in FFPE samples
Next, we collected OCT-embedded and FFPE tissue blocks from radical prostatectomy specimens from 12 patients with prostate cancer and compared metabolic profiling obtained from matched frozen and FFPE normal and tumor samples. Samples from 8 patients (training set) were used to confirm the previous characterization of the metabolome on the basis of FFPE material performed on isogenic prostate cancer cell lines and then to define the fingerprint of prostate cancer in FFPE human tissues. Details on tissue and patient features are summarized in Supplementary Table S8. Samples from the other 4 patients were used as an independent set (validation set). A schematic diagram of the sample collection is shown in Fig. 2A. For the training set, we collected 3 samples for each FFPE tissue type and 1 sample for each OCT-embedded tissue type. For the validation set, we collected 1 biopsy punch sample for both FFPE and OCT-embedded tissue.
A total of 352 and 140 metabolites were detected in frozen and FFPE 2-mm biopsy punch samples, respectively (Fig. 2B). Although FFPE tissue blocks were aged between 3 and 7 years, we did not find any statistically significant association between the metabolite concentrations and the age of the FFPE blocks. As shown in Fig. 2C, we confirmed that only some classes of metabolites were preserved in FFPE material in human tissue as well. Again, we used Fisher exact test to evaluate differences between metabolite categories detected or not detected in FFPE samples. Significant differences are listed in Supplementary Table S9. As expected from our cell line experiments, almost all of peptides were not detectable in FFPE samples (3%, P = 1.57 × 10⁻⁸; FDR = 1.25 × 10⁻⁷). Again, we observed a heterogeneous behavior for the lipid class, with metabolites with good detectability such as fatty acids (68%, P = 4.07 × 10⁻³; FDR = 5.29 × 10⁻²) and others like fatty acid esters (19%, P = 7.23 × 10⁻²; FDR = 2.36 × 10⁻¹) and steroids (0%, P = 8.15 ×10⁻²; FDR = 2.36 × 10⁻¹) that were poorly detectable. The presence of specific chemical substituents seems to have a clear importance with regards to the ability to detect of metabolites in FFPE samples as suggested by the inferior levels of lysophosphatidylcholines (36%, P = 1.00; FDR = 1.00) when compared with lysophosphatidylethanolamines (89%, P = 4.01 × 10⁻³; FDR = 3.07 × 10⁻²). Significant differences between frozen and FFPE samples, using both cell and human samples, are listed in Supplementary Table S10.
Akin to the results in cell lines experiments, correlation coefficients between metabolite concentrations from replicates in human FFPE samples ranged between 0.920 and 0.994 (median value of 0.979), whereas those between frozen and FFPE samples from the same patient ranged between 0.471 and 0.698 (median value 0.609), as shown in Fig. 2D.
Detecting differences between human prostate cancer and normal tissue
For distinguishing benign from malignant prostate tissue, we used 112 metabolites shared by frozen and FFPE samples with less than 25% missing values. Hierarchical clustering based on KODAMA dissimilarity matrix distinguished normal and tumor prostate tissues (Fig. 2E) both in OCT-embedded and in FFPE material.
A total of 48 of 112 metabolites were significantly different between normal and tumor tissue in FFPE samples, and 61 of 112 metabolites were significantly different in frozen samples. Thirty-two metabolites were statistically significant in both frozen and FFPE samples (Supplementary Table S11). Among the perturbed metabolites found in both OCT-embedded and FFPE samples, 17 were increased in tumor tissue and 13 were downregulated. Agreement in the direction of metabolite abundance in frozen and FFPE comparisons unequivocally indicates reliability of metabolite detection in FFPE samples. Next, we correlated the coefficient of probabilistic quotient normalization (14) of each sample with the signal intensity of each metabolite before the normalization step (Supplementary Table S12). We identified cytidine 5′-diphosphocholine (r = 0.905, P = 2.77 × 10⁻¹⁸; FDR = 1.55 ×10⁻¹⁶) as a candidate housekeeping metabolite to adopt in orthogonal metabolic profiling when tissue weight cannot be available for normalization as in the case of FFPE material. An example of the ratio of 2 statistically different metabolites between normal and tumor tissue and cytidine 5′-diphosphocholine is reported in Supplementary Fig. S4 and Supplementary Table S13.
Then, we used the OSC-PLS to model the metabolic profile of prostate cancer in frozen and FFPE samples. OSC-PLS is a supervised algorithm that aims to maximize the variance between groups in the latent variable in the output data (i.e., score) and it calculates metabolites’ loadings that measure importance of the variables in the discrimination between 2 groups. The OSC-PLS loadings for the discrimination between normal and tumor tissues are shown in Fig. 2E (on the left of the heatmaps). In this analysis, positive OSC-PLS loadings indicate the metabolites with higher concentration in tumor tissue and vice versa. Both OSC-PLS models built on frozen and FFPE sample data showed similar OSC-PLS loadings values. We observed a high correlation between the values of OSC-PLS loadings of the models built on frozen and FFPE samples (r = 0.57).
Next, we used MSEA to determine metabolic pathways that were significantly altered between prostate tumors and normal tissue. We observed a positive enrichment of α-linoleic acid and linoleic acid metabolism in both frozen and FFPE tumor tissues (P = 0.012 and FDR = 0.064 in frozen tissues and P = 0.050 and FDR = 0.166 in FFPE tissues), whereas the protein synthesis pathway was statistically significant only in FFPE samples (P = 0.009 and FDR = 0.048).
Prediction of prostate cancer fingerprint
FFPE biopsy punch samples
We investigated whether the metabolic profile could be used to discriminate tumor versus normal tissue using an OSC-PLS model. The OSC-PLS scores plots of the training set samples are shown in Fig. 3A for both OCT-embedded and FFPE samples. We thus performed a modified leave-one-out cross-validation to evaluate the accuracy of the discrimination between tumor and normal tissue in the training set. A schematic diagram of the cross-validation procedure is provided in Supplementary Fig. S5. The cross-validated accuracy was 100.0% and 75% for OCT-embedded and FFPE samples, respectively. When the average of the predicted values of each replicate in FFPE samples was used to classify the tissue type, the accuracy increased to 87.5%.
Figure 3.
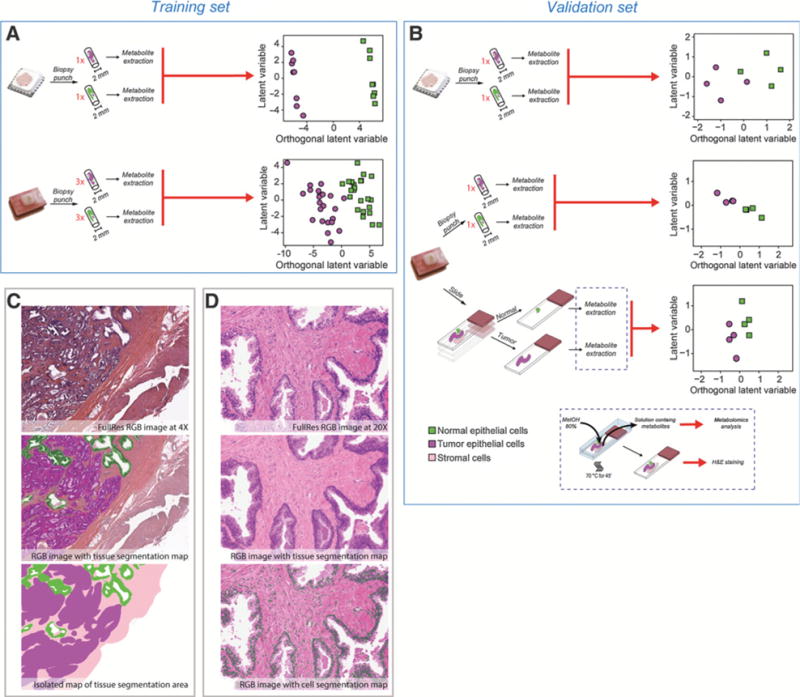
Prostate cancer fingerprint. A, Schematic overview of the samples analyzed in the training set. On the right side, OSC-PLS scores plot of the FFPE biopsy punches of the training set. B, Schematic overview of the samples analyzed in the validation set (i.e., FFPE biopsy punches and section). On the right side, OSC-PLS projection scores plot of the FFPE samples of the validation set. C, Tissue images for tissue segmentation analysis. D, Tissue images for tissue segmentation analysis.
For the validation set, we collected biopsy punches from normal and tumor tissues. When we applied the OSC-PLS model previously built on the training set, we correctly classified normal and tumor tissue samples. The resulting OSC-PLS scores plots are shown in Fig. 3B.
FFPE tissue sections
We have investigated whether limited amount of material, such as FFPE sections, could be utilized to obtain an accurate metabolic fingerprinting. To address this, we obtained 20-μm sections from FFPE biopsy punches of the validation set and performed manual macrodissection to generate samples enriched for normal or tumor tissue (Fig. 3B). Akin to FFPE biopsy punches, when we applied the OSC-PLS model previously built on the training set, we correctly classified normal and tumor tissue samples. Taken together, these data suggest that a separation between normal and tumor metabolic fingerprint is still possible using a reduced amount of material, such as a tissue section.
Metabolite correlations with stroma and epithelia content
Next, we investigated whether metabolites could be correlated with stroma and epithelia content. Following metabolite extraction, FFPE tissue sections were stained with hematoxylin and eosin (H&E). Staining evaluation confirmed that the tissue architecture was preserved. A semiautomated algorithm was then used to quantify the cell number and the area of the epithelial and stroma compartments (Fig. 3C and D) in both normal and tumor tissues. The complete information relative to image analysis is provided in Supplementary Table S14.
We applied NMF (14, 21) to decipher metabolic signatures from stroma and epithelium. We identified 6 metabolic signatures (Supplementary Fig. S6) across the 16 FFPE samples of the validation set (8 biopsy punch samples and 8 tissue section samples). Despite the limited sample size, the analysis showed a correlation (albeit weak) between the signatures 1 and 4 with the stroma and epithelium tissue percentages, respectively (Supplementary Fig. S7), suggesting that stroma and epithelium may be characterized by different metabolomic profiles. In particular, fructose seems to be linked to a higher presence of epithelial tissue in the sample (r = 0.74, P = 3.60 × 10⁻²; FDR = 2.65 × 10⁻¹) as described in Supplementary Table S15.
Discussion
Over the past decade, the majority of metabolomic studies have been successfully conducted using frozen or fresh tissues. Promising, albeit very preliminary data supporting the technical feasibility of using FFPE material for metabolomic study has been recently provided, opening up the possibility of utilizing MS-based metabolic profiling in routinely processed tissue (9, 12). However, these studies were limited in the characterization of metabolites lost during formalin fixation and paraffin embedding and following extraction. These studies did not address specifically chemical groups of metabolites and their relative preservation through tissue processing. Here, we show a comprehensive analysis of all the classes of metabolites that are preserved after tissue processing, comparing cell lines and human tissues. Differences in the number of detectable metabolites may be ascribed to their wide variety of physical–chemical properties that can be susceptible to FFPE processing. Indeed, during the multistep procedure of fixation and embedding in paraffin, there are factors, such as solvents used in the procedure or reactive groups of certain molecules, which can affect the preservation of metabolites that survive tissue processing. While solvents may reduce the concentration of both polar and non-polar metabolites, dipeptides characterized by the presence of the carboxamide functional group may react with formalin making their detection post-processing impossible.
Overall 55% and 40% of metabolites were retained in FFPE cell lines and human tumors when compared with their matched frozen specimens, but preservation of metabolites varied significantly with class categories. Specifically, there was a better retention of lipids and a negligible preservation of peptides with FFPE processing. Lipids were characterized by a heterogeneous behavior, with metabolites with good detectability such as fatty acids and others like fatty acid esters and steroids that were poorly detectable. This has to be kept in consideration, when designing MS-based metabolic profiling experiments in archival tissues.
Despite the loss of a fair number of metabolites, we successfully used metabolic profiling in FFPE material to accurately distinguish isogenic prostate cancer cell lines with different biologic characteristics and hormonal-dependent status. We also were able to accurately distinguish benign from malignant tissue in archival human prostate cancer specimens characterizing some metabolic pathways altered in malignant tissue. For instance, the upregulation of α-linoleic acid and linoleic acid metabolism, seen in prostate cancer samples compared with their benign counterpart and retained in FFPE material, was confirmed in a recent study showing that among patients with prostate cancer, prostatic α-linoleic acid, independent of the diet, was significantly and positively associated with biomarkers of aggressive disease, that is, both higher prostate-specific antigen (PSA) and tumor proliferation rates (25). These results demonstrate that metabolic profiling in FFPE is both feasible and useful.
Finally, we show that it is feasible to perform methanol extraction of metabolites directly from FFPE tissue sections preserving their architecture. These can subsequently be stained and subjected to image analysis to determine the cell type composition that contributes to the metabolic profile and to identify metabolic features unique to different cell compartments (e.g., stroma vs. epithelium). This result suggests that it is possible to profile metabolites in tissue section in addition to other molecular techniques in FFPE material, such as histologic imaging analyses, to identify novel metabolic biomarkers and biologic relevant metabolic pathways.
Overall, FFPE tissue section metabolomics shows promise to be applied to determine diagnostic, prognostic, or predictive markers in archival specimen used in routine diagnosis with excellent preservation of morphology.
Supplementary Material
Acknowledgments
Grant Support
This work was supported by NIH/NCI grant 2R01CA131945, the DF/HCC SPORE in Prostate Cancer (NIH/NCI P50 CA90381), the Prostate Cancer Foundation, and the DoD synergist idea development award 11498838 to M. Loda. S. Cacciatore is supported by SPARKS Children’s Medical Research Charity (P48061) and Imperial NIHR Biomedical Research Centre. G. Zadra is supported by a DoD Idea Development Award (PC150263). S. Tyekucheva was in part supported by R21 CA185787.
The costs of publication of this article were defrayed in part by the payment of page charges. This article must therefore be hereby marked advertisement in accordance with 18 U.S.C. Section 1734 solely to indicate this fact.
Footnotes
Note: Supplementary data for this article are available at Molecular Cancer Research Online (http://mcr.aacrjournals.org/).
Disclosure of Potential Conflicts of Interest
No potential conflicts of interest were disclosed.
Authors’ Contributions
Conception and design: S. Cacciatore, G. Zadra, K.L. Penney, M. Loda
Development of methodology: M. Loda
Acquisition of data (provided animals, acquired and managed patients, provided facilities, etc.): C. Bango, K.L. Penney, O. Yanes, M. Loda
Analysis and interpretation of data (e.g., statistical analysis, biostatistics, computational analysis): S. Cacciatore, G. Zadra, C. Bango, S. Tyekucheva, M. Loda
Writing, review, and/or revision of the manuscript: S. Cacciatore, G. Zadra, C. Bango, K.L. Penney, S. Tyekucheva, O. Yanes, M. Loda Study supervision: G. Zadra, O. Yanes, M. Loda
References
- 1.Priolo C, Pyne S, Rose J, Regan ER, Zadra G, Photopoulos C, et al. AKT1 and MYC induce distinctive metabolic fingerprints in human prostate cancer. Cancer Res. 2014;74:198–204. doi: 10.1158/0008-5472.CAN-14-1490. [DOI] [PMC free article] [PubMed] [Google Scholar]
- 2.Cacciatore S, Hu X, Viertler C, Kap M, Bernhardt GA, Mischinger HJ, et al. Effects of intra- and post-operative ischemia on the metabolic profile of clinical liver tissue specimens monitored by NMR. J Proteome Res. 2013;12:5723–9. doi: 10.1021/pr400702d. [DOI] [PubMed] [Google Scholar]
- 3.Aimetti M, Cacciatore S, Graziano A, Tenori L. Metabonomic analysis of saliva reveals generalized chronic periodontitis signature. Metabolomics. 2012;8:465–74. [Google Scholar]
- 4.Bertini I, Cacciatore S, Jensen BV, Schou JV, Johansen JS, Kruhoffer M, et al. Metabolomic NMR fingerprinting to identify and predict survival of patients with metastatic colorectal cancer. Cancer Res. 2012;72:356–64. doi: 10.1158/0008-5472.CAN-11-1543. [DOI] [PubMed] [Google Scholar]
- 5.Cacciatore S, Tenori L. Brain cholesterol homeostasis in Wilson disease. Med Hypotheses. 2013;81:1127–9. doi: 10.1016/j.mehy.2013.10.018. [DOI] [PubMed] [Google Scholar]
- 6.MacIntyre DA, Jimenez B, Lewintre EJ, Martin CR, Schafer H, Ballesteros CG, et al. Serum metabolome analysis by 1H-NMR reveals differences between chronic lymphocytic leukaemia molecular subgroups. Leukemia. 2010;24:788–97. doi: 10.1038/leu.2009.295. [DOI] [PubMed] [Google Scholar]
- 7.Maccaferri S, Klinder A, Cacciatore S, Chitarrari R, Honda H, Luchinat C, et al. In vitro fermentation of potential prebiotic flours from natural sources: impact on the human colonic microbiota and metabolome. Mol Nutr Food Res. 2012;56:1342–52. doi: 10.1002/mnfr.201200046. [DOI] [PubMed] [Google Scholar]
- 8.Cacciatore S, Loda M. Innovation in metabolomics to improve personalized healthcare. Ann NY Acad Sci. 2015;1346:57–62. doi: 10.1111/nyas.12775. [DOI] [PMC free article] [PubMed] [Google Scholar]
- 9.Kelly AD, Breitkopf SB, Yuan M, Goldsmith J, Spentzos D, Asara JM. Metabolomic profiling from formalin-fixed, paraffin-embedded tumor tissue using targeted LC/MS/MS: application in sarcoma. PLoS One. 2011;6:e25357. doi: 10.1371/journal.pone.0025357. [DOI] [PMC free article] [PubMed] [Google Scholar]
- 10.Wojakowska A, Marczak L, Jelonek K, Polanski K, Widlak P, Pietrowska M. An optimized method of metabolite extraction from formalin-fixed paraffin-embedded tissue for GC/MS analysis. PLoS One. 2015;10:e0136902. doi: 10.1371/journal.pone.0136902. [DOI] [PMC free article] [PubMed] [Google Scholar]
- 11.Buck A, Ly A, Balluff B, Sun N, Gorzolka K, Feuchtinger A, et al. High-resolution MALDI-FT-ICR MS imaging for the analysis of metabolites from formalin-fixed, paraffin-embedded clinical tissue samples. J Pathol. 2015;237:123–32. doi: 10.1002/path.4560. [DOI] [PubMed] [Google Scholar]
- 12.Yuan M, Breitkopf SB, Yang X, Asara JM. A positive/negative ion-switching, targeted mass spectrometry-based metabolomics platform for bodily fluids, cells, and fresh and fixed tissue. Nat Protoc. 2012;7:872–81. doi: 10.1038/nprot.2012.024. [DOI] [PMC free article] [PubMed] [Google Scholar]
- 13.Evans AM, DeHaven CD, Barrett T, Mitchell M, Milgram E. Integrated, nontargeted ultrahigh performance liquid chromatography/electrospray ionization tandem mass spectrometry platform for the identification and relative quantification of the small-molecule complement of biological systems. Anal Chem. 2009;81:6656–67. doi: 10.1021/ac901536h. [DOI] [PubMed] [Google Scholar]
- 14.Alexandrov LB, Nik-Zainal S, Wedge DC, Campbell PJ, Stratton MR. Deciphering signatures of mutational processes operative in human cancer. Cell Rep. 2013;3:246–59. doi: 10.1016/j.celrep.2012.12.008. [DOI] [PMC free article] [PubMed] [Google Scholar]
- 15.Dieterle F, Ross A, Schlotterbeck G, Senn H. Probabilistic quotient nor-malization as robust method to account for dilution of complex biological mixtures. Application in 1H NMR metabonomics. Anal Chem. 2006;78:4281–90. doi: 10.1021/ac051632c. [DOI] [PubMed] [Google Scholar]
- 16.Storey JD. A direct approach to false discovery rates. J R Stat Soc [Ser B] 2002;64:479–98. [Google Scholar]
- 17.Wold S, Antti H, Lindgren F, Öhman J. Orthogonal signal correction of near-infrared spectra. Chem Intell Lab Sys. 1998;44:175–85. [Google Scholar]
- 18.Cacciatore S, Luchinat C, Tenori L. Knowledge discovery by accuracy maximization. Proc Natl Acad Sci U S A. 2014;111:5117–22. doi: 10.1073/pnas.1220873111. [DOI] [PMC free article] [PubMed] [Google Scholar]
- 19.Cacciatore S, Tenori L, Luchinat C, Bennett P, MacIntyre D. KODAMA: an R package for knowledge discovery and data mining. Bioinformatics. 2016 Dec 19; doi: 10.1093/bioinformatics/btw705. [Epub ahead of print] [DOI] [PMC free article] [PubMed] [Google Scholar]
- 20.Ihaka R, Gentleman R. R: a language for data analysis and graphics. J Comput Graph Stat. 1996;5:299–314. [Google Scholar]
- 21.Alexandrov LB, Nik-Zainal S, Wedge DC, Aparicio SA, Behjati S, Biankin AV, et al. Signatures of mutational processes in human cancer. Nature. 2013;500:415–21. doi: 10.1038/nature12477. [DOI] [PMC free article] [PubMed] [Google Scholar]
- 22.Brunet JP, Tamayo P, Golub TR, Mesirov JP. Metagenes and molecular pattern discovery using matrix factorization. Proc Natl Acad Sci U S A. 2004;101:4164–9. doi: 10.1073/pnas.0308531101. [DOI] [PMC free article] [PubMed] [Google Scholar]
- 23.Kaushik AK, Vareed SK, Basu S, Putluri V, Putluri N, Panzitt K, et al. Metabolomic profiling identifies biochemical pathways associated with castration-resistant prostate cancer. J Proteome Res. 2014;13:1088–100. doi: 10.1021/pr401106h. [DOI] [PMC free article] [PubMed] [Google Scholar]
- 24.Putluri N, Shojaie A, Vasu VT, Nalluri S, Vareed SK, Putluri V, et al. Metabolomic profiling reveals a role for androgen in activating amino acid metabolism and methylation in prostate cancer cells. PLoS One. 2011;6:e21417. doi: 10.1371/journal.pone.0021417. [DOI] [PMC free article] [PubMed] [Google Scholar]
- 25.Azrad M, Zhang K, Vollmer RT, Madden J, Polascik TJ, Snyder DC, et al. Prostatic alpha-linolenic acid (ALA) is positively associated with aggressive prostate cancer: a relationship which may depend on genetic variation in ALA metabolism. PLoS One. 2012;7:e53104. doi: 10.1371/journal.pone.0053104. [DOI] [PMC free article] [PubMed] [Google Scholar]
Associated Data
This section collects any data citations, data availability statements, or supplementary materials included in this article.