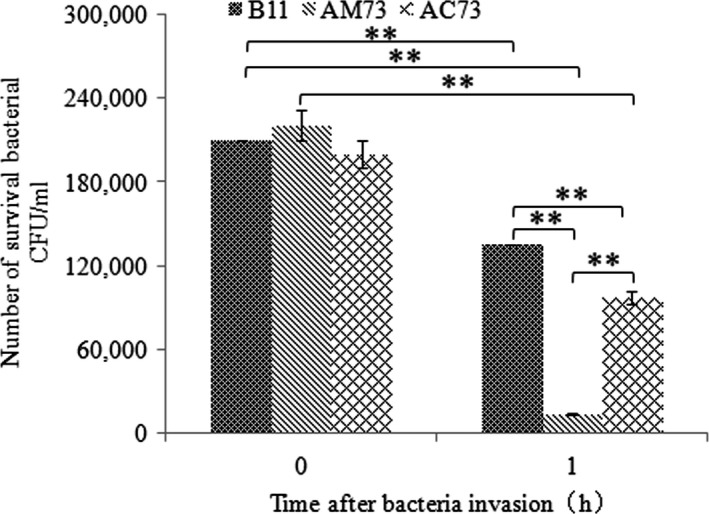
Figure 8.

The invasion and survival of B11, AM73, and AC73 in macrophages. The X‐axis represents time after bacterial invasion; the Y‐axis represents the number of surviving bacteria per ml of macrophages. Values denoted by different numbers of asterisks were significantly different when compared by ANOVA (“**” p < .01; “*” p < .05)
