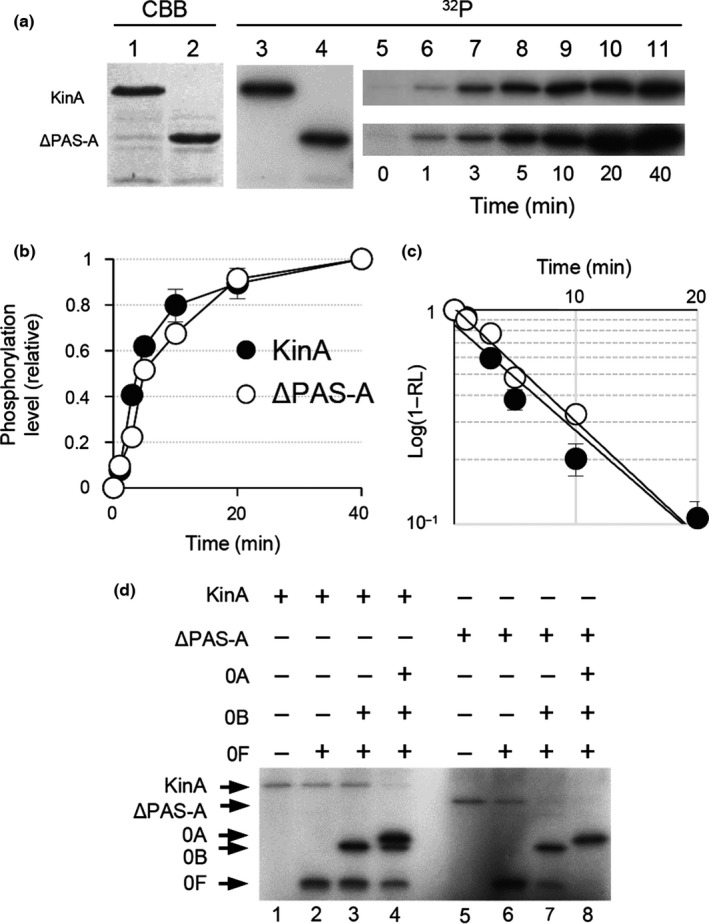
Figure 2.

In vitro autophosphorylation assay for PAS‐A domain deletion form of KinA (KinAΔ PAS ‐A). (a) Autophosphorylation activities of KinA and KinAΔ PAS ‐A (ΔPAS‐A) were measured in an in vitro reaction. Each of the purified proteins was analyzed by SDS‐PAGE (lanes 1 and 2, 0.1 μg protein stained with Coomassie brilliant blue, CBB in panel a) and with in vitro autophosphorylation in the presence of [γ‐32P]ATP followed by autoradiography of SDS‐PAGE (lanes 3 and 4, 32P in panel a). For kinetic analysis, at the indicated times, aliquots were removed from the in vitro autophosphorylation reaction mixture, mixed with SDS‐PAGE sample buffer to stop the reaction, and analyzed by SDS‐PAGE followed by autoradiography (lanes 5–11). (b) Relative phosphorylation levels over time of reaction. The fractions of phosphorylation levels plotted on the y‐axis in the graph were defined as the ratio of each of the radiolabeled proteins at the indicated time point to the maximum level of that present at the end point of the reaction and are expressed as the relative level (RL). (c) Graph indicates the semilogarithmic plot of the value of (1‐RL) as a function of time. The estimated values of kobs (pseudo‐first‐order rate constant) for the autophosphorylation of KinA and KinAΔ PAS ‐A were calculated from the slopes. The symbols are the same as in (b). (d) Spo0A phosphorylation by KinA and KinAΔ PAS ‐A through phosphorelay. The purified proteins as indicated on the top were incubated with [γ‐32P]ATP as described in Materials and Methods. (+) and (−) indicate with and without proteins, respectively. Whole reaction mixtures were analyzed by SDS‐PAGE followed by autoradiography. Each of the gel images displayed is one of the representative results (a and d). The mean from three independent experiments with standard error is shown (b and c)
