Abstract
Neighboring genes transcribing in the same direction can form chimeric RNAs via cis-splicing (cis-SAGe). Previously, we reported 16 novel cis-SAGe chimeras in prostate cancer cell lines, and performed in silico validation on 14 pairs of normal and tumor samples from Chinese patients. However, whether these fusions exist in different populations, as well as their clinical implications, remains unclear. To investigate, we developed a bioinformatics pipeline using modified Spliced Transcripts Alignment to a Reference (STAR) to quantify these fusion RNAs simultaneously in silico. From RNA-Seq data of 100 paired normal and prostate cancer samples from TCGA, we find that most fusions are not specific to cancer. However, D2HGDH-GAL3ST2 is more frequently seen in cancer samples, and seems to be enriched in the African American group. Further validation with our own collection as well as from commercial sources did not detect this fusion RNA in 29 normal prostate samples, but in 19 of 93 prostate cancer samples. It is more frequently detected in late stage cancer, suggesting a role in cancer progression. Consistently, silencing this fusion resulted in dramatic reduction of cell proliferation rate and cell motility.
Keywords: cis-SAGe, Chimeric RNA, D2HGDH-GAL3ST2, STAR, Prostate cancer
Introduction
Recurrent gene fusions resulting from chromosomal rearrangements in cancers have been reported for decades [1–3]. Numerous gene fusions are well-known genetic events that are actively used in clinical diagnosis; in addition, their fusion products have been shown to be effective targets for directed therapy [4–6]. The classic example is the oncogenic fusion BCR–ABL1 in chronic myeloid leukemia, a poster child for molecularly targeted therapy [7,8]. Because of their potential as cancer-specific markers and therapeutic targets, gene fusions have been sought after ever since the discovery of the Philadelphia Chromosome and BCR–ABL fusion [1,7,8]. While older laboratory methods of FISH and karyotyping were used effectively to discover gene fusions in hematological malignancies, sarcomas, and some solid tumors, microarray and high-throughput sequencing techniques over the past decade have been used to systematically discover previously unrecognized gene fusions in solid cancers, including TMPRSS2-ERG in prostate cancer [9] and EML4-ALK in lung cancer [10].
In addition to chromosomal rearrangement, another mechanism involving transcriptional read-through can also generate chimeric fusion RNAs. SLC45A3-ELK4 is one such example [11–13]. It was reported to be detected in the urine samples of prostate cancer patients [11–14]. In addition, silencing the fusion RNA resulted in significant cell growth arrest in both androgen-dependent, and castration-resistant prostate cancer cells [11]. In the literature, these chimeras have been described using various terms, “transcriptionmediated gene fusions”, “tandem chimerism”, and “conjoined genes” [15–17]. We have used the phrase “cis-splicing between adjacent genes (cis-SAGe)” to differentiate these transcriptional read-throughs from trans-splicings [11,14,18,19].
Recently, through manipulating CTCF levels and RNA-sequencing analysis, we identified 16 novel cis-SAGe fusions in prostate cancer cell lines, and validated their presence in an RNA-sequencing dataset from 14 pairs of normal and prostate cancer samples from Chinese patients [18,20]. However, their clinical implications, whether or not these fusions are present in other populations, as well as individual fusion’s function are not clear.
Here, we created an artificial “genome”, containing the 16 novel identified fusion RNAs, separated by a string of 100 Gs. We used Spliced Transcripts Alignment to a Reference (STAR) to align the TCGA prostate (cancer and normal) RNA-sequencing data against this artificial “genome”. Even though none of the fusion RNAs were detected exclusively in cancer samples, we did find that one fusion transcript, D2HGDH-GAL3ST2, is rarely seen in normal samples. Further validation with our own collection, as well as commercial sources, demonstrated that this fusion RNA was only detected in prostate cancers, but not in normal controls, and that its expression seems to be enriched in the late stage prostate cancers. Consistent with a role in prostate cancer progression, we found that silencing the fusion transcript, without affecting the parental genes, resulted in a dramatic reduction in prostate cancer cell proliferation and motility, both in androgen-dependent and castration-resistant cell lines.
Materials and methods
Chimeric RNA quantification
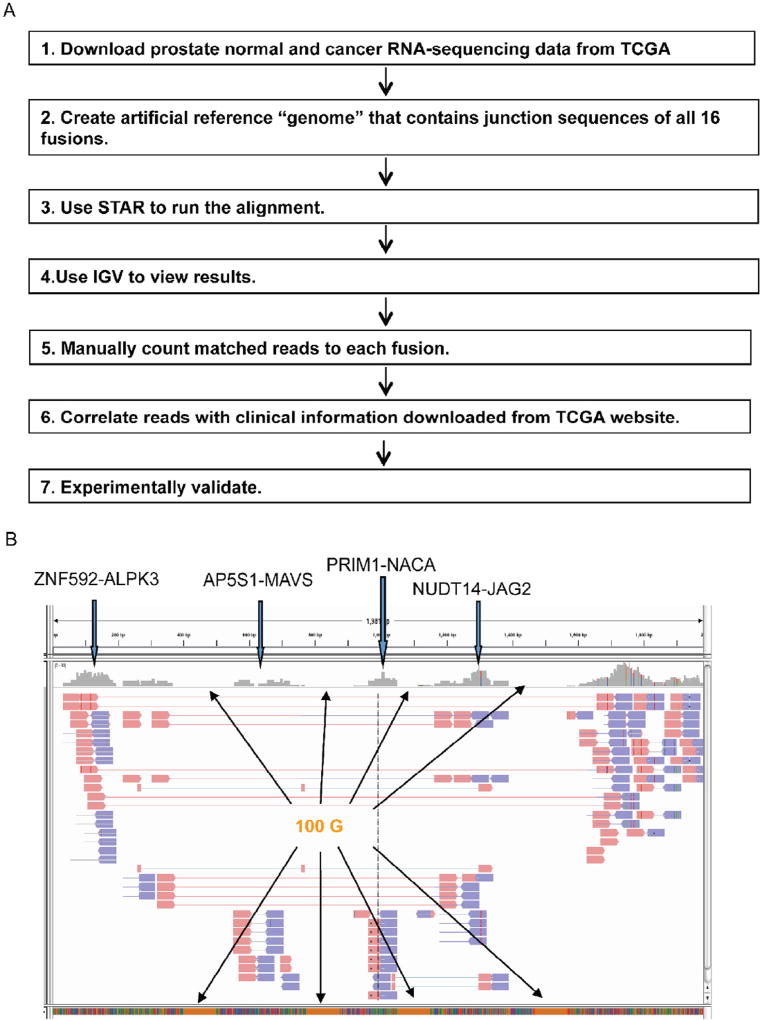
STAR [21] was used to align a given RNA-sequencing dataset against an artificial “genome”. To enable the analysis of multiple fusions, we obtained junction sequences of the 16 cis-SAGe fusions, containing at least 100 bp on each side of the fusion junction sites. We then concatenated the 16 fusion junction sequences together, and inserted 100 Gs in between every two fusions to facilitate visualization. We used this sequence as the reference “genome” for STAR [21]. Read pairs spanning or crossing fusion junctions by at least 10 bp were considered positive. As described previously, IGV [22,23] analysis was used to visualize fusions [18,24].
Datasets
50 pairs of normal prostate and prostate cancer, as well as 30 additional African American prostate cancer RNA-sequencing data were downloaded from the TCGA website.
Clinical samples
The use of the human clinical samples was approved by the IRB committee of the University of Virginia. 26 prostate clinical samples, including 12 normal and 14 tumor samples, were obtained from the Department of Pathology at the University of Virginia. All of the samples were de-identified. Two additional cDNA sets of 17 normal and 79 tumor samples were purchased from OriGene Technologies.
RNA extraction, PCR, and qRT-PCR
Cells transfected with si-negative (si−) or siRNAs against the fusion were harvested 48 hrs after transfection. Clinical samples were pulverized under liquid nitrogen. RNAs from both cell lines and clinical samples were extracted using TRIzol reagent (Life Technologies), following the manufacturer’s instruction. All of the RNA samples used in this study were treated with DNase I, followed by standard Reverse Transcription using AMV RT (NEB). PCR and qRT-PCR were performed as described [14,18,25]. Primers are listed in the Table S2.
Cell culture, siRNA knockdown, and transfection
Prostate cancer cell lines PC3 and LNCaP were cultured as previously described. [14,18] siRNA against luciferase gene was used as the negative control siRNA [26]. The targeting sequences of two siRNAs against D2HGDH-GAL3ST2 were CCTTGATACTTCCGGGTCA and CTATGGCCACCTTGATACT. siRNA transfection was carried out using Lipofectamine RNAiMAX (Life Technologies), following the manufacturer’s protocol. Cellular fractionation was performed as previous reported [11,14,18,27].
Wound healing assay
LNCaP and PC-3 cells transfected with si-negative control (si−), or siRNAs against D2HGDH-GAL3ST2 were cultured for three days, in order to obtain 80–90% monolayer confluency. A wound was created by scraping the cells using a 10 µl plastic pipette tip, and the medium was replaced with fresh medium. Images were captured immediately after making the scratch, and again 12 hours later (six hours for PC-3). Cell migration was qualitatively assessed by the size of the wounds at the end of the experiment.
Visualization
MultiExperiment Viewer (MeV, 4.9 version) software suite was used to generate a heat map containing the visualization of the expression of the 16 fusions in clinical samples [18,24]. IGV analysis was used to visualize the fusions as described previously [22,23].
Results
A bioinformatics pipeline to quantify fusion transcripts in silico and to investigate clinical association
High-throughput sequencing techniques have made possible a direct, systematic discovery of gene fusions, or fusion transcripts in solid cancers [1,13,28,29]. Previously, we manipulated the transcription factor CTCF, and used RNA-Seq to identify 16 cis-SAGe chimeric fusion RNAs in LNCaP cells [18]. In that study, we assessed the expression of these fusion RNAs in two other prostate cell lines, as well as validated their presence in RNA-Seq datasets of prostate cancer patients of Chinese heritage. However we do not know whether these fusions have any clinical implications, or if they are even expressed in other populations. Additionally, the functions of these fusions are unknown.
To gain additional knowledge regarding the expressions of these newly identified cis-SAGe fusions, and to investigate their clinical implications, we developed a pipeline (Fig. 1A).We downloaded 100 RNA-sequencing datasets from the TCGA prostate cancer study, which encompasses the entire collection of paired normal and prostate cancer samples within TCGA. We then stitched the junction sequences (at least 100 bp from each side) of the 16 fusion RNAs together. We added 100 bp Gs in-between every two fusions in order to facilitate visualization later. We used this concatenated sequence as the artificial reference “genome”, and used STAR [21] to align any given TCGA RNA-sequencing data against this “genome”. IGV [22,23] was then used to view the alignment. A screenshot of the alignment is shown in Fig. 1B. We manually counted matched reads to each fusion junction. Split reads and spanning reads that extend at least 10 bp across the junction were considered positive matches.
Fig. 1.
Experimental flow to quantify the 16 fusion RNAs, and investigate their clinical implications. A. We modified STAR to allow for detection of 16 fusions simultaneously. Each fusion sequence contains at least 100 bp from both sides of the fusion junction. We concatenated them into one sequence, and used it as the reference “genome”. For the ease of analyzing and viewing, we inserted 100 Gs between every two fusion sequences. We then counted the aligned read pair numbers across the fusion junction using IGV. For spanning reads, at least 10 bp extending past the junction sequence was considered a match. Clinical data from TCGA was used to find any correlation regarding the expression of the fusions. Significant findings were then validated experimentally. B. A screenshot of IGV view. Four fusions are shown here. The stretches of orange blocks at the bottom are the 100 Gs added between every two fusions. Paired-end split or spanning reads across fusion junction were counted. Pink arrowheads are reads from one end. Blue arrowheads are reads from the other end. (For interpretation of the references to color in this figure legend, the reader is referred to the web version of this article.)
None of the 16 fusion transcripts was specific to cancer samples
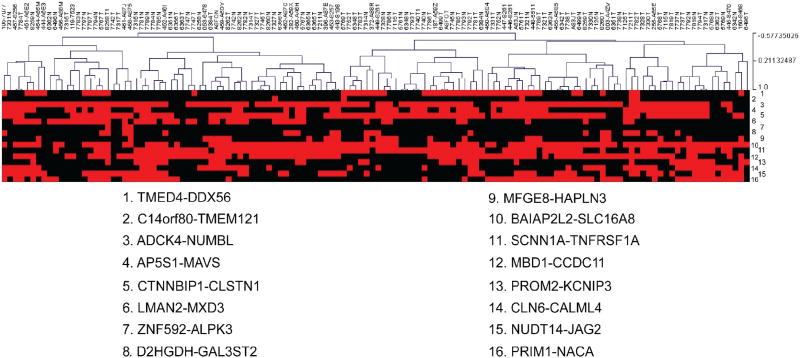
All of the fusions could be detected in the TCGA RNA-Seq dataset. However, we did not find any of the 16 fusions being exclusive to cancer samples (Fig. 2).We also failed to find any fusion RNAs that were expressed as statistically different in the cancer vs. normal controls (Table S1). Interestingly, clustering analysis did group five pairs of matched normal and cancer samples together, indicating that these pairs share common fusions. This also indicates that the individuality of the patients may contribute significantly to the fusion RNA profiles.
Fig. 2.
Clustering analysis. 130 TCGA samples were clustered based on the presence (red) or absence (black) of the 16 fusion RNAs. None of the 16 fusions were cancer specific. Five pairs of matched normal and cancer samples were clustered together, indicating similarities in the fusion RNA profiles of these matched pairs. (For interpretation of the references to color in this figure legend, the reader is referred to the web version of this article.)
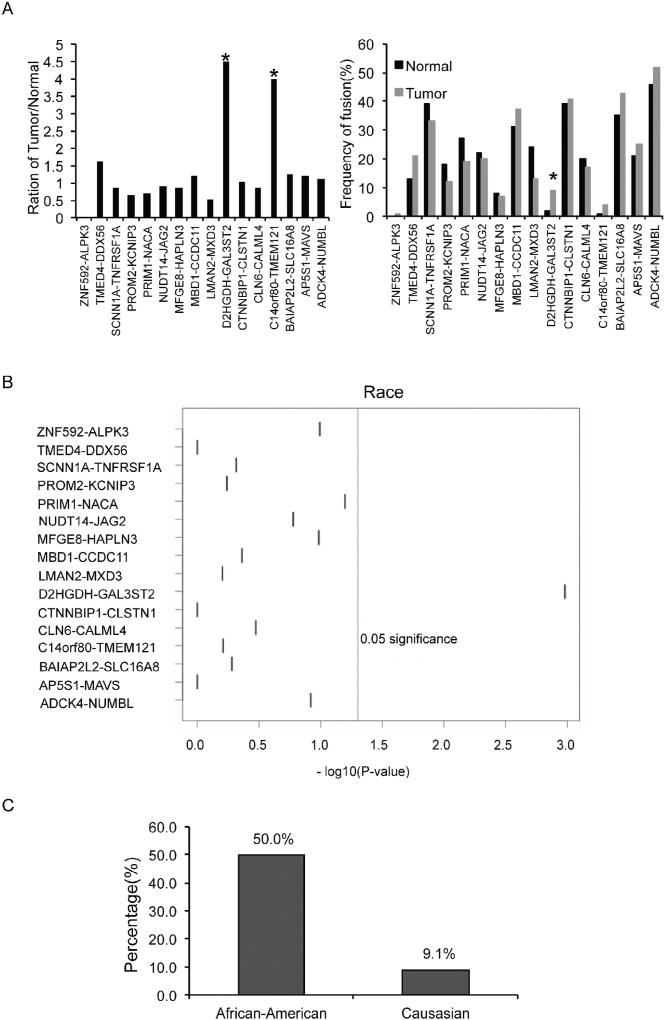
We then wondered whether the expressions of the fusion RNAs have any correlation with clinical parameters. We did notice that 13 out of 16 fusions showed a statistically significant correlation between the fusion’s expression and PSA (Fig. S1); and that MFGE8-HAPLN3 had a correlation with Gleason score (Fig. S1). Among the fusions, we noticed that two were preferentially detected in cancer: D2HGDH-GAL3ST2 in nine cancer samples, but only in two normal samples, and C14ORF80-TMEM121 in four cancer samples, but only in one normal sample (Fig. 3A). Interestingly, D2HGDH-GAL3ST2 was found in 5 out of 6 African American patients. Since there are only six pairs of samples from African American patients, we added 30 additional prostate cancer RNA-sequencing datasets from African American patients. All together, D2HGDH-GAL3ST2 was detected in 18 out of 36 African American samples. In contrast, it was detected in only 4 out of 44 Caucasian samples. Based on this RNA-Seq analysis, D2HGDH-GAL3ST2 had a 50.0% detection rate in the prostate cancer samples from African American patients, vs. 9.1% in the prostate cancer samples from Caucasian patients (Fig. 3C).
Fig. 3.
D2HGDH-GAL3ST2 was preferentially detected in prostate cancer samples, and seems to be enriched in African American patient samples. A. 16 fusion RNA detection in TCGA normal and tumor matched pairs. Left panel, ratio of fusion detection frequency between tumor and normal samples; right panel, frequency of fusion RNA detection in tumor and normal samples; B. Correlation between fusion RNAs and race. The vertical lines mark p = 0.05. C. The detection rate of fusion RNA D2HGDHGAL3ST2 in African-American and Caucasian patients, respectively.
D2HGDH-GAL3ST2 in prostate cancer cell lines and clinical samples
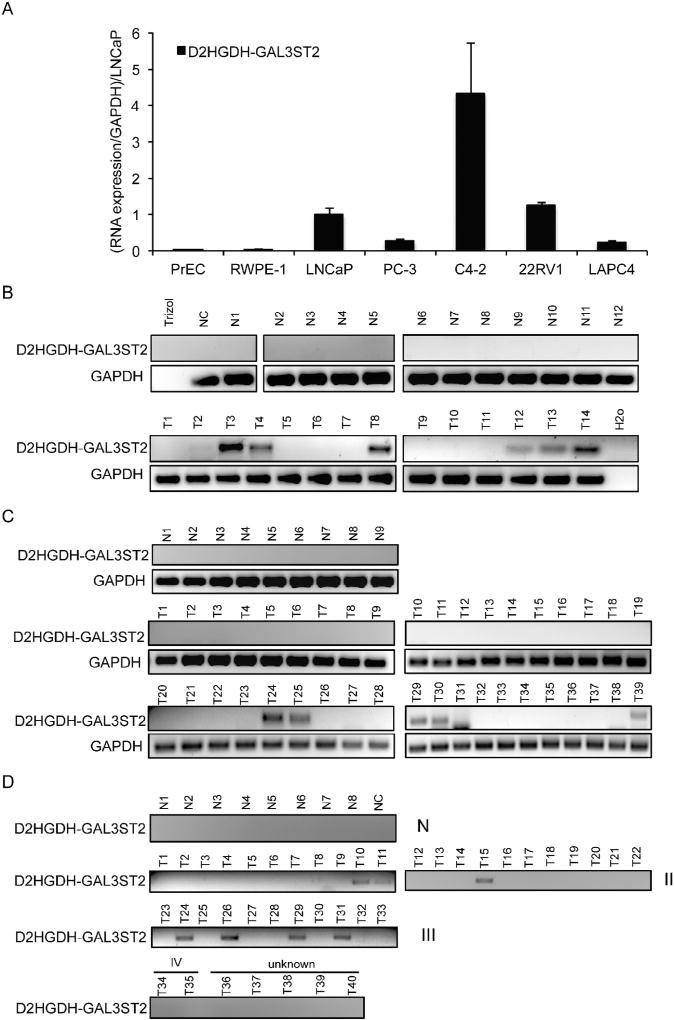
In addition to the enhanced detection rate in prostate cancer samples from TCGA, D2HGDH-GAL3ST2 was only seen in the cancer samples in our previous study with the 14 normal and cancer pairs of the Chinese patients [18]. We thus decided to focus on this cis-SAGe fusion (Fig. S2).We first measured its expression in cell lines, using qRT-PCR with Taqman probe specifically to detect the fusion RNA. Compared to PrEC and RWPE-1, nonprostate cancer cells, this fusion was expressed at a much higher level in all five prostate cancer cell lines, including LNCaP, PC-3, C4-2, 22RV1, and LAPC4 (Fig. 4A). Consistent with D2HGDH-GAL3ST2 being a CTCF induced cis-SAGe fusion, we observed an up-regulation of the fusion RNA, when CTCF was silenced in LNCaP cells (Fig. S3).
Fig. 4.
Expression of D2HGDH-GAL3ST2 in prostate cell lines and clinical samples. A. qRT-PCR measuring the expression of D2HGDH-GAL3ST2 in prostate benign and cancer cell lines. The expression of the fusion was normalized against internal control, GAPDH. The relative level was then set to 1.0 in LNCaP cells. B. Expression of D2HGDH-GAL3ST2 in frozen prostate biopsies by RT-PCR, followed by gel-electrophoresis. C. RNA expression of D2HGDH-GAL3ST2 in HPRT103 TissueScan array from OriGene. N1–N9, normal; T1–T18, stage II; T19–T37, stage III; T38–T39, stage IV. D. RNA expression of D2HGDH-GAL3ST2 in HPRT102 prostate clinical samples purchased from OriGene. N1–N8, normal; T1–T22, stage II; T23–T33, stage III; T34–T35, stage IV; T36–T40 unknown stage; NC is the H2O control.
In order to detect the fusion expression in clinical samples, we acquired 12 frozen normal prostate samples, and 14 prostate cancer biopsy samples. We examined D2HGDH-GAL3ST2 level with RTPCR, and found that 7 out of 14 tumor samples expressed the fusion RNA, but no expression of the fusion was found in any of 12 normal samples (Fig. 4B).
To further confirm the fusion’s cancer-specific expression, and to investigate its clinical implications, we purchased a TissueScan prostate cancer and normal prostate cDNA array set (HPRT103) from OriGene. All of the cDNAs were quality controlled, and had similar levels of B-actin. RT-PCR showed that the fusion RNA was only expressed in Stage III and IV prostate tumor samples (5 out of 21), but not in any of the nine normal or 18 Stage II tumors (Fig. 4C). We then obtained a different cDNA array set (HPRT102) from OriGene, and again confirmed that the fusion was exclusively detected in prostate cancer samples (7 out of 40), but not in any of the eight normal samples (Fig. 4D). All together, D2HGDH-GAL3ST2 fusion RNA was detected in 19 out of 93 prostate cancer samples, but not in any of the 29 normal controls. It seems to be preferentially expressed in late stage (III, IV). It was detected in 9 out of 33 stage III and IV cases, but only in three of the 41 Stage II cases (p < 0.05). However, we failed to confirm a biased detection rate of the fusion in African American patients (0 in 9 for African American samples, 8 in 43 for Caucasian samples, 1 in 6 for Asian samples, and 3 in 21 ethnicity not reported samples) (Fig. S4).
Down-regulation of D2HGDH-GAL3ST2 slowed down cell proliferation and migration
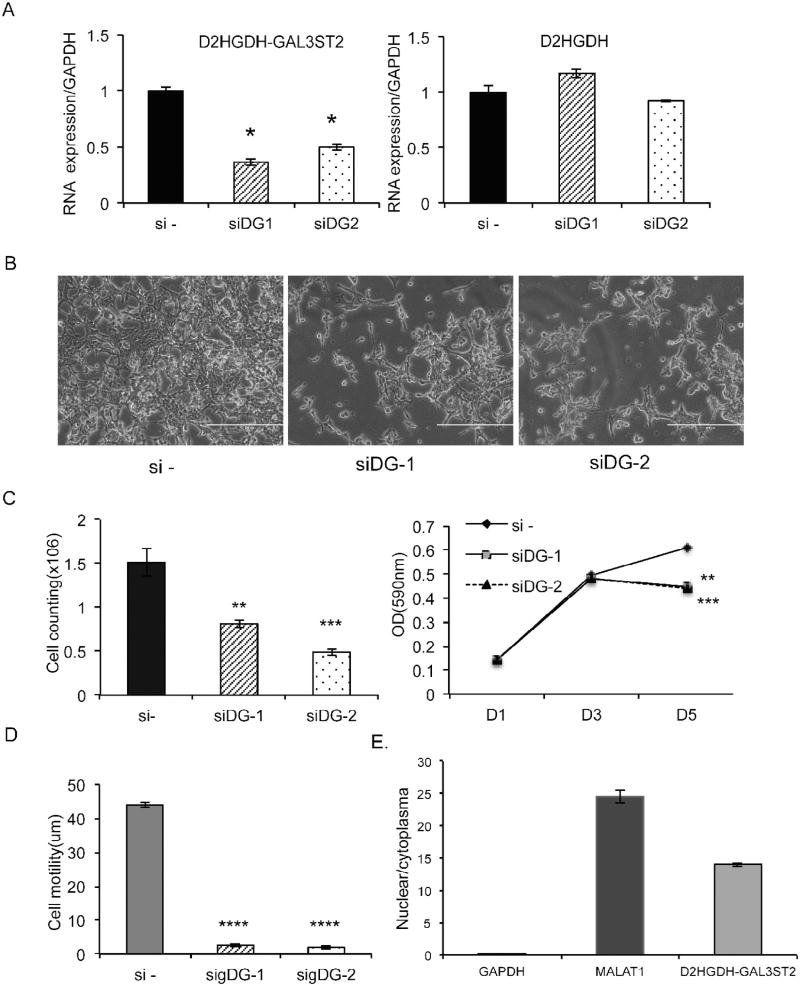
D2HGDH encodes D-2hydroxyglutarate dehydrogenase, which is a mitochondrial enzyme belonging to the FAD-binding oxidoreductase/transferase type 4 family. GAL3ST2 encodes a member of the galactose-3-O-sulfotransferase protein family. To study the fusion’s function, we designed two siRNAs that specifically target the fusion transcript. They both significantly knocked down the fusion RNA, and had no obvious effect on the D2HGDH parental transcript in LNCaP and PC3 cells (Fig. 5A, S5A). The GAL3ST2 gene was not expressed in these cells. We monitored cell proliferation using cell counting and MTT assays. We observed significant reductions in both assays when LNCaP cells were transfected with the siRNAs targeting the fusion transcript (Fig. 5B and C). Cell motility was also dramatically reduced in LNCaP cells transfected with the fusion-targeting siRNAs, as demonstrated by wound healing assay at the earlier time point after transfection (Fig. 5D). Similarly, in a castration-resistant prostate cancer cell line, PC3, silencing the fusion also resulted in reduced cell proliferation and cell migration (Fig. S5B and C).
Fig. 5.
Knockdown of D2HGDH-GAL3ST2 decreased cell proliferation and cell motility in prostate cancer cells. A. Two siRNAs specifically knocked down the fusion RNA D2HGDH-GAL3ST2, with no significant effect on the parental D2HGDH. B. Cell number was dramatically reduced by knockdown of D2HGDH-GAL3ST2 in LNCaP cells. C. Cell proliferation was measured by cell counting (left) and MTT assays (right). D. Cell motility was measured by wound healing assay. E. D2HGDH-GAL3ST2 was enriched in the cell nucleus. The ratio of nuclear vs. cytoplasmic RNA levels of GAPDH, MALAT1, and the fusion were measured by qRT-PCR using RNA extracted from a cell fractionation assay. *, p < 0.05; **, p < 0.01; ***, p < 0.001; ****, p < 0.0001.
In D2HGDH-GAL3ST2, the protein coding sequence of GAL3ST2 gene uses a different reading frame than the D2HGDH gene, which means that the fusion RNA will not encode a fusion protein. Many long non-coding RNAs function as transcriptional regulators [30], and reside within the cell nucleus. Suspecting that the fusion might function as a long non-coding RNA, we fractionated LNCaP cells, and tested the relative expression of this fusion RNA in the nuclear vs. cytoplasmic fractions. Indeed, the D2HGDH-GAL3ST2 fusion RNA was abundantly enriched in the nuclear fraction (Fig. 5E).
Discussion
Chimeric RNAs were traditionally thought to be unique features of neoplasia. However, more and more chimeric RNAs are being found in non-cancer tissues and cells [17,18,24,27,31–33]. All of the 16 chimeras we studied here could be detected in the normal controls. However, the normal controls used in TCGA are in fact normal margins from cancer patients. Thus, it is still possible that the fusions occur in these patients as an early event of neoplasia development, before the appearance of any abnormal histological features, or a simple field effect. Supporting this hypothesis, 13 out of the 16 fusions showed a statistically significant correlation between the fusion’s expression and PSA (Fig. S1); on the other hand, the fusions could be part of normal physiology, or some sort of polymorphism among individuals. We did observe close clustering of fusion RNA profiles from several matched normal and cancer pairs.
To quantify the expression of the fusion RNAs in silico, one could use SOAPfuse, or other software tools, to analyze the whole transcriptome. However, these fusion-mining software tools require an abundance of computing time and memory. In addition, they are not very accurate in quantifying transcripts. On the other hand, simple alignment tools, like STAR, were developed based on an RNASeq alignment algorithm that uses sequential maximum mappable seed searches in uncompressed suffix arrays, followed by seed clustering, and stitching procedures [34]. It is much faster and more accurate when we are only interested in measuring known fusions. Thus, we modified the STAR by changing the reference genome into a string of sequences containing all of our fusion RNAs of interest. To facilitate analysis and visualization, we artificially added 100 Gs between every two fusions. Using this approach, running time and computational memory usage were dramatically reduced. We then used IGV to view and count reads spanning, or split reads covering, fusion junction sites. We expect that this same approach can be used to quickly quantify all of the known fusion RNAs in any given RNA-Seq dataset.
Some of the observations in TCGA RNA-Seq analyses could not be reproduced experimentally. For instance, we did not detect a biased enrichment of D2HGDH-GAL3ST2 using the TissueScan cDNA array in the African American sample population. This disparity could stem from the relatively small sample size, differences in sample selection criteria, differences in preparation procedures between TCGA and OriGene, or intrinsic differences between RNA-Seq and RT-PCR.
D2HGDH-GAL3ST2 is a cis-SAGe fusion RNA identified recently by our group [18]. Our results indicate a potential correlation between fusion expression and cancer stage and/or patient race. The mechanism for these associations is not clear, and requires further investigation. Knockdown of the fusion decreased cell proliferation and cell motility; additionally the fusion transcript is highly enriched in the cell nucleus, suggesting a non-coding role in regulating prostate cancer progression. Clearly, more functional and mechanistic studies are needed for a better understanding of this novel cis-SAGe fusion RNA.
Acknowledgments
We thank Loryn Facemire for editing the manuscript. This work is supported by NIH grant CA190713.
Footnotes
Conflict of interest
We declare that there is no conflict of interest in relation to the work described.
Appendix: Supplementary material
Supplementary data to this article can be found online at doi:10.1016/j.canlet.2016.06.013.
References
- 1.Kumar-Sinha C, Kalyana-Sundaram S, Chinnaiyan AM. Landscape of gene fusions in epithelial cancers: seq and ye shall find. Genome Med. 2015;7:129. doi: 10.1186/s13073-015-0252-1. [DOI] [PMC free article] [PubMed] [Google Scholar]
- 2.Nowell PC, Hungerford DA. Chromosome studies in human leukemia. II. Chronic granulocytic leukemia. J. Natl. Cancer Inst. 1961;27:1013–1035. [PubMed] [Google Scholar]
- 3.Nowell PC, Hungerford DA. Chromosome studies on normal and leukemic human leukocytes. J. Natl. Cancer Inst. 1960;25:85–109. [PubMed] [Google Scholar]
- 4.Heim S, Mitelman F. Molecular screening for new fusion genes in cancer. Nat. Genet. 2008;40:685–686. doi: 10.1038/ng0608-685. [DOI] [PubMed] [Google Scholar]
- 5.Rowley JD. The role of chromosome translocations in leukemogenesis. Semin. Hematol. 1999;36:59–72. [PubMed] [Google Scholar]
- 6.Rabbitts TH. Chromosomal translocations in human cancer. Nature. 1994;372:143–149. doi: 10.1038/372143a0. [DOI] [PubMed] [Google Scholar]
- 7.Rabbitts TH. Commonality but diversity in cancer gene fusions. Cell. 2009;137:391–395. doi: 10.1016/j.cell.2009.04.034. [DOI] [PubMed] [Google Scholar]
- 8.Wong S, Witte ON. The BCR-ABL story: bench to bedside and back. Annu. Rev. Immunol. 2004;22:247–306. doi: 10.1146/annurev.immunol.22.012703.104753. [DOI] [PubMed] [Google Scholar]
- 9.Tomlins SA, Rhodes DR, Perner S, Dhanasekaran SM, Mehra R, Sun XW, et al. Recurrent fusion of TMPRSS2 and ETS transcription factor genes in prostate cancer. Science. 2005;310:644–648. doi: 10.1126/science.1117679. [DOI] [PubMed] [Google Scholar]
- 10.Soda M, Choi YL, Enomoto M, Takada S, Yamashita Y, Ishikawa S, et al. Identification of the transforming EML4-ALK fusion gene in non-small-cell lung cancer. Nature. 2007;448:561–566. doi: 10.1038/nature05945. [DOI] [PubMed] [Google Scholar]
- 11.Zhang Y, Gong M, Yuan H, Park HG, Frierson HF, Li H. Chimeric transcript generated by cis-splicing of adjacent genes regulates prostate cancer cell proliferation. Cancer Discov. 2012;2:598–607. doi: 10.1158/2159-8290.CD-12-0042. [DOI] [PubMed] [Google Scholar]
- 12.Rickman DS, Pflueger D, Moss B, VanDoren VE, Chen CX, de la Taille A, et al. SLC45A3-ELK4 is a novel and frequent erythroblast transformation-specific fusion transcript in prostate cancer. Cancer Res. 2009;69:2734–2738. doi: 10.1158/0008-5472.CAN-08-4926. [DOI] [PMC free article] [PubMed] [Google Scholar]
- 13.Maher CA, Kumar-Sinha C, Cao X, Kalyana-Sundaram S, Han B, Jing X, et al. Transcriptome sequencing to detect gene fusions in cancer. Nature. 2009;458:97–101. doi: 10.1038/nature07638. [DOI] [PMC free article] [PubMed] [Google Scholar]
- 14.Qin F, Song Y, Zhang Y, Facemire L, Frierson H, Li H. Role of CTCF in regulating SLC45A3-ELK4 chimeric RNA. PLoS ONE. 2016;11:e0150382. doi: 10.1371/journal.pone.0150382. [DOI] [PMC free article] [PubMed] [Google Scholar]
- 15.Prakash T, Sharma VK, Adati N, Ozawa R, Kumar N, Nishida Y, et al. Expression of conjoined genes: another mechanism for gene regulation in eukaryotes. PLoS ONE. 2010;5:e13284. doi: 10.1371/journal.pone.0013284. [DOI] [PMC free article] [PubMed] [Google Scholar]
- 16.Parra G, Reymond A, Dabbouseh N, Dermitzakis ET, Castelo R, Thomson TM, et al. Tandem chimerism as a means to increase protein complexity in the human genome. Genome Res. 2006;16:37–44. doi: 10.1101/gr.4145906. [DOI] [PMC free article] [PubMed] [Google Scholar]
- 17.Akiva P, Toporik A, Edelheit S, Peretz Y, Diber A, Shemesh R, et al. Transcription-mediated gene fusion in the human genome. Genome Res. 2006;16:30–36. doi: 10.1101/gr.4137606. [DOI] [PMC free article] [PubMed] [Google Scholar]
- 18.Qin F, Song Z, Babiceanu M, Song Y, Facemire L, Singh R, et al. Discovery of CTCF-sensitive Cis-spliced fusion RNAs between adjacent genes in human prostate cells. PLoS Genet. 2015;11:e1005001. doi: 10.1371/journal.pgen.1005001. [DOI] [PMC free article] [PubMed] [Google Scholar]
- 19.Kumar-Sinha C, Kalyana-Sundaram S, Chinnaiyan AM. SLC45A3-ELK4 chimera in prostate cancer: spotlight on cis-splicing. Cancer Discov. 2012;2:582–585. doi: 10.1158/2159-8290.CD-12-0212. [DOI] [PMC free article] [PubMed] [Google Scholar]
- 20.Ren S, Peng Z, Mao JH, Yu Y, Yin C, Gao X, et al. RNA-seq analysis of prostate cancer in the Chinese population identifies recurrent gene fusions, cancer-associated long noncoding RNAs and aberrant alternative splicings. Cell Res. 2012;22:806–821. doi: 10.1038/cr.2012.30. [DOI] [PMC free article] [PubMed] [Google Scholar]
- 21.Dobin A, Davis CA, Schlesinger F, Drenkow J, Zaleski C, Jha S, et al. STAR: ultrafast universal RNA-seq aligner. Bioinformatics. 2013;29:15–21. doi: 10.1093/bioinformatics/bts635. [DOI] [PMC free article] [PubMed] [Google Scholar]
- 22.Thorvaldsdottir H, Robinson JT, Mesirov JP. Integrative Genomics Viewer (IGV): high-performance genomics data visualization and exploration. Brief. Bioinform. 2013;14:178–192. doi: 10.1093/bib/bbs017. [DOI] [PMC free article] [PubMed] [Google Scholar]
- 23.Robinson JT, Thorvaldsdottir H, Winckler W, Guttman M, Lander ES, Getz G, et al. Integrative genomics viewer. Nat. Biotechnol. 2011;29:24–26. doi: 10.1038/nbt.1754. [DOI] [PMC free article] [PubMed] [Google Scholar]
- 24.Babiceanu M, Qin F, Xie Z, Jia Y, Lopez K, Janus N, et al. Recurrent chimeric fusion RNAs in non-cancer tissues and cells. Nucleic Acids Res. 2016 doi: 10.1093/nar/gkw032. [DOI] [PMC free article] [PubMed] [Google Scholar]
- 25.Qin FJ, Sun QW, Huang LM, Chen XS, Zhou DX. Rice SUVH histone methyltransferase genes display specific functions in chromatin modification and retrotransposon repression. Mol Plant. 2010;3:773–782. doi: 10.1093/mp/ssq030. [DOI] [PubMed] [Google Scholar]
- 26.Machida YJ, Chen Y, Machida Y, Malhotra A, Sarkar S, Dutta A. Targeted comparative RNA interference analysis reveals differential requirement of genes essential for cell proliferation. Mol. Biol. Cell. 2006;17:4837–4845. doi: 10.1091/mbc.E06-04-0340. [DOI] [PMC free article] [PubMed] [Google Scholar]
- 27.Yuan H, Qin F, Movassagh M, Park H, Golden W, Xie Z, et al. A chimeric RNA characteristic of rhabdomyosarcoma in normal myogenesis process. Cancer Discov. 2013;3:1394–1403. doi: 10.1158/2159-8290.CD-13-0186. [DOI] [PubMed] [Google Scholar]
- 28.Stephens PJ, McBride DJ, Lin ML, Varela I, Pleasance ED, Simpson JT, et al. Complex landscapes of somatic rearrangement in human breast cancer genomes. Nature. 2009;462:1005–1010. doi: 10.1038/nature08645. [DOI] [PMC free article] [PubMed] [Google Scholar]
- 29.Maher CA, Palanisamy N, Brenner JC, Cao X, Kalyana-Sundaram S, Luo S, et al. Chimeric transcript discovery by paired-end transcriptome sequencing. Proc. Natl. Acad. Sci. U.S.A. 2009;106:12353–12358. doi: 10.1073/pnas.0904720106. [DOI] [PMC free article] [PubMed] [Google Scholar]
- 30.Vance KW, Ponting CP. Transcriptional regulatory functions of nuclear long noncoding RNAs. Trends Genet. 2014;30:348–355. doi: 10.1016/j.tig.2014.06.001. [DOI] [PMC free article] [PubMed] [Google Scholar]
- 31.Kim DS, Kim DW, Kim MY, Nam SH, Choi SH, Kim RN, et al. CACG: a database for comparative analysis of conjoined genes. Genomics. 2012;100:14–17. doi: 10.1016/j.ygeno.2012.05.005. [DOI] [PubMed] [Google Scholar]
- 32.Fang W, Wei Y, Kang Y, Landweber LF. Detection of a common chimeric transcript between human chromosomes 7 and 16. Biol. Direct. 2012;7:49. doi: 10.1186/1745-6150-7-49. [DOI] [PMC free article] [PubMed] [Google Scholar]
- 33.Li H, Wang J, Mor G, Sklar J. A neoplastic gene fusion mimics trans-splicing of RNAs in normal human cells. Science. 2008;321:1357–1361. doi: 10.1126/science.1156725. [DOI] [PubMed] [Google Scholar]
- 34.Ren G, Zhang Y, Mao X, Liu X, Mercer E, Marzec J, et al. Transcription-mediated chimeric RNAs in prostate cancer: time to revisit old hypothesis? OMICS. 2014;18:615–624. doi: 10.1089/omi.2014.0042. [DOI] [PMC free article] [PubMed] [Google Scholar]


