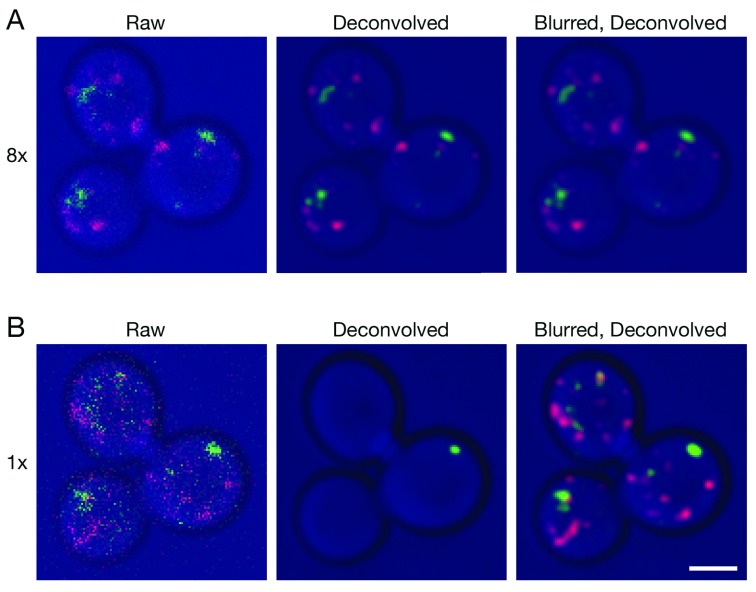
Figure 1. Improved deconvolution of 4D live cell data with a Gaussian blur prefilter.
Gene replacement in Saccharomyces cerevisiae was used to label late Golgi cisternae with Sec7-mCherry (red) and prevacuolar endosomes with Vps8-GFP (green) ( Papanikou et al., 2015). Cells were imaged by 4D confocal microscopy. In consecutive movies, line accumulation was set to ( A) 8x or ( B) 1x. The data were average projected either with no processing, or after deconvolution with Huygens, or after prefiltering with a 2D Gaussian blur using a radius of 0.75 pixels followed by deconvolution. Fluorescence data are superimposed on differential interference contrast images of the cells (blue). Shown are representative frames from Video 1 (8x) and Video 2 (1x). The fluorescence patterns in ( A) and ( B) are similar, but not identical because the labeled structures changed during the interval between the two movies. Scale bar, 2 µm.

