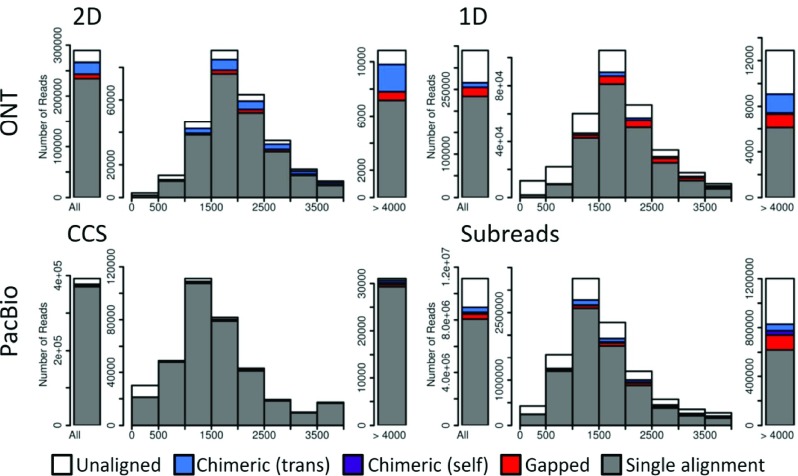
Figure 1. Length distribution of reads.
The length distribution of Oxford Nanopore Technologies (ONT) 2D and 1D reads (top) and Pacific Biosciences (PacBio) CCS and subreads (bottom). Aligned reads are color-coded to indicate fraction of reads that are: single best alignments (gray), gapped alignments consisting of multiple paths (red), self-chimeric alignments (purple) where different read segments map to overlapping sequences, and trans-chimeric alignments (blue) where read segments map to different loci; white color represents unaligned reads. The leftmost bar represents all reads, the middle portion reads from 0–4kb in length, and the rightmost are reads greater than 4kb. PacBio libraries were size-selected, while ONT libraries were not; this provides PacBio with a larger proportion of longer reads. The total number of reads sequenced and the number of aligned reads from each sequencing platform are available in Supplementary Table 2.

