

Supplemental Digital Content is available in the text.
Key Words: NGS, NTRK, gene rearrangements, IHC screen, entrectinib
Abstract
Targeted therapy combined with companion diagnostics has led to the advancement of next-generation sequencing (NGS) for detection of molecular alterations. However, using a diagnostic test to identify patient populations with low prevalence molecular alterations, such as gene rearrangements, poses efficiency, and cost challenges. To address this, we have developed a 2-step diagnostic test to identify NTRK1, NTRK2, NTRK3, ROS1, and ALK rearrangements in formalin-fixed paraffin-embedded clinical specimens. This test is comprised of immunohistochemistry screening using a pan-receptor tyrosine kinase cocktail of antibodies to identify samples expressing TrkA (encoded by NTRK1), TrkB (encoded by NTRK2), TrkC (encoded by NTRK3), ROS1, and ALK followed by an RNA-based anchored multiplex polymerase chain reaction NGS assay. We demonstrate that the NGS assay is accurate and reproducible in identification of gene rearrangements. Furthermore, implementation of an RNA quality control metric to assess the presence of amplifiable nucleic acid input material enables a measure of confidence when an NGS result is negative for gene rearrangements. Finally, we demonstrate that performing a pan-receptor tyrosine kinase immunohistochemistry staining enriches detection of the patient population for gene rearrangements from 4% to 9% and has a 100% negative predictive value. Together, this 2-step assay is an efficient method for detection of gene rearrangements in both clinical testing and studies of archival formalin-fixed paraffin-embedded specimens.
One embodiment of precision medicine entails patient stratification to targeted therapies via the use of companion diagnostics. One class of targeted therapeutics that has demonstrated strong promise for patient selection by companion diagnostics is the receptor tyrosine kinase (RTK) inhibitors. These RTKs can undergo genetic rearrangement, forming chimeric fusion proteins, which are highly expressed, hyperactivated, and frequently oncogenic.1 It has been shown that patients with tumors driven by these gene rearrangements are excellent candidates for targeted RTK inhibitor therapies.2,3 Because of the clinical response of ALK-rearranged non–small cell lung cancer (NSCLC) patients receiving the ALK RTK inhibitor crizotinib, (Xalkori), the Food and Drug Administration (FDA)-approved the Vysis break-apart fluorescence in-situ hybridization (FISH) test as a companion diagnostic for the detection of ALK rearrangement in NSCLC.3 Although not yet FDA approved, patients are also being selected for similar targeted therapies using FISH testing to assess for rare ROS1 gene rearrangements (~1% prevalence).4,5
As the requirement to potentially perform several different diagnostic tests on patients before selecting a targeted therapy grows, the model of testing a single marker on a single specimen for a single therapeutic becomes increasingly challenging and inefficient. The result is that clinical testing must be able to query a large volume of patient samples simultaneously for a wide range of markers, so that patients are assessed for the full spectrum of targeted therapeutics available. For this reason, there is increasing clinical use of next-generation sequencing (NGS) as a diagnostic platform. NGS allows assessment of multiple markers within a single sample from a tissue specimen that may be limited in quantity.6 The capacity of NGS instruments and bioinformatics software is such that a number of biomarkers can be multiplexed and a number of patients can be assessed simultaneously.7,8 However, both NGS and FISH testing for gene rearrangements have the disadvantage of being relatively labor intensive and potentially cost-prohibitive for many laboratories. These factors are exacerbated by the low frequency of gene rearrangements for many common targets in cancers.1 Studies have demonstrated that ALK immunohistochemistry (IHC) is an effective screening approach before FISH testing for clinical reporting9,10 and have reported up to 100% sensitivity based on the IHC scoring threshold used.10 Recently, the Ventana ALK (D5F3) assay, an IHC-based test for ALK expression has been approved by the FDA as a companion diagnostic for crizotinib (Xalkori). There is also parallel evidence from multiple studies to support IHC screening for ROS1,11 analogous to the ALK methodology. In addition, IHC for TrkA has identified clinical tumor specimens that harbor NTRK1 gene rearrangements.12
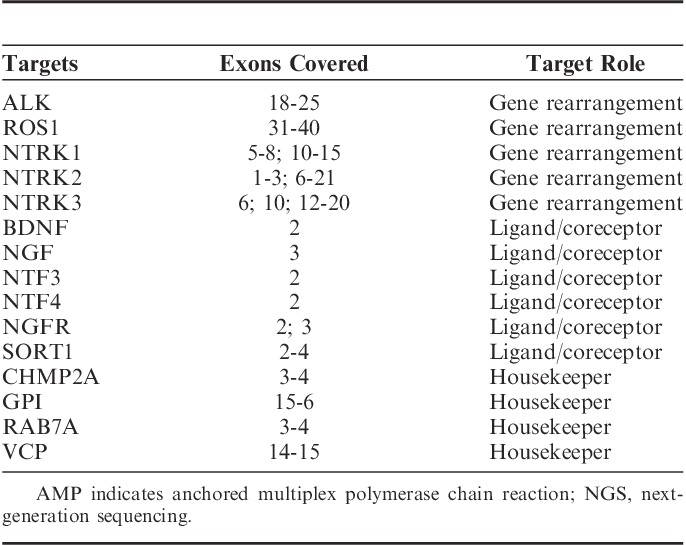
Here, we report a 2-step diagnostic test method for identification of gene rearrangements that include rapid IHC screening followed by anchored multiplex PCR (AMP) NGS assay.13 These gene rearrangements have targeted therapeutic options either available or in active clinical trials. The IHC screening test consists of a multiplex pan-RTK antibody cocktail, which uses a single tissue section to simultaneously assess for TrkA, TrkB, TrkC (pan-TRK, these are encoded by NTRK1, NTRK2, and NTRK3, respectively), ROS1, and ALK protein expression. The IHC screen acts as a negative predictor by enabling removal of samples negative for expression of any of these markers and thereby enriching for tumors harboring expressed gene rearrangements. This test is highly sensitive and any reduced antibody specificity is addressed by subsequent NGS testing for detection of gene rearrangements. The AMP NGS assay uses formalin-fixed paraffin-embedded (FFPE)-derived RNA as input and is comprised of a custom 15-gene panel targeting receptors known to undergo gene rearrangement (NTRK1, NTRK2, NTRK3, ROS1, and ALK), as well as their ligands and coreceptors, and housekeeping genes (Table 1). AMP provides highly sensitive detection for gene rearrangements and does not require prior knowledge of the rearrangement partner. Furthermore, the test includes an RNA quality control (QC) method, which assesses the amount of information-rich and amplifiable RNA present in a sample to enable confidence in the absence of the detection of a gene rearrangement. Together, these components make the test an efficient method for detection of gene rearrangements in both clinical testing and studies of archival FFPE specimens.
TABLE 1.
Gene Targets in the AMP NGS Panel
MATERIALS AND METHODS
Samples
All studies used FFPE samples. Control cell lines were grown per required cell culture conditions and cell pellets were embedded in agarose at a density ranging from 100-200 e^6 cells and prepared as FFPE specimens. Control cell lines (and associated gene rearrangements) include KARPAS-299 (NPM1:ALK), KM12 (TPM3:NTRK1), BaF3/TrkB (ETV6:NTRK2), BaF3/TrkC (ETV6:NTRK3), HCC78 (SLC34A2:ROS1), and U-118 MG (GOPC:ROS1). Tumor tissue samples were obtained from commercial sources (Proteogenex, Conversant, iSpecimen, Asterand) or from Samsung Medical Center. All study participants at Samsung Medical center provided written informed consent before study entry.
IHC
For all IHC assays, 4-μm FFPE sections on positively charged slides were used. FFPE sections were deparaffinized on a Prisma autostainer (Sakura, Torrance, CA) and then subjected to antigen retrieval at high heat (98°C) with high pH (9.0) Tris-EDTA buffer (Dako, Carpinteria, CA) using a Lab Vision PT Module (Thermo Fisher Scientific, Carlsbad, CA). Following antigen retrieval, sections were stained with a pan-RTK antibody cocktail consisting of rabbit monoclonal antibodies, all obtained from Cell Signaling (Danvers, MA), targeting Pan-Trk (C17F1, active against TrkA, TrkB, and TrkC, 1:25 dilution), ROS1 (D4D6, 1:500), and ALK (D5F3, 1:500). Staining was performed using the Autostainer 360 (Thermo Fisher Scientific). Slides were blocked for both endogenous peroxidase and nonspecific protein binding by using Dual Endogenous Enzyme Block (Dako) and UV blocking reagent (Thermo Fisher Scientific). All other staining was performed primarily with DAKO series reagents (Rabbit Envision+Dual Link System-HRP, Mayer’s Hematoxylin, Liquid Diaminobenzinide (DAB)+substrate chromogen system). Specimens were scored positive by the pathologist if the specimens exhibited any intensity of stain (weak to strong) in >5% of tumor cells. Specimens without any visible or faint stain, in tumor cells, were scored negative.
FISH
A 2-color break-apart FISH assay for detection of NTRK1 gene rearrangements was developed using orange (5′, centromere) and green (3′, telomere) probes which hybridize to the q23 locus on chromosome 1 of NTRK1 (Empire Genomics, Buffalo, NY). Samples with separation of the orange and green signals in >15% of tumor nuclei were scored positive for gene rearrangement.
Sample Preparation for NGS
For NGS studies, up to 4-μm (10) FFPE sections were macrodissected to isolate tumor-rich regions. Samples were extracted for total nucleic acid using Agencourt FormaPure Kit (Beckman Coulter, Brea, CA) following the corresponding protocol with an overnight digest. Total nucleic acid was quantified using the Qubit Broad Range RNA Assay Kit (Thermo Fisher Scientific) and 2 uL of sample. To recapitulate poor quality FFPE RNA, extracted FFPE RNA samples known to have large fragments were sheared on the Covaris E220 under normal RNA shearing conditions for 300 seconds. Alternatively, zinc-mediated fragmentation was performed with Ambion Fragmentation Reagent (Thermo Fisher Scientific) separately on equal amounts of RNA purified from fresh colon and prostate samples, along with an NSCLC FFPE sample. Aliquots were fragmented for various lengths of time to achieve varied fragment length distributions. Reactions were stopped using the provided EDTA solution.
RNA Integrity Assessment and Library Preparation for NGS
Unless otherwise indicated, 200 ng of FFPE RNA was used as input for NGS studies. To assess RNA quality, the PreSeq RNA QC Assay (ArcherDX Inc., Boulder, CO) using SYBR green master mix (Thermo Fisher Scientific) was performed on all samples during library preparation to generate a measure for integrity of RNA [in the form of a cycle threshold (Ct) value]. Library preparation and RNA QC were performed following the Archer Universal RNA Reagent Kit V2 for Illumina protocol (ArcherDX Inc.) with the exception of 20 cycles in PCR1 and 24 cycles in PCR2. A custom primer set with 113 primers spanning regions on 15 specific genes of interest was used. Final libraries were diluted 1:20,000 and quantified in a 10 μL reaction following the Library Quantification for Illumina Libraries protocol and assuming a 250 bp fragment length (KAPA, Wilmington, MA). A threshold representing the maximum Ct value for which sequencing can be robustly performed was set at Ct≤29 by comparing detection of fusion positivity using the AMP NGS assay on a subset of samples that were positive for gene rearrangements by external assessment (FISH or NGS) and using the bottom of the 95% confidence interval (CI).
NGS Sequencing and Analysis
Libraries were sequenced on a MiSeq or MiSeqDx sequencer (Illumina, San Diego, CA). Libraries were diluted to 4 nM and equal amounts of up to 16 libraries were pooled per run. Library pools were diluted to 16 pM library stock with 10% 12.5 pM PhiX and loaded in the MiSeq cartridge. Analysis of sequencing results was performed using the Archer Analysis software (v3.2.1; ArcherDX Inc.). Fusion parameters were set to a minimum of 5 valid fusion reads with a minimum of 3 unique start sites within the valid fusion reads.
Statistical Analysis
Statistical analyses were performed using the built in functions of GraphPad Prism (San Diego, CA). Figure 3C used 1-way ANOVA analysis and applies a linear trend regression to determine P-value.
FIGURE 3.
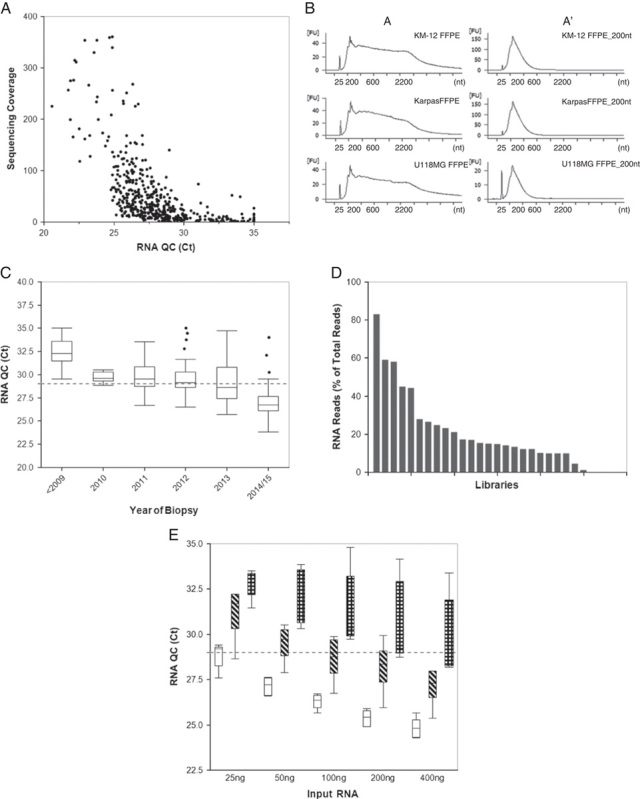
Assessment of RNA quality in FFPE tissues. A, FFPE tissues (n=478) were subjected to the RNA QC assay followed by NGS. Quantitative values for the RNA QC assay (Ct value) and sequencing coverage obtained from NGS (unique RNA reads) were graphed to examine the correlation between quality of RNA and the ability of the RNA to generate sequence. B, Three different FFPE-embedded cell lines harboring gene rearrangements (KM12; TPM3:NTRK1, KARPAS-299; NPM1:ALK, and U-118 MG; GOPC:ROS1) were mechanically sheared by Covaris to generate RNA fragments that range in average size from ∼300 nt (short) to ∼1000 nt (long). The electropherogram image shows the RNA profiles of each sample: A=normal (left column) and A′=sheared (right column). C, RNA obtained from FFPE blocks with increasing years from biopsy date (ranging from <2009 to 2015) was investigated for quality by running the RNA QC assay and assessing the Ct value obtained (n>6 for each year, circle indicates outliers, P<0.0001 for linear trend). D, Libraries were prepared from FFPE samples (n=25; different tissue types) using the same RNA input amount for each library (200 ng). The libraries were then sequenced by NGS and analyzed by Archer Analysis for the RNA reads per sample. E, To determine how quality of RNA impacts input amount, we assessed the RNA Ct values of FFPE samples when varying input amounts. Samples were stratified based on Ct values at 200 ng input (n≥6 for each category). White=low, Ct<26, diagonal hashes=medium, Ct=26 to 29, and checkered=high, Ct>29. The dotted line represents the threshold at 29. Ct indicates cycle threshold; FFPE, formalin-fixed paraffin-embedded; NGS, next-generation sequencing; QC, quality control.
RESULTS
Demonstration of the pan-RTK IHC
To address the limitations of time and cost for NGS testing, we created a first-step IHC screening assay that uses a pan-RTK antibody cocktail consisting of an anti-pan-Trk (TrkA, TrkB, TrkC) antibody, an anti-ROS1 antibody, and an anti-ALK antibody to detect expression of these genes. The purpose of IHC screening is to rapidly distinguish between patient specimens that are pan-negative for the RTKs of interest and those that demonstrate a weak to strong level of tumor staining, which may harbor gene rearrangements. Assessment of the range of pan-RTK staining on different tissues is shown in Figure 1. Normal colon tissue exhibited an absence of, or faint, staining (Figs. 1A, B, respectively) within the majority of cases tested (11 of 17). A normal liver biopsy adjacent to a metastatic lung tumor exhibited nuclear positivity without cytoplasmic stain, whereas the tumor specimen had strong cytoplasmic staining (Figs. 1C, D, respectively). Samples of squamous lung carcinoma (Figs. 1E, F) and colon adenocarcinoma (Figs. 1G, H) exhibited a range of staining from negative to strong with a high proportion of tumor cells stained. Staining by the pan-RTK IHC in these tissue types is consistent with individual Trk, ROS1, or ALK protein expression observed in previous IHC studies.10–12,14 The specificity to identify fusion-positive clinical samples is demonstrated by a thyroid carcinoma specimen with a known ETV6:NTRK3 gene rearrangement; the intermediate to strong staining of the pan-RTK IHC was observed (Fig. 2A). Individual IHC stains for ROS1 and ALK showed the expected negative staining pattern (Figs. 2B, C), whereas the anti-pan-Trk antibody exhibited strong staining (Fig. 2D).
FIGURE 1.
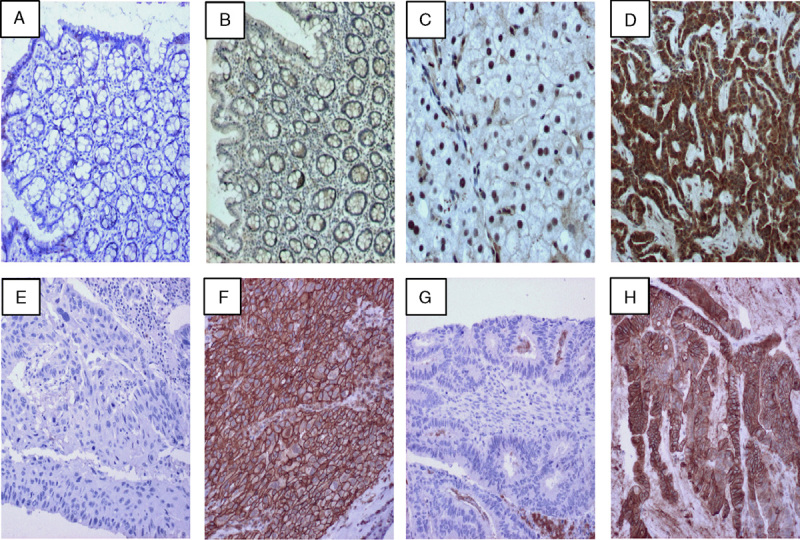
Examples of the pan-RTK IHC staining for TrkA, TrkB, TrkC, ROS1, and ALK in multiple tissue types. Tissues were stained with the pan-RTK antibody cocktail and developed with 3,3′-diaminobenzidine (DAB) to detect protein expressions. A and B, Staining of pan-RTK IHC in normal colon (4× magnification). C and D, Staining of pan-RTK in normal adjacent liver and metastatic lung tissue from the same patient on the same slide (respectively, 20× magnification). E and F, Negative and positive staining in lung adenocarcinoma tissue (respectively, 10× magnification). G and H, Negative and positive staining of colon carcinoma tissue (respectively, 10× magnification). IHC indicates immunohistochemistry; RTK, receptor tyrosine kinase.
FIGURE 2.
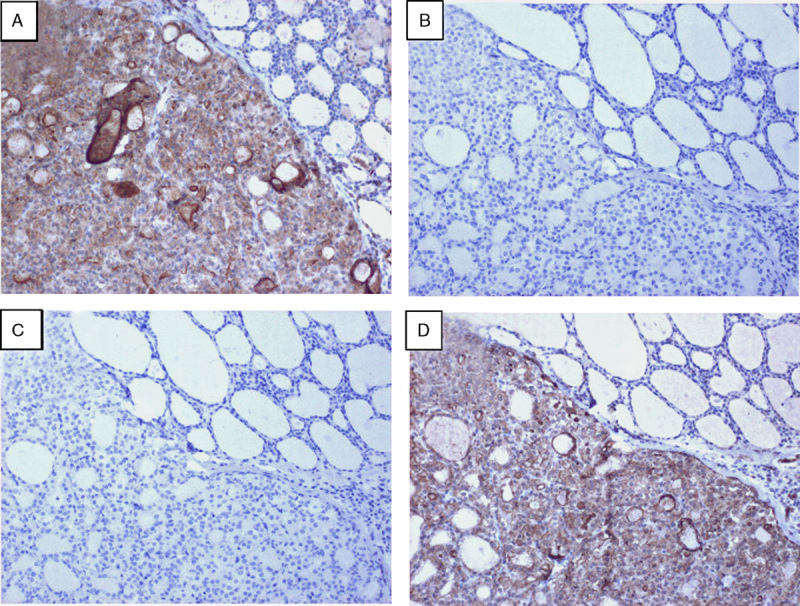
Specific pan-RTK IHC staining observed in a thyroid carcinoma confirmed by NGS to harbor an ETV6:NTRK3 fusion. Serial sections from this sample were sequentially stained with the pan-RTK antibody cocktail (A), or with individual antibodies against ALK (B), ROS1 (C), or pan-TRK (TrkA, TrkB, TrkC) (D) and developed with DAB to detect protein expression for these targets. All images were taken at 10× magnification. IHC indicates immunohistochemistry; NGS, next-generation sequencing; RTK, receptor tyrosine kinase.
Performance of the IHC Screening Test
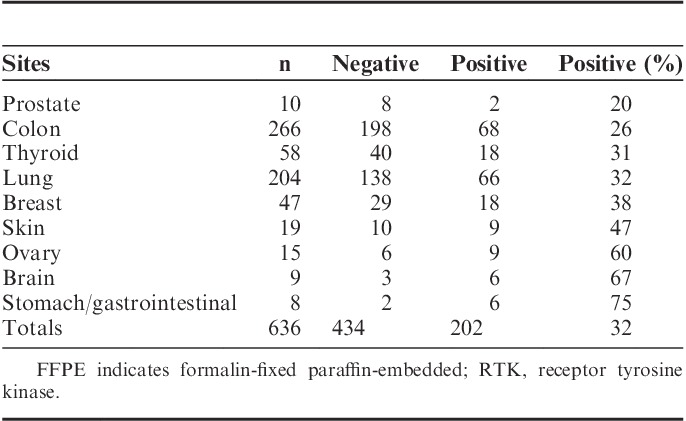
The level of staining prevalence of the pan-RTK IHC assay across FFPE samples of multiple histologies (n=636) is shown in Table 2. Although some tumor tissues had a higher proportion that demonstrated positive staining (eg, brain 67%, ovary 60%, stomach/GI 75%), the overall average indicated that approximately 60% to 70% of specimens are not demonstrating significant staining by the pan-RTK IHC and would thus be removed from further consideration by NGS-based testing for gene rearrangements. Therefore, an average of 30% of samples would proceed to the custom NGS assay to be investigated for the presence of gene rearrangements within NTRK1, NTRK2, NTRK3, ROS1, or ALK.
TABLE 2.
Prevalence of FFPE Tissues Staining for the pan-RTK Antibody Cocktail Across Multiple Tumor Histologies
NGS Sample Input Quality
To detect gene rearrangements, FFPE samples are sequenced on an RNA-based NGS assay platform. As FFPE RNA is known to be labile, causing it to be susceptible to fragmentation, chemical modifications, and refractory to enzymatic manipulations, there is the possibility that there will be an insufficient quantity of RNA to reliably sequence a gene rearrangement, resulting in a false-negative final result. To address this risk, we performed a qPCR-based RNA QC assay. The RNA QC assay uses the VCP housekeeping gene to determine the integrity of amplifiable RNA in extracted FFPE samples and reports the results as a Ct value. We confirmed that the Ct values of the RNA QC assay correlate inversely with RNA sequencing coverage in FFPE samples, whereby increased Ct values yielded less sequencing coverage and would indicate a poor quality sample (Fig. 3A). To demonstrate that the RNA QC assay provides accurate RNA quality metrics, artificial RNA fragmentation was performed by Covaris shearing on FFPE embedded cell lines harboring gene rearrangements (Fig. 3B) and a time course of zinc (Zn)-mediated fragmentation on varying FFPE tissue types (Supplemental Digital Content 1, http://links.lww.com/AIMM/A116). Covaris shearing generated smaller size RNA fragments in all samples (Fig. 3B). When sheared, the U-118 MG cell line lost detection of the GOPC:ROS1 rearrangement, which was present in the unmodified sample (Fig. 3B and data not shown). These data indicated that detection of gene rearrangements by the NGS assay can be lost in highly fragmented RNA (Fig. 3B and data not shown). The RNA QC assay was performed on each of these samples. The Ct values for the unmodified samples for all 3 cell lines ranged from 24.89 to 25.91 (Fig. 3B, left column, data not shown), whereas the Ct values for the sheared samples from all 3 cell lines ranged from 27.82 to 28.35 (Fig. 3B, right column, data not shown). Smaller RNA fragments generated through Zn-mediated fragmentation, with longer fragmentation time leading to shorter fragments, correlated with increased RNA QC Ct values (Supplemental Digital Content 1, http://links.lww.com/AIMM/A116). Together, these data demonstrate that the RNA QC assay is able to identify the quality, as a function of fragmentation, of the input RNA into the assay.
As FFPE nucleic acid stability is known to decrease with age,15 it is useful to understand the percentage of blocks passing the RNA QC Ct threshold as a function of age. The RNA QC Ct value increased in FFPE samples of increased age, indicating decreased quality of RNA in older FFPE samples [Fig. 3C; significant linear trend (P<0.0001)]. These results show that older archival samples, such as those that may be used in retrospective cohort studies, generally have Ct values of >29, which indicates that they are of lower quality and thus gene rearrangements may be difficult to detect. However, more recent specimens (<1 y from embedding), such as those commonly used in the clinical setting, will generally have Ct values of <29.
A primary use of the RNA QC assay is to determine the quantity of RNA input that is required for a reliable NGS result from a FFPE tissue sample. The ability to sequence a sample is based not solely on the overall quality, but also the quantity of RNA fragments capable of amplifying targeted regions. This effect is demonstrated by the fact that if input quantity remains constant at 200 ng across FFPE tissues of varying quality, the percentage of RNA reads is not constant (Fig. 3D). RNA mass alone is inadequate for predicting the quality of an RNA NGS library and the amount of RNA available for library generation varies per nanogram of input across samples. We used a cohort of FFPE tissues and cell lines and categorized them as “high quality” (Ct<26), “medium quality” (26≤Ct<29), and “low quality” (Ct>29). These specimens were run at different input quantities (Fig. 3E). A trend is observed in that, samples of higher initial quality, measured by a lower Ct value, required less input quantity and still resided below the RNA QC threshold, whereas to support mid-range to poor quality FFPE clinical samples, a higher amount of input was required to meet the RNA QC threshold (Fig. 3E). These data demonstrate that although it may be possible to use smaller amounts of input material from recent clinical testing specimens, for retrospective studies using older archival tissues, it may be better advised to start with a higher initial test input of 200 ng of RNA. Taken together, performing the RNA QC assay on all samples and starting with an input of 200 ng of RNA enables a confidence in negative results when testing FFPE samples with varying ranges of age, quality, and preanalytical conditions for tissue preparation.
Accuracy and Precision of the NGS Test
To demonstrate accuracy of the test, we qualitatively assessed the presence or absence of gene rearrangements in 66 samples of multiple FFPE tumor types and FFPE-embedded cell line models (Supplemental Digital Content 2, http://links.lww.com/AIMM/A117). The testing cohort included at least 1 known positive sample for each target receptor (NTRK1, NTRK2, NTRK3, ROS1, and ALK). At the exon-exon level, Sanger sequencing confirmed all of the 15 samples found to be positive by NGS sequencing, resulting in 100% positive agreement across all specimens (Supplemental Digital Content 2, http://links.lww.com/AIMM/A117).
To demonstrate the qualitative reproducibility of detecting gene rearrangements, 3 FFPE-embedded cell lines with known gene rearrangements (KM12; TPM3:NTRK1, HCC78; SLC34A2:ROS1, KARPAS-299; NPM1:ALK) and 1 IHC-positive FFPE lung tumor tissue specimen with a known ALK gene rearrangement (EML4-ALK) were run in triplicate through the NGS assay. All samples showed increased, reproducible, expression (as assessed by the median number of RNA reads across primers) at the rearranged receptor kinase domain and no significant expression for all other receptors (Fig. 4). The exceptions in cases of known overexpression of the full length protein (TrkA in KARPAS-299, Fig. 4B) and elevated basal expression (ROS1 in lung, Fig. 4D). These data were additionally reproduced by performing the NGS assay on FFPE tumor tissue samples containing either an ALK rearrangement (EML4:ALK), an ETV6:NTRK3 rearrangement, or negative for gene rearrangements in these targets. Samples were run by 2 different operators on 2 different days and were assessed qualitatively for gene rearrangements in each replicate (Supplemental Digital Content 3, http://links.lww.com/AIMM/A118). Testing resulted in 100% precision of these samples (Supplemental Digital Content 3, http://links.lww.com/AIMM/A118). These data indicate that this test is accurate and robust in detecting gene rearrangements within the regions covered in this diagnostic test.
FIGURE 4.
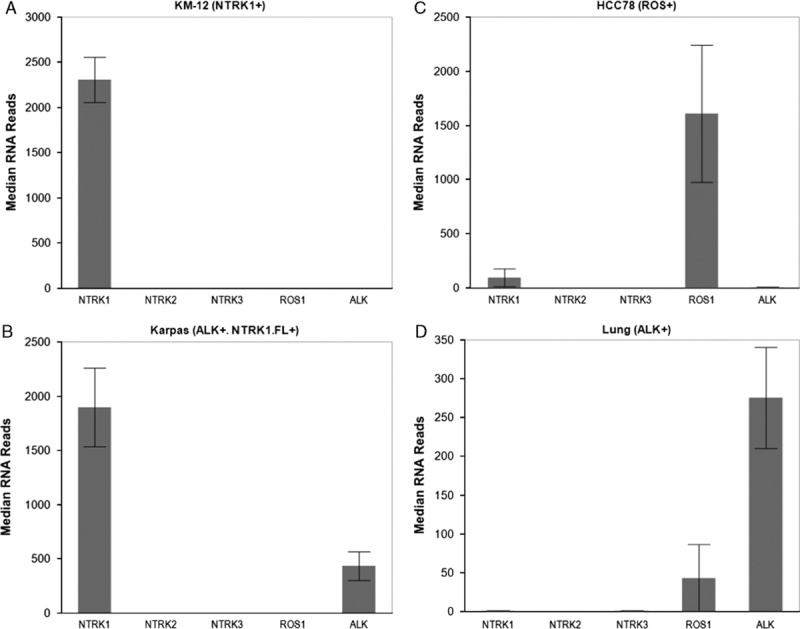
FFPE-embedded cell lines with known gene rearrangements in NTRK1 (KM-12, A), ALK with overexpression of full length NTRK1 (NTRK1 FL+) (KARPAS-299, B), ROS1 (HCC78, C), and a lung adenocarcinoma tumor with an EML4:ALK gene rearrangement (D) were run in triplicate using the NGS assay. Samples were then examined for median unique RNA reads for each gene rearrangement receptor (NTRK1, NTRK2, NTRK3, ROS1, and ALK). FFPE indicates formalin-fixed paraffin-embedded; NGS, next-generation sequencing.
Demonstration of Overall Test Performance
A subset of specimens (n=192) from Table 2, representing colorectal cancer (n=90), lung cancer (n=74), and thyroid cancer (n=28), was scored by IHC and sequenced to determine the presence of gene rearrangements using the assay methods described here (Fig. 5A). For each of the tumor types, using NGS testing as the reference standard for gene rearrangement detection, the IHC demonstrated 100% positive agreement [CI (colon), 48%-100%; (thyroid): 55%-100%; (lung): 20%-100%], thus there were no specimens that were determined to harbor gene rearrangements that were initially classified as IHC negative (Fig. 5A). Negative agreements ranged from 86% to 95% [CI (colon), 60%-64%; (thyroid): 74%-78%; (lung): 41%-43%), indicating that the majority of IHC-positive samples did not harbor gene rearrangements (Fig. 5A). Nevertheless, these data demonstrated that the pan-RTK IHC test has 100% negative predictive value for gene rearrangement detection in all 3 tumor types tested across 192 specimens [CI (colon), 95%-100%; (thyroid): 95%-100%; (lung): 95%-100%]. Consequently, of 192 samples tested in this cohort, 86 samples were found to be IHC positive (45% positivity) (Fig. 5A). However, the fusion prevalence within the IHC positive population was 9% demonstrating an enrichment of fusion positive samples within a population of clinical samples, which would have been 4% without the addition of IHC screening.
FIGURE 5.
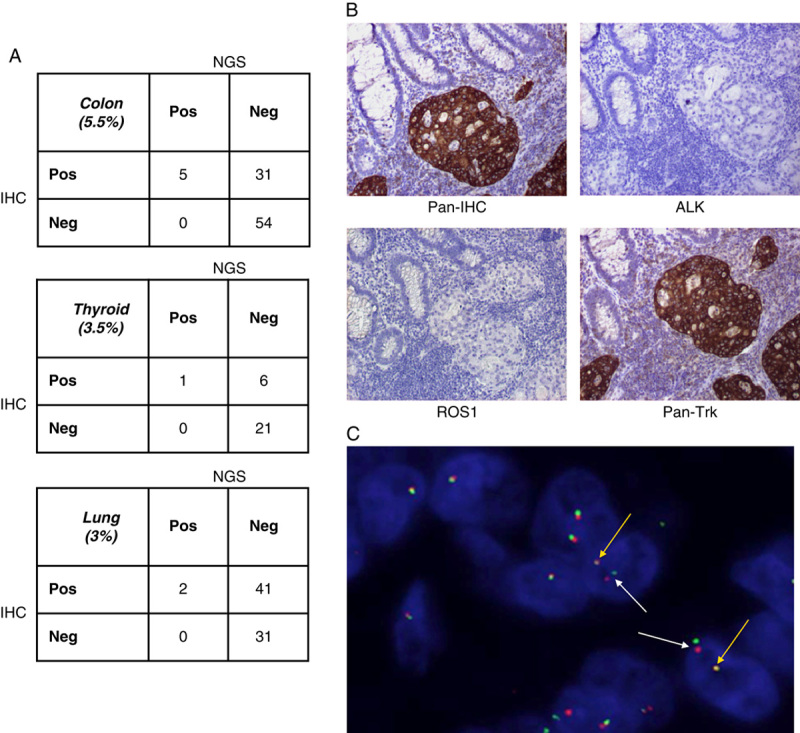
Clinical relevance and results of using pan-RTK IHC screening followed by NGS to detect gene rearrangements. A, Clinical FFPE samples (colon, thyroid, and lung cancer) were stained with a pan-RTK antibody cocktail; IHC was performed and samples were qualitatively scored as negative or positive for expression of the proteins. RNA extracted from these samples was run on the NGS assay and qualitatively assessed for detection of gene rearrangements. IHC and NGS data were correlated for positive and negative agreement between protein expression by IHC and detection of gene rearrangement by NGS. B, Example of a clinical patient sample harboring a TPM3:NTRK1 gene rearrangement detected by the NGS assay and run through the pan-RTK IHC (top left panel) as well as individual IHC stains for ALK (top right panel), ROS1 (bottom left panel), and Pan-Trk (bottom right panel). All images were taken at 10× magnification. C, The clinical patient sample in (B) was stained by FISH using NTRK1 break-apart gene rearrangement probes and examined for NTRK1 gene rearrangement positivity. White arrows indicate NTRK1 fusion positive cells and yellow arrows indicate wild-type NTRK1 expression. FFPE indicates formalin-fixed paraffin-embedded; FISH, fluorescence in-situ hybridization; IHC, immunohistochemistry; NGS, next-generation sequencing; RTK, receptor tyrosine kinase.
A representative clinical sample of colorectal adenocarcinoma from a 71-year-old female patient was run through the 2-step assay for detection of gene rearrangements in NTRK1, NTRK2, NTRK3, ROS1, or ALK. The clinical sample underwent pan-RTK IHC screening, which resulted in IHC positivity (Fig. 5B upper left panel). Also shown are the staining patterns for the individual antibodies pan-Trk, ROS1, and ALK (Fig. 5B). The IHC for ROS1 and ALK is negative (Fig. 5B, upper right panel and lower left panel, respectively), whereas the IHC staining for pan-Trk expression is positive and strong (Fig. 5B, lower right panel). Sequencing of this sample by the NGS assay resulted in identification of a TPM3:NTRK1 gene rearrangement. The 3′ end of TPM3, at exon 8, is fused to the 5′ end of exon 10 of NTRK1. This particular gene rearrangement is one of the first NTRK1 fusions to have been reported in colorectal cancer and has been shown to be a potential target of therapeutic intervention by the Trk inhibitor, entrectinib.12 Break-apart FISH further confirmed the presence of an NTRK1 fusion (Fig. 5C). Patient-derived cells from this patient have been shown to be sensitive to inhibition by the TrkA inhibitor (entrectinib).12 Together, these data demonstrate the efficacy of using a pan-RTK IHC assay to effectively screen clinical samples for passage to an NGS based assay that provides an accurate assessment of the presence of gene rearrangements.
DISCUSSION
We have demonstrated that a pan-RTK IHC screen enhances detection of gene rearrangements in a clinical population (9% prevalence vs. ~4% prevalence). This approach has significant therapeutic and clinical implications in that many gene rearrangements are rare, and thus it is costly for health care providers to identify those patients that would respond to targeted therapy. There is now a precedent of IHC screening for individual RTK gene rearrangements and an FDA-approved companion diagnostic IHC test for ALK. Since tissue availability is also limited for many cancer patients, it is not efficient, both for cost and tissue consumption, to run serial IHC tests for each RTK being tested. We have developed a multiplexed IHC method that identifies samples that may harbor gene rearrangements that will be confirmed by subsequent NGS testing. In a clinical setting, the pan-RTK IHC test allows for the rapid reporting of negative specimens, thus allowing patients to find alternative testing. We have proven here that this method is capable of detecting pan-Trk (TrkA, TrkB, TrkC), ROS1, and ALK expression that is associated with gene rearrangements and has a 100% negative predictive value for screening out samples that do not possess gene fusions.
IHC staining has previously been performed using a cocktail of antibodies for many diagnostic tests. The concern has always been that the specificity is insufficient to report a diagnostic result. We see similar results in the specificity for detection of gene fusions with this pan-RTK antibody cocktail. Pan-RTK IHC-positive samples exhibiting strong staining yielded a negative NGS result for gene rearrangement in far more samples than those that yielded a positive NGS gene rearrangement result. This observation is most likely due to other biological contributions that lead to measurable expression by IHC, such as basal expression and the scoring having intentionally been calibrated to favor sensitivity. This effect could explain the higher pan-RTK IHC-positive rates in some tumor types such as brain, skin, and ovary that are reported to express these target genes.16–19 The clinical relevance of variable expression of these receptors remains largely unknown. However, it has been concluded that in certain tissue types, overexpression of Trk proteins is tumor promoting. One example is glioblastomas where TrkB is overexpressed and, when pharmacologically inhibited, tumor burden can be reduced.16 In addition, a more stringent IHC scoring criteria has been subsequently developed to determine positivity based on >50% tumor cells with intermediate to strong staining. The hope is that this increased stringency will enrich the population further, and such an effect will be monitored in future cohorts. Although the apparent discordance between IHC and NGS is primarily based on IHC positivity yielding negative gene rearrangements, it is important to note that data have shown that IHC staining loss due to improper preanalytical conditions could lead to lead to false-negative IHC staining in samples that do actually harbor gene rearrangements.20 However, most preanalytical conditions due to improper fixation parameters, such as time and temperature, can have strong impact on immunohistochemical staining results21 and concomitantly impact RNA quality and the ability to detect gene rearrangements.22
The NGS assay uses RNA-based sequencing by AMP chemistry to detect gene rearrangements. The advantage of RNA sequencing is that less sequencing is required relative to a DNA-based assay due to the splicing of intronic regions during mRNA generation. In addition, fusion transcripts are often amplified, which enhances the sensitivity of an RNA-based assay relative to a DNA-based assay, enabling a more sensitive test for gene rearrangements by removing the issues of reading through large intronic regions. Furthermore, detection of expressed transcripts adds value in that RNA expression often leads to fusion protein expression and disease progression. The primary concern of RNA use is its labile nature, which can be exacerbated during the FFPE archival process.15 Extracted RNA that has been highly damaged consists largely of fragments that are too short to be informative and/or will not contribute to library preparation and subsequent sequencing, making it difficult to confidently discern negative results from a specimen without knowing the quality of the input RNA. We have demonstrated here that by using RNA QC Ct values, we are able to characterize RNA quality within a sample; RNA quality represents an inherent limitation to the sensitivity and reproducibility of the test.
We have demonstrated the accuracy of our pan-RTK IHC combined with RNA-based NGS assay through the identification of a TPM3:NTRK1 fusion in a colorectal cancer patient. A PDx mouse model was generated from this patient and patient-derived cells were cultured in the presence and absence of entrectinib, an RTK inhibitor targeting the TrkA receptor.12 These PDCs responded to treatment as monitored by the downregulation of pharmacodynamic markers and decreased tumor growth; demonstrating that detection of this gene rearrangement can enable potential clinical benefit through treatment and that our test can accurately identify patients that have a high probability of responding to RTK inhibitors targeting gene rearrangements.
Gene rearrangements are rare in the overall population; however, targeted RTK therapies provide viable treatment options.1 The diagnostic challenge is to find a method that allows rapid, accurate testing of a large number of patients. The 2-step diagnostic test presented in this paper demonstrates a method to rapidly screen a large population of patients to identify a small percentage who harbor gene rearrangements. This method allows for the screening of negative patient specimens quickly and inexpensively and reflexes putatively positive samples to higher resolution multiplexed NGS-based testing. One can envision that through the use of digital slide imaging and analysis, the IHC portion of the test could be automated to accommodate high volume and reduce any potential intersite or intrasite subjective biases. Although the test described here is based on 5 specific markers that have importance in precision medicine therapeutics, the fundamental approach is more broadly applicable. Both the IHC and the NGS could be modified to incorporate a different set of specific testing biomarkers.
Supplementary Material
Supplemental digital content is available for this article. Direct URL citations appear in the printed text and are provided in the HTML and PDF versions of this article on the journal's Website, www.appliedimmunohist.com.
Footnotes
The authors declare no conflict of interest.
REFERENCES
- 1.Shaw AT, Hsu PP, Awad MM, et al. Tyrosine kinase gene rearrangements in epithelial malignancies. Nat Rev Cancer. 2013;13:772–787. [DOI] [PMC free article] [PubMed] [Google Scholar]
- 2.Shaw AT, Ou Sai-Hong I, Bang Yung-Jue, et al. Crizotinib in ROS1—rearranged non–small-cell lung cancer. N Engl J Med. 2014;371:1963–1971. [DOI] [PMC free article] [PubMed] [Google Scholar]
- 3.Kwak EL, Bang Yung-Jue, Camidge D Ross, et al. Anaplastic lymphoma kinase inhibition in non-small-cell lung cancer. N Engl J Med. 2010;363:1693–1703. [DOI] [PMC free article] [PubMed] [Google Scholar]
- 4.Bergethon K, Shaw Alice T, Ignatius Ou Sai-Hong, et al. ROS1 rearrangements define a unique molecular class of lung cancers. J Clin Oncol. 2012;30:863–870. [DOI] [PMC free article] [PubMed] [Google Scholar]
- 5.Davies KD, Le Anh T, Theodoro Mariana F, et al. Identifying and targeting ROS1 gene fusions in non-small cell lung cancer. Clin Cancer Res. 2012;18:4570–4579. [DOI] [PMC free article] [PubMed] [Google Scholar]
- 6.Wu W, Choudry H. Next Generation Sequencing in Cancer Research. Next Gener Seq Cancer Res. 2013;1:75–90. [Google Scholar]
- 7.Oliver GR, Hart SN, Klee EW. Bioinformatics for clinical next generation sequencing. Clin Chem. 2015;61:124–135. [DOI] [PubMed] [Google Scholar]
- 8.Metzker ML. Sequencing technologies—the next generation. Nat Rev Genet. 2010;11:31–46. [DOI] [PubMed] [Google Scholar]
- 9.Park G, Kim TH, Lee HO, et al. Standard immunohistochemistry efficiently screens for anaplastic lymphoma kinase rearrangements in differentiated thyroid cancer. Endocr Relat Cancer. 2014;22:55–63. [DOI] [PubMed] [Google Scholar]
- 10.Blackhall FH, Peters Solange, Bubendorf Lukas, et al. Prevalence and clinical outcomes for patients with ALK-positive resected stage I to III adenocarcinoma: results from the European Thoracic Oncology Platform Lungscape Project. J Clin Oncol. 2014;32:2780–2787. [DOI] [PubMed] [Google Scholar]
- 11.Sholl LM, Sun Heather, Butaney Mohit, et al. ROS1 immunohistochemistry for detection of ROS1-rearranged lung adenocarcinomas. Am J Surg Pathol. 2013;37:1441–1449. [DOI] [PMC free article] [PubMed] [Google Scholar]
- 12.Lee SJ, Li GG, Kim ST, et al. NTRK1 rearrangement in colorectal cancer patients: evidence for actionable target using patient-derived tumor cell line. Oncotarget. 2015;6:1–8. [DOI] [PMC free article] [PubMed] [Google Scholar]
- 13.Zheng Z, Liebers Matthew, Zhelyazkova Boryana, et al. Anchored multiplex PCR for targeted next-generation sequencing. Nat Med. 2014;20:1479–1484. [DOI] [PubMed] [Google Scholar]
- 14.Ardini E, Bosotti Roberta, Borgia Andrea Lombardi, et al. The TPM3-NTRK1 rearrangement is a recurring event in colorectal carcinoma and is associated with tumor sensitivity to TRKA kinase inhibition. Mol Oncol. 2014;8:1–13. doi:10.1016/j.molonc.2014.06.001. [DOI] [PMC free article] [PubMed] [Google Scholar]
- 15.Ludyga N, Grünwald Barbara, Azimzadeh Omid, et al. Nucleic acids from long-term preserved FFPE tissues are suitable for downstream analyses. Virchows Arch. 2012;460:131–140. [DOI] [PubMed] [Google Scholar]
- 16.Brodeur GM, Minturn Jane E, Ho Ruth, et al. Trk receptor expression and inhibition in neuroblastomas. Clin Cancer Res. 2009;15:3244–3250. [DOI] [PMC free article] [PubMed] [Google Scholar]
- 17.Tapia V, Gabler Fernando, Muñoz Marcela, et al. Tyrosine kinase A receptor (trkA): a potential marker in epithelial ovarian cancer. Gynecol Oncol. 2011;121:13–23. [DOI] [PubMed] [Google Scholar]
- 18.Ren H, Tan ZP, Zhu X, et al. Identification of anaplastic lymphoma kinase as a potential therapeutic target in ovarian cancer. Cancer Res. 2012;72:3312–3323. [DOI] [PubMed] [Google Scholar]
- 19.Polsky D, Cordon-Cardo C. Oncogenes in melanoma. Oncogene. 2003;22:3087–3091. [DOI] [PubMed] [Google Scholar]
- 20.Nkoy FL, Hammond Elizabeth H, Rees William, et al. Variable specimen handling affects hormone receptor test results in women with breast cancer: a large multihospital retrospective study. Arch Pathol Lab Med. 2010;134:606–612. [DOI] [PubMed] [Google Scholar]
- 21.Gundisch S, Annaratone Laura, Beese Christian, et al. Critical roles of specimen type and temperature before and during fixation in the detection of phosphoproteins in breast cancer tissues. Lab Invest. 2015;95:561–571. [DOI] [PMC free article] [PubMed] [Google Scholar]
- 22.Bussoloti G, Annaratone Laura, Medico Enzo, et al. Formalin fixation at low temperature better preserves nucleic acid integrity. PLoS One. 2011;6:e21043. [DOI] [PMC free article] [PubMed] [Google Scholar]
Associated Data
This section collects any data citations, data availability statements, or supplementary materials included in this article.
Supplementary Materials
Supplemental digital content is available for this article. Direct URL citations appear in the printed text and are provided in the HTML and PDF versions of this article on the journal's Website, www.appliedimmunohist.com.