

Abstract
As cancer incidence varies according to age, it is important to rule out differences in age structures in any comparison. A common way of adjusting for these differences is using direct age standardization, which applies age-specific weights from a standard population. Eurostat has recently introduced a revised European standard population (RESP). The effect of using the new standard, in comparison with that introduced in 1976 [European standard population (ESP)], is evaluated. Cancer incidence data for prostate and testis cancer for Denmark, Finland, Sweden, Norway, and Iceland from the NORDCAN web site, and for Ireland and Italy-Genoa from Cancer Incidence in five Continents-X, were analyzed. Incidence rates were directly age standardized using ESP and RESP. The RESP conferred greater weight to adults and the elderly than the ESP. For prostate cancer, age-standardized rates computed with RESP are consistently higher by between 50 and 60% than those computed with ESP. However, the use of RESP, instead of ESP, has little impact on the pattern of time trends, the relative ranking of countries, the values of relative risks, or the percentage differences between age-standardized rates. For testis cancer, RESP and ESP provide very similar results because this cancer is more common in young men. Both ESP and RESP are in circulation. It is, therefore, important that European cancer registries reach consensus on a single standard to use to avoid erroneous comparisons of data computed with different standards. Given that Eurostat recently introduced RESP and is using this standard for data collected from the European Union Member States, it would make sense to rally behind RESP.
Keywords: cancer incidence, epidemiology, Europe, harmonization, population registries, standardization
Introduction
Cancer incidence rates may vary by a factor of up to 1000 depending on the age bracket. Notwithstanding that some cancers are typical in childhood, the frequency of cancer diagnosis generally increases with age, with the highest incidence rates observed in the elderly. This means that in any comparison of crude cancer incidence rates (number of new cases/population where cases were detected), either between different populations or within the same population but at different time periods, the effect of dissimilarities in the age structures has to be compensated for.
The most frequently used method for calculating age-standardized rates is ‘the direct method’ (Wolfenden, 1923). This technique is based on the use of a standard population, a population with a predefined age-specific structure. The standard population is used to weigh the age-specific incidence rates in the populations under comparison. The resulting age-standardized rates (ASR) are the incidence rates that we would expect to observe in the study population if the population had exactly the same age distribution as the standard itself.
Some official standard populations are used widely for comparing cancer incidence rates – for example, the world standard population, which was originally proposed in 1960 as the pooled population of 46 countries (Segi, 1960) and, thereafter, slightly modified in 1966 (Doll et al., 1966) and updated in 2000 as the average projected world 2000–2025 population age structure (Ahmad et al., 2000). The European standard population (ESP) was introduced in 1976 (Waterhouse et al., 1976) on the basis of the age structure of several Scandinavian populations.
Recently, a revised European standard population (RESP) has been adopted by Eurostat, the European Commission’s Directorate General responsible for statistical information (Eurostat, 2013). This revised standard population is more representative of the current age structure of the European Member States’ populations with a growing percentage of old and very old individuals (Eurostat, 2013).
The aim of this paper is to evaluate the practical implications of using RESP, in comparison with the currently widely used ESP, in terms of a geographical comparison of cancer incidence rates and trends.
Materials and methods
We used the summary cancer incidence data, available on the web, from the NORDCAN project (http://www-dep.iarc.fr/NORDCAN). The NORDCAN project provides a database of the Nordic countries (Denmark, Iceland, Finland, Norway, Sweden, Faroe Islands, and Greenland) from where it is possible to produce incidence, mortality, prevalence, and survival statistics of major cancers (Engholm et al. 2015).
The age distribution (0–14, 15–24, 25–49, 50–64, 65–79, and 80+ years) of ESP and RESP standard populations was compared with those of the analyzed countries and with the entire European Union (EU)-28 in 2013, and for Denmark also in 2004 (http://www.ec.europa.eu/eurostat).
For the purpose of this study, we selected incidence data for prostatic and testicular cancer (because of the contrast in their incidence patterns), from NORDCAN, in Denmark, Finland, Sweden, Iceland, and Norway, for the year 2013. Incidence data for Denmark, for the years 2004–2013, were used for the same cancers to evaluate the effect of different standard populations on incidence time trends.
Furthermore, to consider the heterogeneity in ages more closely, among European populations, we also analyzed prostate and testis cancer incidence data from Ireland (2003–2007) and from the Registry of Genoa in Italy (2003–2006) available from the Cancer Incidence in five Continents-X web site (http://ci5.iarc.fr/CI5-X). These two registries were chosen as Ireland has the youngest population in Europe (proportion of individuals aged ≥65 years, 12.2%) and Italy has the oldest population (≥65 years, 21.2%) (http://www.ec.europa.eu/eurostat). Among the Italian cancer registries, we chose Genoa, which has the oldest population in Italy (Italian Institute of Statistics; http://www.demo.istat.it).
We computed direct age-standardized incidence rates by multiplying the age-specific incidence rates with the corresponding age bracket weights of both the ESP and the RESP standard populations.
The RESP is based on the 2011–2030 population projections of the unweighted average age structure of the populations of EU-27 member states plus the European Free Trade Association: Iceland, Liechtenstein, Norway, and Switzerland. It divides the population into 5-year age bands (apart from the first two bands – corresponding to ages 0 and 1–4, respectively, and the highest band – corresponding to 95+) and normalizes the total population to 100 000 or 100 (Eurostat, 2013). According to the availability of data, on the NORDCAN web site and on the Cancer Incidence in five Continents-X web site, we could not consider the first (0 year) class of ESP and RESP and the upper age classes of RESP. Therefore, the direct age standardization was performed using 18 age classes from 0–4 to 85+ years.
Results
As shown in Fig. 1, RESP has a lower proportion of children and young adults in comparison with ESP. In contrast, the proportion of adults starts to become higher for RESP than for ESP from age 55–59 years onwards. In particular, the proportion of individuals aged 65 years or older is 19.5% for RESP versus 11% for ESP. These proportions are 5 versus 2% for age 80 or above and 2.5 versus 1% for age 85 or above.
Fig. 1.
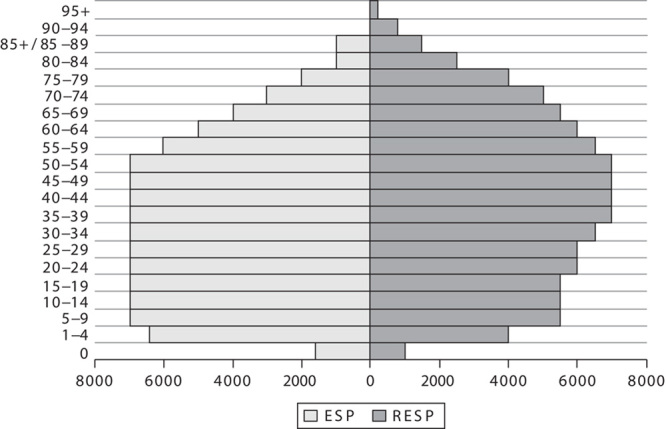
Pyramids of the weight (in thousands of individuals) of each age class in the European standard population (ESP) and in the revised European standard population (RESP).
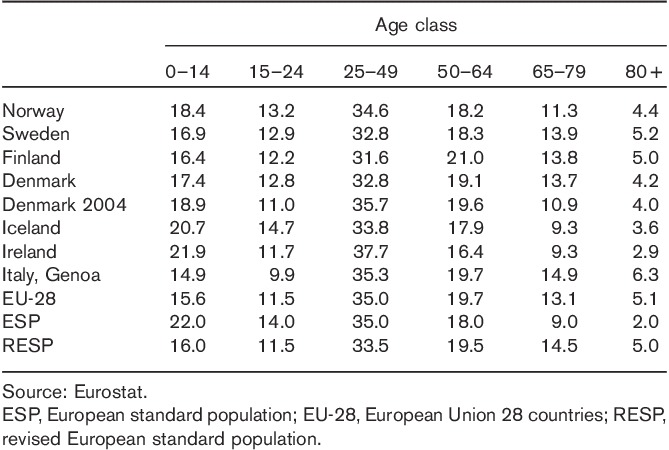
Table 1 shows that the populations of EU-28, Finland, Sweden, Denmark (2004 and 2013), and Italy-Genoa, are closer to RESP than to ESP, whereas Norway, Ireland, and Iceland are more similar to ESP, apart from the upper age band, where all countries, apart from Ireland, have an age structure closer to RESP.
Table 1.
Percentage distribution by age class of the resident population in the Nordic countries, Ireland, Italy-Genoa and in the average European Union 28 countries in 2013, and for Denmark also in 2004; percentage distribution for the same age groups in the European standard population and in the revised European standard population
The age-specific incidence rates for prostatic and testicular cancer are shown in Fig. 2, which clearly indicates their different patterns. Testicular cancer is characterized by the highest rates between the ages of 25 and 35, and is more frequent in this age bracket compared with prostatic cancer. The incidence of testicular cancer then decreases, whereas the incidence of prostatic cancer steadily increases with age. The increase in prostatic cancer incidence is so marked that, by age 75, it reaches rates almost 1000 times greater than those of testicular cancer.
Fig. 2.
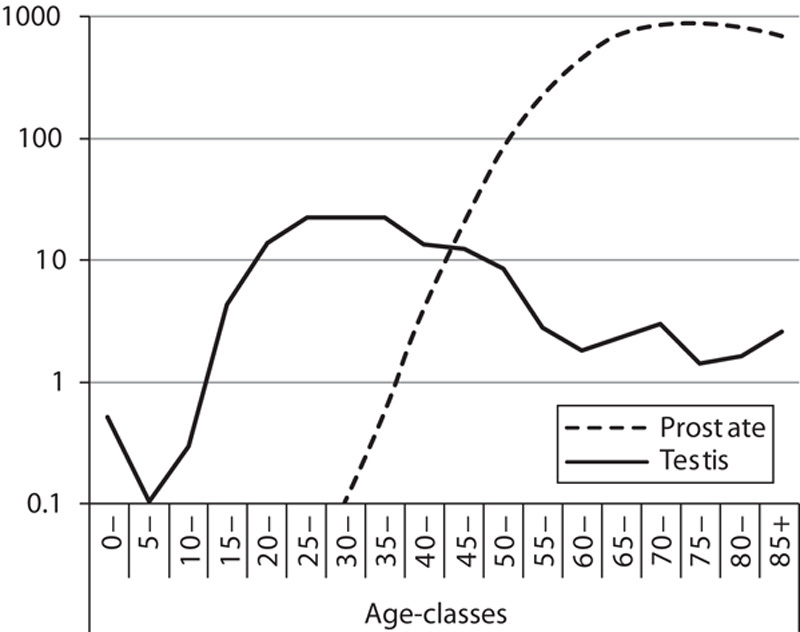
Age-specific incidence rates for prostatic and testicular cancer in Nordic countries in 2013. The ordinate, expressing frequency per 100 000 individuals in the different age groups, is on a logarithmic scale. Source: NORDCAN (http://www-dep.iarc.fr/NORDCAN).
Table 2 shows the crude, ESP-standardized, and RESP-standardized incidence rates, in the analyzed countries, for prostatic and testicular cancer. This comparison highlights important points for both cancers. First, there is no significant change in the relative ranking of countries using either ESP or RESP; second, there are no statistically significant differences between using ESP or RESP in relative risks (the ratio between ASRs referenced to the incidence in Norway) or of the percentage differences between ASRs (again referenced to the incidence in Norway); third, for testicular cancer, the percentage difference between ASRs is only around 5–10% lower for RESP than for ESP, whereas for prostatic cancer, this difference is markedly higher (between 50 and 60% higher for RESP than ESP). This difference is because of the fact that prostate cancer is essentially an older individual’s disease and RESP’s age weighting, in relation to Europe’s aging population, exerts a significant impact.
Table 2.
Crude and age-standardized incidence rates with the European standard population and with the revised European standard population in the Nordic countries, Ireland, and Italy-Genoa for prostatic and testicular cancer
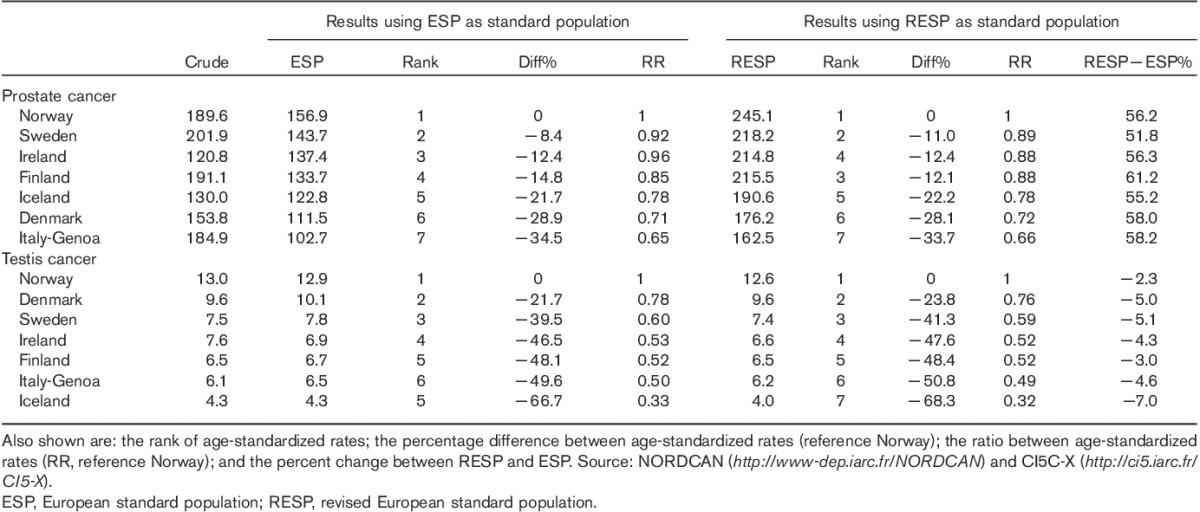
For populations with a greater proportion of young individuals (Ireland, Iceland, and Norway), crude rates are closer to ESP than to RESP, whereas the converse is true for the other countries, which are characteristic of an older population.
The latter observation is reinforced by Fig. 3, which shows the cancer incidence trends in Denmark from 2004 to 2013 for prostatic and testicular cancers. This figure plots the crude rates as well as the age-adjusted rates with ESP and RESP. For testicular cancer, ASR-ESP and ASR-RESP show almost the same levels of incidence and the same temporal pattern, whereas for prostatic cancer, although the ASR-ESP and the ASR-RESP follow the same temporal pattern, the two curves differ by more than 50 cancer cases per 100 000 men per year. It is also interesting to note that, for both cancers, crude rates were slightly closer to ESP-adjusted rates at the beginning of the analyzed period (2004) and to RESP-adjusted rates at the end of the time period (2013). This is primarily because of the shift in aging occurring over this time frame in the Danish population and the subsequent different proportions of men aged 25–49 and 65–79 years (corresponding to the different incidence peaks of the two types of cancer).
Fig. 3.
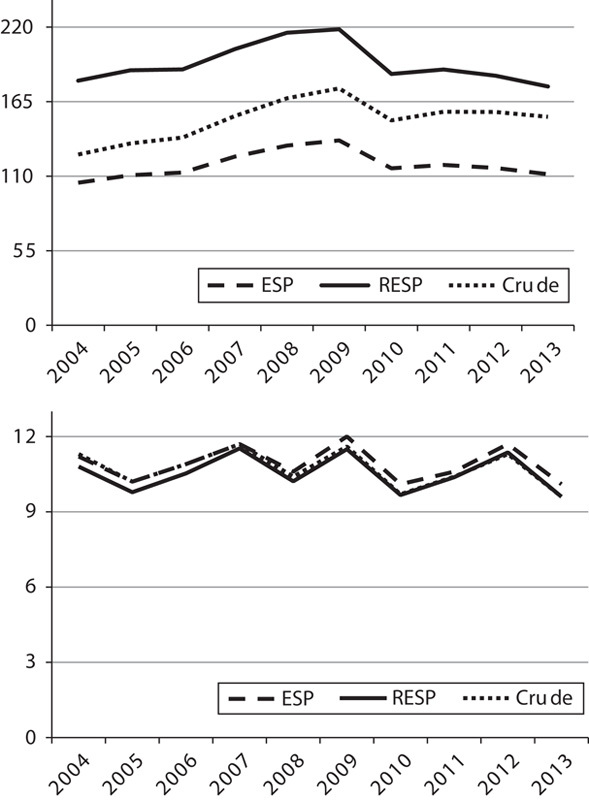
Prostatic (above) and testicular (below) cancer incidence rates in Denmark, 2004–2013 crude rates (crude), age-adjusted rates with the European standard population (ESP) and age-adjusted rates with the revised European standard population (RESP). Source: NORDCAN (http://www-dep.iarc.fr/NORDCAN).
Discussion
For comparison of cancer data across Europe, the ESP (Waterhouse et al., 1976) has been used extensively. A Eurostat Task Force recently agreed on a revised European Standard (RESP) representative of the current age structure of the European Member States’ populations with a growing percentage of old and very old individuals (Eurostat, 2013).
We compared ASRs for prostatic and testicular cancer using the two European standard populations (ESP and RESP) in five North European countries (Norway, Denmark, Sweden, Finland, and Iceland), as well as in Ireland (which has the youngest population in Europe) and in an Italian registry (which has the oldest one).
Prostate and testis cancers were chosen as an example of two cancers with different incidence rates in different age groups; however, the same results are also expected for other cancers with similar age-specific incidence rates among men or women.
This exercise showed that the selection of either population standard did not modify the comparisons markedly among the countries studied. This is consistent with previous studies carried out (Bray et al., 2002). In fact, the rank among countries, for the highest ASR incidence for prostatic and testicular cancer, almost did not change. The difference between ASRs was not markedly modified and neither were significant changes noted in the ratios among ASR.
We also evaluated the effect of ESP and RESP on prostatic and testicular cancer trends, in Denmark, during the time period 2004–2013, which showed that the time-trend curves of ASR with ESP and RESP are almost parallel and describe a very similar trend. There was a closer alignment of the crude rates to ESP at the beginning of the analyzed period, and thereafter, a closer alignment to RESP at the end of the period, because of the aging pattern occurring in the Danish population over this time frame.
The major difference between using ESP and RESP is in the actual size of the ASR. RESP lends more weight to the older age groups, whereas this has an almost imperceptible effect on the calculation of incidence rates of testicular cancers (ASRs-RESP slightly lower than ASRs-ESP); for prostatic cancer, the ASR-RESP were 50–60% higher compared with ASR-ESP.
The purpose of direct age standardization of cancer incidence rates is to enable meaningful comparisons, across countries and across time periods, avoiding the effect of differences in age structures that could otherwise result in incorrect conclusions. A standard population specifies predefined weights to the different age brackets of the population. Different standard populations (systems of weights) can be applied to the same real cancer incidence data to compute many (theoretically infinite) age-adjusted rates. ASRs are, therefore, artificial data that may – or may not – reflect the real (crude) rates depending on how accurately the standard population models the real population’s age structure.
Although the choice of a standard population is subjective, the desire to have as close a match as possible between the population standard and the real populations under analysis explains why many ‘local’ populations are used and adopted over time by various studies and organizations, such as the Surveillance, Epidemiology and End Results program – SEER in the USA (US 1940, 1950, 1960, 1970, 1980, 1990, and 2000) (National Cancer Institute, 2015); Canada (Canadian 1991 and 1996) (National Cancer Institute, 2015); Nordic countries (NORDCAN population in 2000) (Engholm et al., 2015); Australia (Australian Bureau of Statistics, 2015); and the INDEPTH standard population for low-income and middle-income countries (Sankoh et al., 2014). In this respect and for comparison of data at the global level, the world standard population remains a valid and indispensable standard (Ahmad et al., 2000).
The availability of more than one standard for a given region, however, poses the risk of erroneously comparing data computed against the different standards. This is currently the risk for Europe, given the two standards in circulation (ESP and RESP). The EU’s official body for the collection of Member State statistics, Eurostat, has adopted RESP on account of the aging population across the region. As a consequence, it would make inherent sense for complete adoption of RESP for comparison studies using European cancer data. Unfortunately, RESP has not been used widely in cancer epidemiology and cancer registration around the world, including Europe. In fact, RESP is not used at all in Scandinavia or in many other European countries benefiting from networks of cancer registries, such as Germany (Rudolph et al., 2015), Spain (Roman et al., 2013), France (Gilhodes et al., 2015), Italy (Crocetti et al., 2015), or Switzerland (Bodmer et al., 2015). The single exception is the UK, which adopted the RESP in January 2014 (ONS – Office for national statistics, UK, 2015).
Although the data available constrained us to compare different periods – 2013 for Nordic countries, and 2003–2006/2007 for Italy-Genoa and Ireland (during which incidence levels may well have changed), our task was not to make a reliable comparison of incidence levels across countries but rather to investigate the effect of using different standards for the comparison of cancer incidence across different countries.
Moreover, because of the same constraints, we could not use all the age classes of ESP and especially of RESP. It was, therefore, not possible to weigh age classes at the end of RESP (corresponding to 85–89, 90–94, and 95+ years) and to ‘adjust’ for their effect on cancer incidence if they were represented differently in the populations. Although this is unlikely to be relevant for testicular cancer (which is uncommon among the elderly), the incidence for prostatic cancer appears to decrease after the maximum peak reached around 70 years of age. This means that – if the true incidence for the age 90–94 years is lower than that for 85+ years, and for 95+ years lower than that for 90–94 years – a population with a greater proportion of men older than 90 years would have prostatic-cancer incidence overestimated in the age bracket 85+ years. However, it appears reasonable to ignore this effect in view of the Eurostat annual age-structure projections for 2013 for the analyzed countries (http://ec.europa.eu/eurostat/cache/metadata/en/proj_esms.htm), according to which the proportion of individuals aged 90–94, among all those in the age bracket of at least 85 years, varies from 25% in Finland to 29% in Sweden and Norway, and for individuals aged 95–99 years from 5% in Finland and Iceland to 7% in Denmark.
According to the results of our study, it is important that European cancer registries reach consensus on the single standard to use to avoid erroneous comparisons of data computed with the different standards. Indeed, the need for consensus is even more critical because of the potential complacency arising from the fact that for some cancers (e.g. testis cancer), the choice of standard makes little comparative difference. Such complacency, however, may lead to severely distorted analyses for those cases (e.g. prostate cancer) where there is a difference.
Conclusion
The harmonization of the use of the same standard population, in European countries, is necessary and urgent to avoid mistaken comparisons on the basis of different standard populations used in the calculation of ASR.
The UK’s decision to adopt the RESP is an appropriate and sensible example to follow. Adoption of the RESP, instead of ESP, would facilitate adequate reflection of current population structures in countries and regions in the EU and alignment with the European Institutions’ policy as shown by the EU’s official statistical office, Eurostat.
Acknowledgements
Conflicts of interest
There are no conflicts of interest.
References
- Ahmad OE, Boschi-Pinto C, Lopez AD, Murray CJL, Lozano R, Inoue M. (2000). Age standardization of rates: a New WHO Standard (GPE Discussion Paper Series: No 31. Geneva: World Health Organization. [Google Scholar]
- Australian Bureau of Statistics (2015). Which population to use for age standardisation?Available at: http://www.abs.gov.au/ausstats/abs@.nsf/Lookup/3101.0Feature+Article1Mar%202013 [Accessed 10 August 2015].
- Bodmer A, Feller A, Bordoni A, Bouchardy C, Dehler S, Ess S, et al. (2015). Breast cancer in younger women in Switzerland 1996-2009: a longitudinal population-based study. Breast 24:112–117. [DOI] [PubMed] [Google Scholar]
- Bray F, Guilloux A, Sankila R, Parkin DM. (2002). Practical implications of imposing a new world standard population. Cancer Causes Control 13:175–182. [DOI] [PubMed] [Google Scholar]
- Crocetti E, Buzzoni C, Dal Maso L, AIRTUM Working Group (2015). The risk of cancer is slightly higher among Italian cancer patients than in the general population. Epidemiol Prev 39:140. [Google Scholar]
- Doll R, Payne P, Waterhouse J. (1966). Cancer incidence in five continents: a technical report. Berlin: Springer-Verlag. [Google Scholar]
- Engholm G, Ferlay J, Christensen N, Kejs AMT, Johannesen TB, Khan S, et al. (2015). NORDCAN: cancer incidence, mortality, prevalence and survival in the Nordic countries, version 7.1 (09.07.2015). Association of the Nordic Cancer Registries. Danish Cancer Society. Available at: http://www.ancr.nu. [Accessed on 22 July 2015].
- Eurostat (2013). Revision of the European standard population: Report of the Eurostat’s task force. Luxembourg: European Union. [Google Scholar]
- Gilhodes J, Belot A, Bouvier AM, Remontet L, Delafosse P, Ligier K, Rogel A. (2015). Incidence of major smoking-related cancers: trends among adults aged 20-44 in France from 1982 to 2012. Cancer Epidemiol 39:707–713. [DOI] [PubMed] [Google Scholar]
- National Cancer Institute (2015). Surveillance, epidemiology, and end results program standard populations (millions) for age-adjustment. Available at: http://seer.cancer.gov/stdpopulations/. [Accessed 10 August 2015].
- ONS – Office for national statistics, UK (2015). Revised European Standard Population 2013 (2013 ESP). The impact of calculating cancer incidence rates using the 2013 European Standard Population. Available at: http://www.ons.gov.uk/ons/guide-method/user-guidance/health-and-life-events/revised-european-standard-population-2013--2013-esp-/index.html [Accessed 6 August 2015].
- Roman M, Rué M, Sala M, Ascunce N, Baré M, Baroja A, et al. (2013). Trends in detection of invasive cancer and ductal carcinoma in situ at biennial screening mammography in Spain: a retrospective cohort study. PLoS One 3:8. [DOI] [PMC free article] [PubMed] [Google Scholar]
- Rudolph C, Schnoor M, Eisemann N, Katalinic A. (2015). Incidence trends of nonmelanoma skin cancer in Germany from 1998 to 2010. J Dtsch Dermatol Ges 13:788–797. [DOI] [PubMed] [Google Scholar]
- Sankoh O, Sharrow D, Herbst K, Whiteson Kabudula C, Alam N, Kant S, et al. (2014). The INDEPTH standard population for low- and middle-income countries, 2013. Global Health Action, [S.l.], v. 7, March 2014. Available at: http://www.globalhealthaction.net/index.php/gha/article/view/23286. [Accessed 09 September 2015].
- Segi M. (1960). Cancer mortality for selected sites in 24 countries (1950–57). Sendai, Japan: Department of Public Health, Tohoku University of Medicine. [Google Scholar]
- Waterhouse JAH, Muir CS, Correa P, Powell J. (1976). Cancer incidence in five continents. Lyon: IARC; 3:456. [Google Scholar]
- Wolfenden HH. (1923). On the methods of comparing the mortalities of two or more communities and the standardization of death rates. J R Stat Soc 86:399–411. [Google Scholar]