

Abstract
One of the formative goals of genetics research is to understand how genetic variation leads to phenotypic differences and human disease. Genome-wide association studies (GWASs) bring us closer to this goal by linking variation with disease faster than ever before. Despite this, GWASs alone are unable to pinpoint disease-causing single nucleotide polymorphisms (SNPs). Noncoding SNPs, which represent the majority of GWAS SNPs, present a particular challenge. To address this challenge, an array of computational tools designed to prioritize and predict the function of noncoding GWAS SNPs have been developed. However, fewer than 40% of GWAS publications from 2015 utilized these tools. We discuss several leading methods for annotating noncoding variants and how they can be integrated into research pipelines in hopes that they will be broadly applied in future GWAS analyses.
Toward the Goal of Understanding Variation
Genome-wide association studies (GWASs) are a popular method of linking genomic variation with human disease and have produced over 100 000 genomic region–disease associations to date [1]. These studies are successful at narrowing down potential variants associated with a disease; however, they are incapable of determining causative single nucleotide polymorphisms (SNPs) on their own. GWAS variants are typically screened using a set of lead SNPs, which are informative but often not causative. The causative SNP may lie anywhere within the linkage disequilibrium (LD) block surrounding the lead SNP, but these can span over 100 kb and often contain over 1000 individual SNPs. Improvements in the identification of causative SNPs from GWASs will advance our understanding of disease mechanisms and reveal potential therapy targets.
Fine mapping techniques using high-throughput imputation have the potential to refine GWAS SNPs in LD loci down to a testable number, and can be used to make predictions of SNP associations with a phenotype when paired with statistical predictions of association, such as Bayesian refinement [2,3]. Indeed, combining fine mapping and functional annotations has yielded important discoveries. For example, Bauer et al. [4] identified a single variant in LD with a GWAS locus associated with hemoglobin disorders, which disrupts the motif of an enhancer in a regulator of fetal hemoglobin, BCL11A, and now represents an attractive therapeutic target for the treatment of hemoglobinopathies [4]. However, this methodology requires dense genotyping and large sample sizes, and may not be effective for all loci. Because of these challenges, researchers have now developed many computational tools designed to assist with the prioritization of GWAS SNPs to reduce the resources and time needed to experimentally validate causative SNPs [5,6].
Although the vast majority of GWAS-implicated SNPs are found in noncoding sequence, the majority of SNP annotation tools only annotate SNPs in coding regions of the genome [7]. This is in part because noncoding SNPs are more challenging to annotate than SNPs in coding regions where the consequences of variation are better understood. Landmark initiatives now provide sufficient data to begin the task of predicting and prioritizing functional SNPs in noncoding DNA. These include catalogs of human variation (1000 Genomes Project, International HapMap Project), annotations of functional elements [Encyclopedia of DNA elements (ENCODE)], and conservation information derived from multiple species alignments [8,9]. Since 2010, a handful of tools to annotate noncoding SNPs have been released. These tools provide hypotheses to the functional nature of noncoding SNPs, a powerful first step that reduces the pool of possible variants for experimental follow-up. However, many studies do not take advantage of these tools. In fact, of 44 GWASs released in 2015, only 16 use any sort of noncoding SNP annotations for variant follow-up (see Table S1 in the supplemental information online).
Regulatory variants can have dramatic effects on gene regulation. Kasowski et al. [10] and McDaniell et al. [11] initially demonstrated this on a genome-wide scale by showing allele-specific binding of the transcription factor (TF) nuclear factor-kappa B and CCCTC-binding factor (CTCF). Subsequently, Degner et al. [12] demonstrated that a single variant can result in both disruption of TF binding and alteration of chromatin accessibility. Other studies have demonstrated similar dramatic effects of noncoding variation on regulatory networks and gene expression control mechanisms [13,14]. These findings suggest a mechanistic link between regulatory variation and disease phenotypes.
It is clear that, by restricting experimental follow-up to easily classified variants, we likely miss a substantial proportion of variants directly relevant to disease. Through broad application of noncoding SNP annotation tools to GWAS, we can improve our understanding of genetic disease predispositions. In the following sections, we review several leading noncoding SNP annotation tools, examine their strengths and limitations, and discuss how they can be integrated into GWAS pipelines to augment their findings. Their incorporation will significantly accelerate discovery of disease-causal variants from GWASs and provide vital information to shape hypotheses about their function.
Annotation of Functional SNPs
Tools for SNP annotation can take advantage of diverse genomic data types to provide putative functional annotations or predict functional effects. Here, we divide the tools into three categories: functional, conservation, and machine learning based. While all of the tools reviewed here utilize functional data, conservation-based tools also include measures of conservation, and machine learning tools may incorporate multiple lines of evidence, including functional annotations and conservation.
Functional Annotation
GWAS SNPs have been shown to be enriched for functional annotations, with 81% of GWAS LD regions containing at least one functional SNP [15]. Many types of high-throughput assays are used to predict features associated with putative regulatory function in the noncoding genome, including DNase I hypersensitive sites sequencing (DNase-seq), assay for transposase-accessible chromatin with high-throughput sequencing (ATAC-seq), formaldehyde-assisted isolation of regulatory elements-sequencing (FAIRE-seq), TF ChIP-seq, histone modification ChIP-seq, and expression quantitative trait loci (eQTL) analysis (Figure 1) [16]. In some cases, genomic features such as distance from the nearest gene, guanine–cytosine content, predicted TF binding motifs, and manual annotations of published variants are also included. As many of these analyses identify cell-type-specific interactions, the range of conditions (cell-types, stages of development, etc.) for which data are available restricts the range of functional elements a tool is able to detect. In addition, these methods will miss functional elements that do not coincide with known annotation co-occurrence patterns. Examples of tools that annotate noncoding SNPs using only functional genomics information include the Ensembl Variant Effect Predictor (VEP), RegulomeDB, and Functional Identification of SNPs (FunciSNP) [17–19].
Figure 1. Data and Tools Used to Analyze Noncoding Variants.
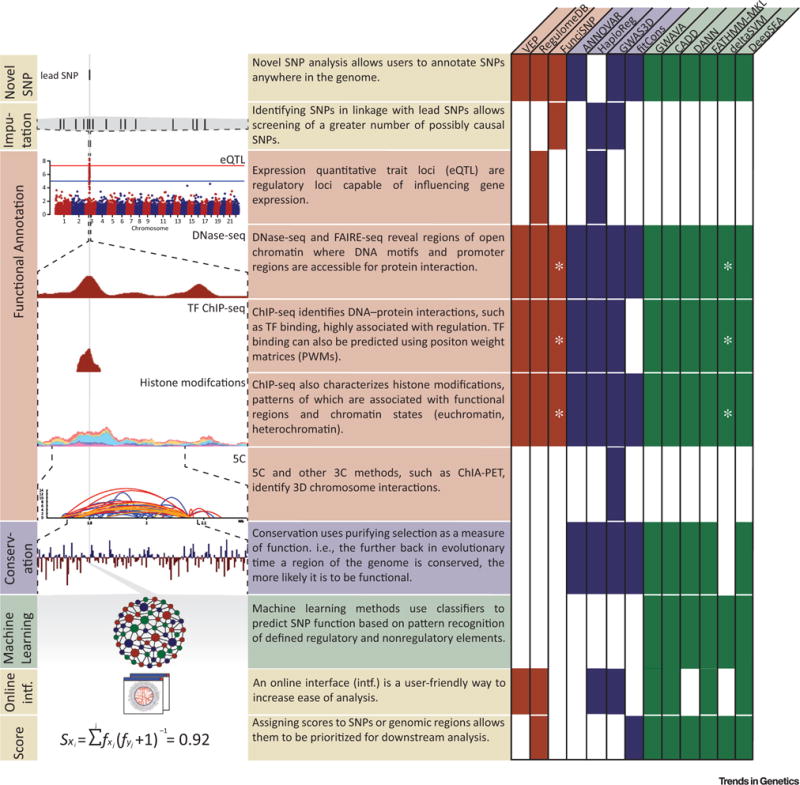
Single nucleotide polymorphism (SNP) aligned with functional (red) and conservation (blue) data, machine learning methods (green), and tool features (yellow). Each tool discussed in this perspective is labeled with annotation types used in its noncoding variant analysis platform. * represents optional input data sets supplied by the user. Abbreviations: 3C, chromosome conformation capture; 5C, chromosome conformation capture carbon copy; CADD, combined annotation-dependent depletion; ChIA-PET, chromatin interaction analysis by paired-end tag sequencing; DANN, deleterious annotation of genetic variants using neural networks; DNase-seq, DNase I hypersensitive sites sequencing; eQTL, expression quantitative trait loci; FAIRE, formaldehyde-assisted isolation of regulatory elements; FunciSNP, Functional Identification of SNPs; GWAVA, genome-wide annotation of variants; TF, transcription factor; VEP, Variant Effect Predictor.
Conservation
In addition to functional genomics data, including conservation data allows variants to be ranked based on well-accepted measures of evolutionary constraint. Conservation is typically determined by multiple sequence alignments, from which we can estimate rates at which different categories of genomic regions have evolved over time. Conservation can be measured by comparing the substitution rate within a genomic region of interest to an estimate of the neutral substitution rate. Regions with a significantly lower-than-expected substitution rate are considered to be conserved, and are therefore likely under functional constraint. However, because humans have likely undergone recent rapid adaptions in tissue-specific regulation, strict conservation-based approaches to regulatory element detection may miss critical human-only advancements in tissue types such as the brain [20]. Methods that integrate conservation into their annotation include ANNOVAR, HaploReg, GWAS3D, and fitCons [21–24].
Machine Learning
Machine learning algorithms have recently become popular for SNP annotation because of their multifaceted predictions based on robust statistical methods. These powerful tools are able to build complex predictive models of SNP function [25]. All these methods incorporate functional data and most incorporate conservation data to train their prediction models, each using different models and approaches. Though powerful, machine learning methods are susceptible to biases found in training sets and annotations such as enrichments of variants near genes, gaps in functional annotations, or overfitting due to suboptimal parameterization or insufficient training data. Much care is required to limit the effect these biases have on pattern prediction [26,27]. In addition, the basis for functional categorization may not be intuitive, as reasons for annotation may not be directly reported in the results. Current methods using machine learning to prioritize candidate functional variants include genome-wide annotation of variants (GWAVA), combined annotation-dependent depletion (CADD), deleterious annotation of genetic variants using neural networks (DANN), FATHMM-MKL, deltaSVM, and DeepSEA [26,28–32].
Importantly, the data sets used to train machine learning methods can alter which variants they call. As there is currently no gold-standard training set for detrimental noncoding variants, noncoding annotation tools use a variety of data sets to train their algorithms. For example, GWAVA and FATHMM-MKL use manually curated disease-associated variants from the Human Gene Mutation Database [33], a data set composed of experimentally validated and likely disease-associated variants. However, these databases do not contain randomly sampled variants from across the genome and so are subject to ascertainment bias. GWAVA and FATHMM-MKL attempt to mitigate these biases by sampling nearby nondisease-associated variants. By contrast, CADD and DANN use randomly simulated deleterious variants and conservation between humans and chimp to generate hypothetical sets of deleterious and nondeleterious variants. Though this approach may reduce selection bias, using randomly simulated variants risks capturing nondeleterious alleles in the deleterious training set, and deleterious alleles in the nondeleterious training set, as it does not use any experimental measure of deleteriousness. Newer methods such as deltaSVM and DeepSEA are forgoing the generation of detrimental SNP training sets altogether in favor of strict functional annotation to identify cell-specific regulatory elements and randomly sampled matched control regions. However, similar to randomly simulated variation, there is no guarantee that randomly selected control regions do not confer some regulatory function or undiscovered disease association.
Finally, as machine learning methods do not provide functional annotations alongside predictions of SNP deleteriousness, additional analysis using a functional- or conservation-based tool or manual functional annotation may still be needed to suggest hypotheses for how functional SNPs affect their associated disease phenotypes.
Integrating SNP Annotation into the GWAS Pipeline
The aforementioned tools offer a powerful way to improve the resolution of GWAS. By integrating them into GWAS pipelines, as shown in Figure 2 (Key Figure), a list of SNPs in LD with the lead SNP can be annotated and ranked according to their likelihood of function.
Figure 2. Key Figure. Integrating Single Nucleotide Polymorphism (SNP) Annotation into the Genome-wide Association Study (GWAS) Pipeline.
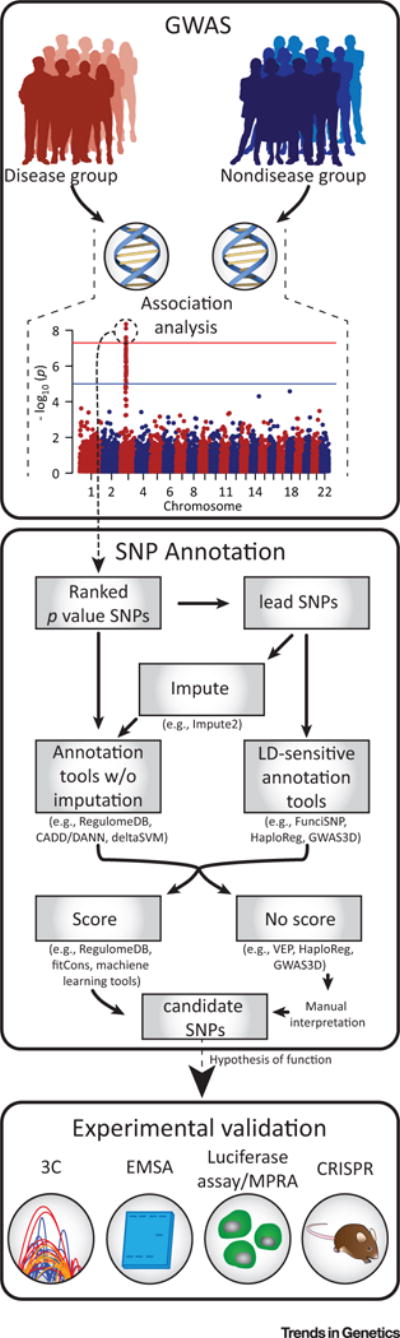
Following GWAS analysis, lead SNPs implicated as important in disease risk can be passed to an SNP annotation tool. Annotation tools sensitive to linkage disequilibrium (LD) regions, or who make predictions covering genomic regions can be used directly, while those tools without imputation methods must first be put through an imputation program to make predictions for all SNPs in a region of LD. Once a SNP annotation tool has been implemented, the resulting scores or functional annotations can be used to prioritize candidate SNPs for further experimental validation following generation of a hypothesis of function. Abbreviations: 3C, chromosome conformation capture; CADD, combined annotation-dependent depletion; CRISPR, clustered regularly interspaced short palindromic repeats; DANN, deleterious annotation of genetic variants using neural networks; EMSA, electrophoretic mobility shift assay; FunciSNP, Functional Identification of SNPs; MPRA, massively parallel reporter assay; VEP, Variant Effect Predictor.
Many of these tools approach the variant annotation from the perspective of an individual variant rather than considering all variants in LD with the reported SNP (e.g., RegulomeDB, CADD/DANN, deltaSVM). For these methods, preprocessing with tools, such as IMPUTE2, is necessary to identify SNPs in linkage with the lead SNP [34]. Other SNP annotation tools (e.g., FunciSNP, HaploReg, GWAS3D) incorporate LD SNPs without the need of additional tools. However, it is important for researchers to consider the genomic background of their samples when using tools that incorporate LD, as regions of LD vary between ethnicities. Because of this, it may be advisable to perform independent imputation as is standard in GWAS before applying these tools.
Not only can functional annotations narrow the pool of candidates for experimental follow-up, but also the content of the functional associations (overlapping TF binding sites, chromatin marks, etc.) can suggest casual mechanisms and help direct the strategies used for experimental validation. Annotation tools that provide quantitative scores [such as RegulomeDB, fitCons, and machine learning methods (Figure 1)] are particularly well suited to this application. The scores provide a way to directly rank individual SNPs and prioritize them for follow-up. Incorporating expert domain knowledge of the system(s) involved can further guide this process. The associated annotations can provide direct clues to the function of the sequence harboring a SNP of interest, leading to testable hypotheses regarding the tissues, cell types, pathways, target genes, and specific regulatory mechanisms potentially disrupted by a given variant.
A final consideration in the use of these tools is the application interface provided to the researcher. Some tools (e.g., FunciSNP, ANNOVAR, deltaSVM) only provide a command-line interface that, while not particularly user friendly, is ideal for integration into bioinformatic pipelines. Conversely, some tools provide Web interfaces with associated graphics and sorting capabilities to allow a noncomputationally focused researcher to perform these analyses with ease, allowing online visualization or opportunities to download scores for further analysis. However, these methods may be difficult to incorporate into automated analysis pipelines. The ideal interface will likely be defined by the research process of each group and should be considered on a case-by-case basis.
A recent example of the successful integration of annotation analysis into the GWAS pipeline comes from Higgins et al. [35]. This study examined 31 putative causal SNPs associated with psychotropic drug response, narrowed down from 2024 SNPs aggregated across 26 GWAS in the National Human Genome Research Institute (NHGRI) GWAS catalog [1]. They first imputed lead GWAS SNPs from using LD data from HaploReg. Imputed SNPs were then analyzed by SNP annotation methods and additional functional features, including RegulomeDB, HaploReg, and chromatin state. This allowed the authors to identify putative functional SNPs within their LD regions, as well as assign possible regulatory activity to the regions associated with these SNPs (promoter, enhancer, transcribed domain). Finally, by incorporating 3D chromatin interaction data, including GWAS3D analysis, the authors were able to predict cis-regulatory interactions. In total, these predictions provided hypotheses of SNP regulatory activity and interactions, which allow a higher confidence starting point for experimental verification.
Another clear demonstration of the power of SNP annotation of GWAS and subsequent experimental validation was recently published by He and colleagues [36]. This study used HaploReg functional annotations, along with known TF binding and histone modification data, to identify multiple novel functional regions and four variants likely to be functional in papillary thyroid cancer. They determined that these variants lead to increased enhancer activity by luciferase assay and increased TF binding by ChIP assay. Using chromosome conformation capture (3C), the authors also identified the gene targets of these enhancers. In this study, the use of noncoding SNP annotation tools, along with additional functional annotations, allowed the authors to distinguish novel enhancers, within which they were able to prioritize and validate SNPs of interest.
Validation of Tools on Liver SNPs
To demonstrate the applicability and accuracy of these methods, we used four noncoding annotation tools to examine human liver enhancer SNPs previously shown to affect enhancer activity by massively parallel report assay [37] (see the ‘Methods’ section). None of these variants occurs in dbSNP and would be considered de novo variants. The chosen liver data sets were not used to train any of the machine learning methods examined here. Using the default settings for the online interfaces of RegulomeDB, CADD, FATHMM-MKL, and DeepSEA, we found that four of the top seven SNPs that correlated with the greatest change in translational activity were called putatively detrimental or functional by all of the assayed methods, two additional SNPs were called by three of the four methods, and six more SNPs were called by just two of the methods (see Table S2 in the supplemental information online). Only four of the ten SNPs with no effect on transcriptional activity were called benign or nonfunctional by all of the assayed methods.
DeepSEA scores had the greatest correlation with the absolute log2-fold change on transcriptional activity (R2 = 0.307), followed by RegulomeDB (R2 = 0.262), CADD (R2 = 0.187), and FATHMM-MKL (R2 = 0.168; Figure 3). DeepSEA and RegulomeDB also had the highest agreement when comparing scores (R2 = 0.677). Interestingly, all methods were biased toward predicting SNPs, leading to a decrease in transcriptional activity rather than an increase. Though this trend makes sense for annotation-based methods such as RegulomeDB, the ability to identify SNPs with a positive effect of transcription is surprisingly low for sequence-based methods CADD and FATHMM-MKL. These results are striking, as none of the tools examined includes measures of SNP effects on gene expression in their prediction models. Discrepancies among scores given to the same variant by different annotation tools are not surprising. McCarthy et al. [38] explored the effect of annotation tools on coding variant prediction using ANNOVAR and VEP, and found only an 87% agreement between annotation calls. We expect to find far more discrepancies in noncoding regions of the genome, where markers of regulatory activity are far less understood. As an independent large-scale comparison of these methods has yet to be published, it remains unclear which tool, if any, is generally the most effective.
Figure 3. Analysis of Liver Variants Using Noncoding Annotation Tools.
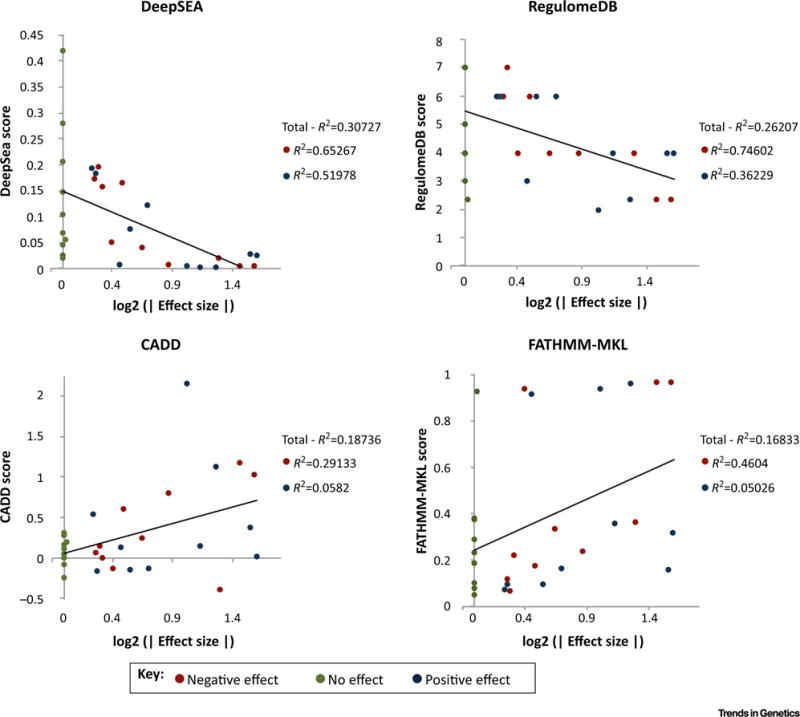
Effect size represents the absolute value log2 change of the transcriptional activity of the variant compared with wild type. R2 values are given for all data points, and for positive and negative data points individually. Red points represent variants correlated with a negative effect on transcription, blue points are those correlated with a positive effect on transcription, and green points are correlated with no effect on transcription. Abbreviation: CADD, combined annotation-dependent depletion.
Our comparison demonstrates disparities in the agreement between the calls of different tools, suggesting that the use of multiple tools in tandem may increase the confidence of called SNPs, and this strategy has been successful in multiple published studies [39–41]. For example, Chen and colleagues [42] utilized VEP, RegulomeDB, ANNOVAR, and HaploReg to predict the likelihood of function and regulatory feature type for 9184 noncoding variants from the NHGRI database. Strikingly, they were able to predict regulatory functions for 96% of these variants. Furthermore, they randomly selected three variants from their list for functional testing in a reporter assay, and found all three to have enhancer or silencer activity. These results highlight the promise of using multiple noncoding annotation methods to increase the confidence of predicted casual SNPs. Indeed, combining multiple annotation tools may balance out the biases inherent to single tools, thus yielding more reliable predictions.
Experimental SNP Validation
Many experimental methods exist for investigating the effects of SNPs, but without specific functional hypotheses, choosing an appropriate method of experimental follow-up is challenging [43,44]. Integrating annotation tools that report functional information into the GWAS pipeline provides multiple lines of evidence to suggest appropriate tests, including the correct tissue or cell type, how a SNP affects regulation at a locus (e.g., by altering TF binding), the gene target of the regulatory region, and the expression-level effect on the target gene. In particular, functional annotations provided by many tools can suggest the cell type in which a SNP may have an effect. This is particularly crucial in noncoding regions of the genome, as most regulatory regions are tissue specific. Thus, cell-type predictions can inform decisions on which cells to use for in vitro analyses, such as luciferase reporter assays, and which tissues to examine in in vivo analyses, such as immunohistochemistry.
One method commonly used to investigate the disruption of protein–DNA interactions by regulatory SNPs is electrophoretic mobility shift assay. This assay can be used to determine if a protein is capable of interacting in vitro with a DNA sequence of interest, and can be used to assay if DNA–protein interactions are perturbed by introducing a SNP [45]. Proteome-wide analysis of SNPs can also be used to identify SNPs producing differential TF binding [46].
Many GWAS findings are distal to any obvious target gene and many regulatory elements have been shown to act on a gene other than the nearest gene [47]. To identify the target for a regulatory region, one can use a 3D genomic assay such as 3C, chromosome conformation capture-on-chip (4C), chromosome conformation capture carbon copy (5C), chromatin interaction analysis by paired-end tag sequencing, Hi-C, Capture C, or Capture Hi-C (CHi-C) [48–52]. The GWAS3D annotation tool includes a set of 3D interaction data in its annotations and some tools include eQTL information that may give an idea of the gene regulatory interaction. In cases where there are no current data, an assay such as 4C will allow interrogation of all interactions with the significant locus. Following target gene identification, expression changes can be assayed using reverse transcription PCR. However, though these methods can demonstrate regulatory interactions between noncoding sequences and target genes, they cannot discern specific functional effects.
Reporter assays offer a complementary approach to the aforementioned methods, offering the ability to directly measure the functional effect of a variant on gene expression levels. They work by placing a regulatory element upstream of a minimal promoter and a reporter gene in a plasmid, which can be transfected into an organism and analyzed for regulatory activity [36]. High-throughput forms of these assays can be used to measure functional consequences of variation more broadly [53,54]. Likewise, transgenic animal models, including mice and zebra-fish, offer powerful tools to assay the phenotypic effect of mutations in vivo [55,56]. With the discovery of clustered regularly interspaced short palindromic repeats (CRISPR) editing, non-coding variants and structural changes may now more easily be investigated in these more-complex model systems [57].
Concluding Remarks
We believe computational SNP annotation tools will prove invaluable to the interpretation of GWAS SNPs. The tools reviewed here provide annotations and predictions of the regulatory effects of these often-difficult-to-interpret variants using three primary methodologies: functional annotations, conservation, and machine learning (Table 1).
Table 1.
Online Resources for Accessing Noncoding SNP Annotation Toolsa
| Tool | URL | Refs |
|---|---|---|
| VEP | VEP incorporates annotations from the Ensembl database, allowing it to make predictions genome-wide as well as predict tissue-specific activity for 13 human cell lines. http://www.ensembl.org/info/docs/tools/vep/script/index.html | McLaren et al. [17] |
| RegulomeDB | RegulomeDB uses a heuristic scoring system to catalog the likelihood that a given SNP or indel resides in a functional region, using functional data from over 100 cell types. http://regulomedb.org | Boyle et al. [18] |
| FunciSNP | FunciSNP is an R/Bioconductor package that employs user input annotations to prioritize SNPs, allowing users to customize their annotations to query a cell type of interest. http://www.bioconductor.org/packages/release/bioc/html/FunciSNP.html | Coetzee et al. [19] |
| ANNOVAR | ANNOVAR is a command line tool that uses region-based annotations to annotate noncoding variants and insertions and deletions (indels), in addition to comparing them to known variation databases. http://annovar.openbioinformatics.org | Wang et al. [21] |
| HaploReg | HaploReg is a searchable repository for SNPs and indels from the 1000 Genomes Project, providing a summary of known annotations for variants within an LD block. http://www.broadinstitute.org/mammals/haploreg/haploreg.php | Ward and Kellis [22] |
| GWAS3D | GWAS3D evaluates SNPs and indels by analyzing their 3D chromosomal interactions and disruptions to TF binding affinity. It outputs scores as well as a circle plot mapping local 3D interactions. http://jjwanglab.org/gwas3d | Li et al. [23] |
| fitCons | fitCons uses the INSIGHT method to predict the probability that SNPs will influence fitness by screening for signatures positive and negative selection using data from three cell types. http://compgen.bscb.cornell.edu/fitCons/ | Gulko et al. [24] |
| GWAVA | GWAVA trains on a random forest algorithm using disease mutations from HGMD and control variants from the 1000 genomes project to predict if queried variants are functional. ftp://ftp.sanger.ac.uk/pub/resources/software/gwava/ | Ritchie et al. [28] |
| CADD | CADD trains on a linear kernel support vector matrix using simulated variants as deleterious variants and alleles fixed between human and chimpanzee as control variants. http://cadd.gs.washington.edu | Kircher et al. [26] |
| DANN | DANN trains on a nonlinear learning neural network algorithm using the same training set data (fixed alleles vs. simulated variants) as CADD. https://cbcl.ics.uci.edu/public_data/DANN/ | Quang et al. [29] |
| FATHMM-MKL | FATHMM-MKL implements a kernel-based classifier to estimate complex nonlinear patterns using HGMD pathogenic and 1000 Genomes Project control variant training set data. http://fathmm.biocompute.org.uk | Shihab et al. [30] |
| deltaSVM | deltaSVM uses a gapped k-mer support vector machine to estimate the effect of a variant in a cell-type-specific manner. http://www.beerlab.org/deltasvm/ | Lee et al. [31] |
| DeepSEA | DeepSEA uses a multilayered hierarchical structured deep learning-based sequence model to predict functional SNPs with single nucleotide sensitivity using ENCODE and Roadmap Epigenomics data. http://deepsea.princeton.edu/job/analysis/create/ | Zhou and Troyanskaya [32] |
Abbreviation: HGMD, Human Gene Mutation Database.
Though the majority of GWAS analyses using these methods stop at selecting possible functional variants within an LD region, the power of these annotation methods will come from increasing the speed and ease of experimentally validating putative causal SNPs associated with disease [58] (see Outstanding Questions). This improvement will be primarily through reducing the set of variants for experimental follow-up and guiding hypothesis generation regarding their target tissues and regulatory impacts. Validated causal SNPs can then feed back into future development efforts, further refining these techniques and improving their utility.
As gaps in functional data are filled and high-throughput sequencing technologies improve, SNP annotation methods will become more powerful. Notably, increased adoption of whole-genome sequencing technology, along with improvements to the technologies themselves, will vastly improve the breadth and resolution of available sequence data. This will allow not only noncoding variants to be detected, but also improved annotations of structural variation such as copy number variation [59]. In addition, the development of ensemble predictors, similar to those available for coding annotations, would allow users to run several annotation models in parallel, providing the same benefit as implementing multiple tools. The expansion of functional data sets across a wide range of cell types will be key to improving variant predictions for tissue-specific phenotypes. Finally, incorporation of 3D structural data will likely improve our ability to assign regulatory SNPs to their target genes, with additional improvements in our ability to discern their functions and place them in their biological context, a necessary step for critical pharmacogenetic advancements.
The widespread use of noncoding SNP annotation methods will help us predict the effects of genomic variation, elucidate mechanisms and pathways of disease, and bring us closer to understanding the full complexity of the human genome.
Methods
SNP Selection
Variants in Figure 3 were chosen from two human enhancer loci previously examined at a nucleotide level by massively parallel reporter assay [37]. Enhancer loci were divided into fifths, with three SNPs chosen from each region (ALDOB, hg19:chr9:104195570–104195820; ECR11, hg19:chr2:169939182–169939682). From each fifth we selected the two SNPs that correlated with the greatest positive or negative change in transcriptional activity, and the first occurrence of a SNP leading to no change (or in the absence of any such SNP, the variant closest to 0 translational activity) in the region, for a total of 30 SNPs.
Noncoding SNP Validation
RegulomeDB, CADD, FATHMM-MKL, and DeepSEA were all accessed through their online portals, and run using their default parameters. Variants were submitted in variant call format (VCF) and VCF-like formats. For RegulomeDB, all variants returning a score of ‘No Data’ were given a score of 7 for downstream analysis. For DeepSEA, functional significance scores were used.
Supplementary Material
Trends.
The majority of GWAS SNPs have been identified in noncoding regions of the genome. However, due to difficulties determining which mutations are causal in noncoding regions, these SNPs remain largely understudied.
Noncoding SNP annotation tools have been developed to predict possible causal mutations found outside of genes in the genome, and offer users a way to prioritize noncoding SNPs identified by GWAS for experimental validation.
SNP annotation tools make their predictions using different methodologies and data types. Understanding how these tools differ from one another can be used to determine which tools to use and potential biases to be aware of.
We predict that the incorporation of these tools into the GWAS pipeline will result in a shorter turnaround time between GWAS, genetic discovery, and translational research.
Outstanding Questions.
What additional resources will researchers need to feel that noncoding annotation tools are both valuable and accessible?
Will the increased use of noncoding SNP annotation tools increase the frequency of experimental validations for noncoding mutations? How will increasing the number of validated non-coding SNPs change how we think about noncoding variants?
What insights can be gained from exploring currently existing whole-genome sequencing data by using these tools? Can these studies identify some of the hidden heritability of complex human traits?
What additional data, such as DNA methylation or 3D genomic structure, can be integrated into noncoding annotation methods to increase the confidence of their predictions? What types of noncoding features remain undetectable by current noncoding annotation methods?
Footnotes
Supplemental Information
Supplemental information associated with this article can be found, in the online version, at http://dx.doi.org/10.1016/j.tig.2016.10.008.
References
- 1.Welter D, et al. The NHGRI GWAS Catalog, a curated resource of SNP-trait associations. Nucleic Acids Res. 2014;42:D1001–D1006. doi: 10.1093/nar/gkt1229. [DOI] [PMC free article] [PubMed] [Google Scholar]
- 2.Gaulton KJ, et al. A map of open chromatin in human pancreatic islets. Nat Genet. 2010;42:255–259. doi: 10.1038/ng.530. [DOI] [PMC free article] [PubMed] [Google Scholar]
- 3.Wellcome Trust Case Control Consortium et al. Bayesian refinement of association signals for 14 loci in 3 common diseases. Nat Genet. 2012;44:1294–1301. doi: 10.1038/ng.2435. [DOI] [PMC free article] [PubMed] [Google Scholar]
- 4.Bauer DE, et al. An erythroid enhancer of BCL11A subject to genetic variation determines fetal hemoglobin level. Science. 2013;342:253–257. doi: 10.1126/science.1242088. [DOI] [PMC free article] [PubMed] [Google Scholar]
- 5.Ritchie GR, Flicek P. Computational approaches to interpreting genomic sequence variation. Genome Med. 2014;6:87. doi: 10.1186/s13073-014-0087-1. [DOI] [PMC free article] [PubMed] [Google Scholar]
- 6.Pabinger S, et al. A survey of tools for variant analysis of next-generation genome sequencing data. Brief Bioinform. 2014;15:256–278. doi: 10.1093/bib/bbs086. [DOI] [PMC free article] [PubMed] [Google Scholar]
- 7.Hindorff LA, et al. Potential etiologic and functional implications of genome-wide association loci for human diseases and traits. Proc Natl Acad Sci USA. 2009;106:9362–9367. doi: 10.1073/pnas.0903103106. [DOI] [PMC free article] [PubMed] [Google Scholar]
- 8.1000 Genomes Project Consortium et al. A map of human genome variation from population-scale sequencing. Nature. 2010;467:1061–1073. doi: 10.1038/nature09534. [DOI] [PMC free article] [PubMed] [Google Scholar]
- 9.Project Consortium, ENCODE et al. An integrated encyclopedia of DNA elements in the human genome. Nature. 2012;489:57–74. doi: 10.1038/nature11247. [DOI] [PMC free article] [PubMed] [Google Scholar]
- 10.Kasowski M, et al. Variation in transcription factor binding among humans. Science. 2010;328:232–235. doi: 10.1126/science.1183621. [DOI] [PMC free article] [PubMed] [Google Scholar]
- 11.McDaniell R, et al. Heritable individual-specific and allele-specific chromatin signatures in humans. Science. 2010;328:235–239. doi: 10.1126/science.1184655. [DOI] [PMC free article] [PubMed] [Google Scholar]
- 12.Degner JF, et al. DNase I sensitivity QTLs are a major determinant of human expression variation. Nature. 2012;482:390–394. doi: 10.1038/nature10808. [DOI] [PMC free article] [PubMed] [Google Scholar]
- 13.Maurano MT, et al. Systematic localization of common disease-associated variation in regulatory DNA. Science. 2012;337:1190–1195. doi: 10.1126/science.1222794. [DOI] [PMC free article] [PubMed] [Google Scholar]
- 14.Furey TS, Sethupathy P. Genetics. Genetics driving epigenetics. Science. 2013;342:705–706. doi: 10.1126/science.1246755. [DOI] [PubMed] [Google Scholar]
- 15.Schaub MA, et al. Linking disease associations with regulatory information in the human genome. Genome Res. 2012;22:1748–1759. doi: 10.1101/gr.136127.111. [DOI] [PMC free article] [PubMed] [Google Scholar]
- 16.Mathelier A, et al. Identification of altered cis-regulatory elements in human disease. Trends Genet. 2015;31:67–76. doi: 10.1016/j.tig.2014.12.003. [DOI] [PubMed] [Google Scholar]
- 17.McLaren W, et al. Deriving the consequences of genomic variants with the Ensembl API and SNP Effect Predictor. Bioinformatics. 2010;26:2069–2070. doi: 10.1093/bioinformatics/btq330. [DOI] [PMC free article] [PubMed] [Google Scholar]
- 18.Boyle AP, et al. Annotation of functional variation in personal genomes using RegulomeDB. Genome Res. 2012;22:1790–1797. doi: 10.1101/gr.137323.112. [DOI] [PMC free article] [PubMed] [Google Scholar]
- 19.Coetzee SG, et al. FunciSNP: an R/bioconductor tool integrating functional non-coding data sets with genetic association studies to identify candidate regulatory SNPs. Nucleic Acids Res. 2012;40:e139. doi: 10.1093/nar/gks542. [DOI] [PMC free article] [PubMed] [Google Scholar]
- 20.Ward LD, Kellis M. Evidence of abundant purifying selection in humans for recently acquired regulatory functions. Science. 2012;337:1675–1678. doi: 10.1126/science.1225057. [DOI] [PMC free article] [PubMed] [Google Scholar]
- 21.Wang K, et al. ANNOVAR: functional annotation of genetic variants from high-throughput sequencing data. Nucleic Acids Res. 2010;38:e164. doi: 10.1093/nar/gkq603. [DOI] [PMC free article] [PubMed] [Google Scholar]
- 22.Ward LD, Kellis M. HaploReg: a resource for exploring chromatin states, conservation, and regulatory motif alterations within sets of genetically linked variants. Nucleic Acids Res. 2012;40:D930–D934. doi: 10.1093/nar/gkr917. [DOI] [PMC free article] [PubMed] [Google Scholar]
- 23.Li MJ, et al. GWAS3D: detecting human regulatory variants by integrative analysis of genome-wide associations, chromosome interactions and histone modifications. Nucleic Acids Res. 2013;41:W150–W158. doi: 10.1093/nar/gkt456. [DOI] [PMC free article] [PubMed] [Google Scholar]
- 24.Gulko B, et al. A method for calculating probabilities of fitness consequences for point mutations across the human genome. Nat Genet. 2015;47:276–283. doi: 10.1038/ng.3196. [DOI] [PMC free article] [PubMed] [Google Scholar]
- 25.Kotsiantis SB, et al. Supervised machine learning: a review of classification techniques. Informatics. 2007;31:249–268. [Google Scholar]
- 26.Kircher M, et al. A general framework for estimating the relative pathogenicity of human genetic variants. Nat Genet. 2014;46:310–315. doi: 10.1038/ng.2892. [DOI] [PMC free article] [PubMed] [Google Scholar]
- 27.Okser S, et al. Regularized machine learning in the genetic prediction of complex traits. PLoS Genet. 2014;10:e1004754. doi: 10.1371/journal.pgen.1004754. [DOI] [PMC free article] [PubMed] [Google Scholar]
- 28.Ritchie GRS, et al. Functional annotation of noncoding sequence variants. Nat Methods. 2014;11:294–296. doi: 10.1038/nmeth.2832. [DOI] [PMC free article] [PubMed] [Google Scholar]
- 29.Quang D, et al. DANN: a deep learning approach for annotating the pathogenicity of genetic variants. Bioinformatics. 2015;31:761–763. doi: 10.1093/bioinformatics/btu703. [DOI] [PMC free article] [PubMed] [Google Scholar]
- 30.Shihab HA, et al. An integrative approach to predicting the functional effects of non-coding and coding sequence variation. Bioinformatics. 2015;31:1536–1543. doi: 10.1093/bioinformatics/btv009. [DOI] [PMC free article] [PubMed] [Google Scholar]
- 31.Lee D, et al. A method to predict the impact of regulatory variants from DNA sequence. Nat Genet. 2015;47:955–961. doi: 10.1038/ng.3331. [DOI] [PMC free article] [PubMed] [Google Scholar]
- 32.Zhou J, Troyanskaya OG. Predicting effects of non-coding variants with deep learning-based sequence model. Nat Methods. 2015;12:931–934. doi: 10.1038/nmeth.3547. [DOI] [PMC free article] [PubMed] [Google Scholar]
- 33.Stenson PD, et al. The Human Gene Mutation Database: building a comprehensive mutation repository for clinical and molecular genetics, diagnostic testing and personalized genomic medicine. Hum Genet. 2014;133:1–9. doi: 10.1007/s00439-013-1358-4. [DOI] [PMC free article] [PubMed] [Google Scholar]
- 34.Howie BN, et al. A flexible and accurate genotype imputation method for the next generation of genome-wide association studies. PLoS Genet. 2009;5:e1000529. doi: 10.1371/journal.pgen.1000529. [DOI] [PMC free article] [PubMed] [Google Scholar]
- 35.Higgins GA, et al. Epigenomic mapping and effect sizes of noncoding variants associated with psychotropic drug response. Pharmacogenomics. 2015;16:1565–1583. doi: 10.2217/pgs.15.105. [DOI] [PubMed] [Google Scholar]
- 36.He H, et al. Multiple functional variants in long-range enhancer elements contribute to the risk of SNP rs965513 in thyroid cancer. Proc Natl Acad Sci USA. 2015;112:6128–6133. doi: 10.1073/pnas.1506255112. [DOI] [PMC free article] [PubMed] [Google Scholar]
- 37.Patwardhan RP, et al. Massively parallel functional dissection of mammalian enhancers in vivo. Nat Biotechnol. 2012;30:265–270. doi: 10.1038/nbt.2136. [DOI] [PMC free article] [PubMed] [Google Scholar]
- 38.McCarthy DJ, et al. Choice of transcripts and software has a large effect on variant annotation. Genome Med. 2014;6:26. doi: 10.1186/gm543. [DOI] [PMC free article] [PubMed] [Google Scholar]
- 39.Law MH, et al. Genome-wide meta-analysis identifies five new susceptibility loci for cutaneous malignant melanoma. Nat Genet. 2015;47:987–995. doi: 10.1038/ng.3373. [DOI] [PMC free article] [PubMed] [Google Scholar]
- 40.Sidore C, et al. Genome sequencing elucidates Sardinian genetic architecture and augments association analyses for lipid and blood inflammatory markers. Nat Genet. 2015;47:1272–1281. doi: 10.1038/ng.3368. [DOI] [PMC free article] [PubMed] [Google Scholar]
- 41.Kato N, et al. Trans-ancestry genome-wide association study identifies 12 genetic loci influencing blood pressure and implicates a role for DNA methylation. Nat Genet. 2015;47:1282–1293. doi: 10.1038/ng.3405. [DOI] [PMC free article] [PubMed] [Google Scholar]
- 42.Chen G, et al. Re-annotation of presumed noncoding disease/trait-associated genetic variants by integrative analyses. Sci Rep. 2015;5:9453. doi: 10.1038/srep09453. [DOI] [PMC free article] [PubMed] [Google Scholar]
- 43.Edwards SL, et al. Beyond GWASs: illuminating the dark road from association to function. Am J Hum Genet. 2013;93:779–797. doi: 10.1016/j.ajhg.2013.10.012. [DOI] [PMC free article] [PubMed] [Google Scholar]
- 44.Freedman ML, et al. Principles for the post-GWAS functional characterization of cancer risk loci. Nat Genet. 2011;43:513–518. doi: 10.1038/ng.840. [DOI] [PMC free article] [PubMed] [Google Scholar]
- 45.Fried MG. Measurement of protein-DNA interaction parameters by electrophoresis mobility shift assay. Electrophoresis. 1989;10:366–376. doi: 10.1002/elps.1150100515. [DOI] [PubMed] [Google Scholar]
- 46.Butter F, et al. Proteome-wide analysis of disease-associated SNPs that show allele-specific transcription factor binding. PLoS Genet. 2012;8:e1002982. doi: 10.1371/journal.pgen.1002982. [DOI] [PMC free article] [PubMed] [Google Scholar]
- 47.Heintzman ND, Ren B. Finding distal regulatory elements in the human genome. Curr Opin Genet Dev. 2009;19:541–549. doi: 10.1016/j.gde.2009.09.006. [DOI] [PMC free article] [PubMed] [Google Scholar]
- 48.Hagège H, et al. Quantitative analysis of chromosome conformation capture assays (3C-qPCR) Nat Protoc. 2007;2:1722–1733. doi: 10.1038/nprot.2007.243. [DOI] [PubMed] [Google Scholar]
- 49.de Wit E, de Laat W. A decade of 3C technologies: insights into nuclear organization. Genes Dev. 2012;26:11–24. doi: 10.1101/gad.179804.111. [DOI] [PMC free article] [PubMed] [Google Scholar]
- 50.Lieberman-Aiden E, et al. Comprehensive mapping of long-range interactions reveals folding principles of the human genome. Science. 2009;326:289–293. doi: 10.1126/science.1181369. [DOI] [PMC free article] [PubMed] [Google Scholar]
- 51.Davies JOJ, et al. Multiplexed analysis of chromosome conformation at vastly improved sensitivity. Nat Methods. 2016;13:74–80. doi: 10.1038/nmeth.3664. [DOI] [PMC free article] [PubMed] [Google Scholar]
- 52.Mifsud B, et al. Mapping long-range promoter contacts in human cells with high-resolution capture Hi-C. Nat Genet. 2015;47:598–606. doi: 10.1038/ng.3286. [DOI] [PubMed] [Google Scholar]
- 53.Kheradpour P, et al. Systematic dissection of regulatory motifs in 2000 predicted human enhancers using a massively parallel reporter assay. Genome Res. 2013;23:800–811. doi: 10.1101/gr.144899.112. [DOI] [PMC free article] [PubMed] [Google Scholar]
- 54.Arnold CD, et al. Genome-wide quantitative enhancer activity maps identified by STARR-seq. Science. 2013;339:1074–1077. doi: 10.1126/science.1232542. [DOI] [PubMed] [Google Scholar]
- 55.Ermann J, Glimcher LH. After GWAS: mice to the rescue? Curr Opin Immunol. 2012;24:564–570. doi: 10.1016/j.coi.2012.09.005. [DOI] [PMC free article] [PubMed] [Google Scholar]
- 56.Fisher S, et al. Evaluating the biological relevance of putative enhancers using Tol2 transposon-mediated transgenesis in zebrafish. Nat Protoc. 2006;1:1297–1305. doi: 10.1038/nprot.2006.230. [DOI] [PubMed] [Google Scholar]
- 57.Zhang F, Lupski JR. Non-coding genetic variants in human disease. Hum Mol Genet. 2015;24:R102–R110. doi: 10.1093/hmg/ddv259. [DOI] [PMC free article] [PubMed] [Google Scholar]
- 58.Corradin O, et al. Combinatorial effects of multiple enhancer variants in linkage disequilibrium dictate levels of gene expression to confer susceptibility to common traits. Genome Res. 2014;24:1–13. doi: 10.1101/gr.164079.113. [DOI] [PMC free article] [PubMed] [Google Scholar]
- 59.Taylor JC, et al. Factors influencing success of clinical genome sequencing across a broad spectrum of disorders. Nat Genet. 2015;47:717–726. doi: 10.1038/ng.3304. [DOI] [PMC free article] [PubMed] [Google Scholar]
Associated Data
This section collects any data citations, data availability statements, or supplementary materials included in this article.