

Summary
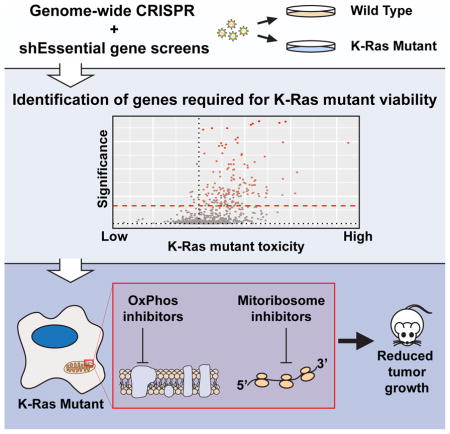
Activating mutations in the KRAS oncogene are highly prevalent in tumors, especially those of the colon, lung, and pancreas. To better understand the genetic dependencies that K-Ras mutant cells rely upon for their growth, we employed whole-genome CRISPR loss of function screens in two isogenic pairs of cell lines. Since loss of essential genes is uniformly toxic in CRISPR-based screens we also developed an shRNA library targeting essential genes. These approaches uncovered a large set of proteins whose loss results in the selective reduction of K-Ras mutant cell growth. Pathway analysis revealed that many of these genes function in the mitochondria. For validation, we generated isogenic pairs of cell lines using CRISPR-based genome engineering, which confirmed the dependency of K-Ras mutant cells on these mitochondrial pathways. Finally, we found that mitochondrial inhibitors reduce the growth of K-Ras mutant tumors in vivo, advancing strategies to target K-Ras-driven malignancy.
Graphical Abstract
Introduction
K-Ras is one of the most commonly mutated oncogenes in cancer, making it an attractive target for therapeutics. Early efforts at directly inhibiting K-Ras were unsuccessful, but many new and exciting strategies are currently under evaluation (Ostrem et al., 2013; Lito et al., 2016; Burns et al., 2014; Zimmerman et al., 2013; Spencer-Smith et al., 2017). Molecules that block downstream Ras signaling, particularly MAPK and PI3K signaling, are also being investigated (Cox et al., 2014). Identifying the synthetic lethal interactions of oncogenic K-Ras, the genes specifically required for the viability of mutant but not wild type (WT) K-Ras expressing cells, provides yet another way to block K-Ras-driven growth. The utility of synthetic lethality is perhaps most notable in the profound sensitivity of BRCA-deficient cells to PARP inhibition (Bryant et al., 2005, Farmer et al., 2005). Previous studies using whole-genome RNAi libraries in either isogenic pairs or panels of cell lines identified many synthetic lethal interactions of mutant Ras proteins (Burns et al., 2014; Scholl et al., 2009; Luo et al., 2009; Cullis et al., 2014; Kim et al., 2013). Surprisingly, the only consistent hit among these screens was the proteasome. This is likely due to the genetic and tissue diversity among the cell lines screened, differences in the RNAi libraries themselves, and the inherent noise associated with RNAi screens due to off-target or limited on-target effects.
CRISPR based screens have been shown to be superior to RNAi screening in reproducibility (Evers et al., 2016), likely due to the lower off-target frequency of gRNA reagents compared to shRNAs and the fact that CRISPR frequently creates null mutations as opposed to the hypomorphic effects of RNAi due to incomplete mRNA depletion, thus resulting in a stronger reduction in gene function by CRISPR. While CRISPR has these superior attributes, RNAi has an advantage when studying essential genes due to the generation of these hypomorphic phenotypes. Here, we used a combination of whole-genome CRISPR and shRNAs targeting essential genes in isogenic cell lines to identify the pathways that mutant K-Ras requires for proliferation. Among the top hits that K-Ras mutant cells were reliant upon for viability were mitochondrial proteins including many components of the mitochondrial ribosome (mitoribosome) itself. Using newly derived isogenic pairs of cells, we find that K-Ras mutant cells are more sensitive to mitochondrial translation inhibitors and drugs targeting the mitoribosome can inhibit that K-Ras mutant tumor growth. These findings highlight a major role for the mitochondria in K-Ras mutant cell growth and provide additional therapeutic targets to inhibit tumors driven by oncogenic K-Ras.
Results
Discovery of Synthetic Lethal Interactions with Mutant K-Ras Using Whole-Genome CRISPR Screening
To find genes that were required for K-Ras mutant cell growth, we used isogenic pairs of HCT116 and DLD1 colorectal tumor cells that only differ by the presence of a K-Ras mutation (Shirasawa et al., 1993) to screen using a pooled genome-wide lentiviral CRISPR library with guide RNAs (gRNAs) targeting 18,148 genes with five gRNAs per gene. Cells were allowed to grow for 10 population doublings (PDs) after the CRISPR library infection and gRNA abundance was determined by sequencing (Fig. 1A). The growth rate of the cells was comparable (Fig. S1A and S1B). The change in relative abundance of each gRNA was determined by sequencing and comparing PD10 to the initial population of cells (PD0) (data available in Supplemental Tables 1–4). Genes that preferentially drop out and whose loss is therefore more toxic to K-Ras mutant cells were identified (Fig. 1B). A “K-Ras synthetic lethal score” was defined by the difference in the log2-fold change between the WT and K-Ras mutant cells for each gene, with a positive value indicating selective toxicity in K-Ras mutant cells. Genes with high K-Ras synthetic lethal scores were determined for both the DLD1 and HCT116 cell lines and the overlapping genes that scored highly in both screens are plotted in Fig. 1C. We also excluded genes that caused an increase in the growth of WT cells, but had no effect on K-Ras mutants. The 55 genes with the highest K-Ras synthetic lethal scores are shown in Fig. 1D. Gene ontology (GO) enrichment analysis of the putative synthetic lethal genes that overlap between the DLD1 and HCT116 screens revealed gene involved in protein translation, RNA processing and splicing, and mitochondrial genes (Fig. 1E). Interestingly, many of these mitochondrial genes encode proteins that function as part of the mitochondrial ribosome or in regulating mitochondrial translation. We performed an additional whole-genome CRISPR screen in LS513 cells, a K-Ras G12D mutant colorectal tumor cell line, and the performance of the putative synthetic lethal genes identified in the DLD1 and HCT116 screens was analyzed (Fig. S1C and Supplemental Table 5). We found that mitochondrial ribosome genes were required for the viability of K-Ras mutant LS513 cells (Fig. S1C).
Figure 1. Genome-wide CRISPR screens in isogenic colorectal tumor cells identifies synthetic lethal interactions with mutant K-Ras.

A. Schematic of the CRISPR screens performed. Abundance of gRNAs was compared between the initial (PD0) and final (PD10) time points. Genes whose gRNAs are selectively depleted in the K-Ras mutant cells are putative synthetic lethal hits. B. Fold changes of genes in the DLD1 screen. The average log2 fold change for each gene was calculated and plotted for both WT/- and WT/K-Ras mutant DLD1 cells. Labeled genes are a selection of potential synthetic lethal partners of mutant K-Ras. C. Synthetic lethal genes that scored in both the HCT116 and DLD1 screens. D. Average fold changes for the top 55 K-Ras synthetic lethal genes identified in the DLD1 screen. E. Gene ontology terms enriched in putative K-Ras synthetic lethal genes. For screen sequencing data and analyses, see Supplemental Tables S1–4.
K-Ras Mutant Cells are Dependent Upon Mitochondrial Pathways Including Mitochondrial Translation
To examine in greater detail the mitochondrial genes that were identified as synthetic lethal partners with oncogenic K-Ras, we performed GO enrichment analysis specifically on genes that are annotated to localize to the mitochondria in human MitoCarta 2.0 (Nielsen et al., 2015). Enriched pathways included mitochondrial protein translation, transcription, and also oxidative phosphorylation (Fig. 2A). A closer examination of individual mitochondrial genes with high synthetic lethal scores also identified many mitochondrial chaperones including HSPA9 (mortalin), an Hsp70 family member, and GRPEL1, a chaperone involved in mitochondrial protein import (Fig. 2B). Notably, many of the subunits of the mitochondrial ribosome scored as synthetic lethal hits (Fig. 2C), further indicating enhanced dependence of K-Ras mutant cells on mitochondrial translation. Many antibiotics, like tetracycline and its derivatives, target the bacterial ribosome and are commonly used to treat infections. Since the bacterial and mitochondrial ribosomes share a common ancestor, these same antibiotics can be used to inhibit mitochondrial translation in human cells. One of these inhibitors is tigecycline, a glycylcycline that is currently used to treat infections caused by S. aureus and E. coli (Stein and Craig, 2006). Use of tigecycline to inhibit tumor cell growth is supported by previous work showing that tigecycline is a potent inhibitor of AML cell growth while having a reduced effect on inhibiting normal hematopoietic cell proliferation (Škrtić et al. 2011). We found that K-Ras mutant cells are more sensitive to tigecycline compared to their WT counterparts (Fig. 2D). Proteins in the NADH dehydrogenase complex (Complex I) of the electron transport chain were also identified in our screens (Fig. 1A). Treatment of both WT and K-Ras mutant cells with rotenone, an inhibitor of the oxidation of the iron-sulfur clusters of complex I, showed a more potent toxicity in K-Ras mutant HCT116 cells compared to WT (Fig. 2E). A hallmark of tumorigenic cells is their anchorage-independent growth properties. We found that inhibition of oxidative phosphorylation by either rotenone or VLX-600 (Zhang et al., 2014) or by blocking mitochondrial translation using tigecycline was sufficient to reduce the anchorage-independent growth of K-Ras mutant cells (Fig. 2F).
Figure 2. Mitochondrial genes and pathways are synthetic lethal with mutant K-Ras.

A. Pathways enriched among the mitochondrial genes that are putative synthetic lethal. B. Mitochondrial genes identified in the DLD1 screen. C. Depletion of the mitochondrial ribosome is synthetic lethal with mutant K-Ras. Components of the mitoribosome from the DLD1 screen and their associated FDR corrected p-values. D. Inhibition of mitochondrial translation is more toxic to K-Ras mutant cells. Isogenic DLD1 cells were treated with the mitochondrial translation inhibitor tigecycline and proliferation was measured. E. Inhibition of complex I of the respiratory chain is more toxic to K-Ras mutant cells. Colony formation of isogenic HCT116 cells treated with the complex I inhibitor rotenone. F. Inhibition of either the mitoribosome or complex I reduces the anchorage-independent growth of K-Ras mutant cells. Soft agar colony formation was measured in K-Ras mutant cells treated with the mitochondrial inhibitors. For all panels * denotes p<0.05. All cellular growth and allograft data are expressed as the average ± SEM.
An shRNA Screen Targeting Essential Genes Identifies Additional Synthetic ethal Partners with Mutant K-Ras
Previous shRNA-based synthetic lethal screens performed using these same isogenic cell pairs identified many mitotic genes as synthetic lethal partners of mutant K-Ras (Luo et al., 2009). Many of these core mitotic genes, like PLK1, are essential for cellular viability and are therefore lost in CRISPR-based loss of function screens regardless of the genotype of the cells screened. To directly determine whether a reduction in the expression of any essential genes might be synthetic lethal with mutant K-Ras, we developed an inducible shRNA library targeting approximately 1,100 essential genes composed of 15 unique shRNAs per gene (Fig. 3A). These essential genes were compiled from previous whole genome CRISPR screens aimed at identifying genes required for viability in a large number of cell lines (Wang et al., 2015; Hart et al., 2015). We used our shRNA essential gene library to screen both the WT and K-Ras mutant DLD1 cells and analyzed shRNA abundance at PD3, PD7, and PD10 (data available in Supplemental Table 6). By comparing the log2 fold changes of K-Ras mutant to WT for each gene at each time point, we found a number of genes that display synthetic lethality with oncogenic K-Ras (Fig. 3B and 3C). Examination of these synthetic lethal genes revealed many involved in RNA splicing (AQR, SF3B3, etc.), proteasomal subunits (PSMA6, PSMA2, etc.), and, consistent with previous screens, mitosis (PLK1, AURKA). Interestingly, there were also many genes that have mitochondrial functions including mitochondrial protein import (TIMM13, TIMM23), mitochondrial translation (MRPL28, MRPL41, and MRPS21), and mitochondrial chaperones (HSPD1, HSPE1). One of the top synthetic lethal genes was TCP1, one part of the octameric CCT/TRiC chaperone complex. We also found two additional CCT/TRiC components, CCT2 and CCT3, as synthetic lethal partners of oncogenic K-Ras. Using six shRNAs that were not part of the essential gene library used for screening, we knocked down the expression of TCP1 in both WT and K-Ras mutant DLD1 cells (Fig. 3D, S3A, and S3B). The most potent shRNAs (4 and 5) showed an indiscriminate reduction in the growth of either genotype, likely due to the strong levels of knockdown. A strong reduction in proliferation specific for the K-Ras mutant cells was seen in the shRNAs with intermediate levels of TCP1 knockdown (shRNAs 1, 2, 3, and 6). Loss of SAMM50, a mitochondrial protein involved in maintaining mitochondrial structure and import and assembly of outer mitochondrial membrane proteins, was also identified as synthetic lethal with mutant K-Ras (Fig. 3B and 3C). We used three shRNAs not in the screening library and found a reduction in SAMM50 protein expression resulted in a more severe growth reduction in K-Ras mutant DLD1 cells compared to WT (Fig. 3E and S3C).
Figure 3. An shRNA screen targeting essential genes identifies additional synthetic lethal partners with mutant K-Ras.

A. shRNA but not CRISPR-based screens can identify essential genes as synthetic lethal partners. Essential genes are universally lost in CRISPR-based screens while shRNA-based screens can identify whether the reduced function of essential genes can be synthetic lethal. B. An shRNA screen to identify essential genes that are synthetic lethal with mutant K-Ras in isogenic DLD1 cells. Heat map showing the log2 fold change at PD3, PD7, and PD10 of essential genes that are putative synthetic lethal partners of mutant K-Ras. C. Essential genes that are synthetic lethal with mutant K-Ras. Labeled genes are more strongly depleted in K-Ras mutant cells. D. Knockdown of CCT1/TCP1 is synthetic lethal with mutant K-Ras. Colony formation of isogenic DLD1 cells expressing tet-inducible shRNAs for TCP1. E. Knockdown of SAMM50 is synthetic lethal with mutant K-Ras. Colony formation of isogenic DLD1 cells expressing constitutively expressed shRNAs for SAMM50. For all panels * denotes p<0.05. All cellular growth and allograft data are expressed as the average ± SEM. For screen sequencing data and analysis, see Supplemental Table S6.
CRISPR/Cas9-Mediated Genome Engineering of Isogenic Cell Lines to Examine K-Ras Synthetic Lethal Interactions
A potential caveat regarding the use of isogenic pairs of HCT116 and DLD1 cell lines is that, because they are mismatch repair defective and have high mutation rates, they may not be truly isogenic due to genetic drift in culture and clonal selection during the preparation of the K-Ras mutant knockout by homologous recombination (Shirasawa et al., 1993). To circumvent this potential caveat, we used CRISPR/Cas9-mediated genome engineering to generate an isogenic cell line pair where an endogenous oncogenic K-Ras G12C allele could be turned on via Cre recombinase expression (Fig. 4A). We utilized normal small airway epithelial cells (AALE) that have been immortalized by the expression of telomerase and the SV40 early region and were previously shown to be capable of transformation by the ectopic expression of oncogenic Ras (Lundberg et al., 2002). A gRNA targeting the first coding exon of KRAS, exon 2, was expressed along with Cas9 and an adeno-associated virus (AAV) was used to deliver a homology donor containing a lox-stop-lox (LSL) cassette (Platt et al., 2014), an amino terminal 3x-HA tag, and a G12C mutation to generate the AALE LSL isogenic cell line (Fig. 4A). Expression of Cre recombinase led to 3x-HA K-Ras G12C expression and, as expected, an increase in Ras activity levels (Fig. 4B). Additionally, cells in which the endogenous mutant K-Ras had been activated also displayed an increase in canonical Ras effector signaling through both MAPK and PI3K, as measured by phospho-Erk and phospho-Akt levels (Fig. 4C). Induction of K-Ras G12C expression was sufficient for anchorage-independent growth, indicating cellular transformation (Fig. 4D). Next, we used this isogenic pair to validate whether inhibition of mitochondrial translation or oxidative phosphorylation, two mitochondrial pathways identified in the CRISPR screens (Fig. 2A), would lead to a stronger growth reduction of cells expressing mutant K-Ras. AALE LSL-K-Ras G12C cells were treated with either adenoviral GFP or Cre and proliferation was measured in response to rotenone or tigecycline, inhibitors of oxidative phosphorylation or mitochondrial translation respectively. Rotenone treatment led to a K-Ras-mutant specific reduction of proliferation, even at the lowest concentration of rotenone (10 pM) (Fig. 4E). Similarly, tigecycline treatment led to a K-Ras-mutant specific reduction in proliferation (Fig. 4F). These results in a third pair of isogenic cells support a dependency of K-Ras mutant cells on both oxidative phosphorylation and mitochondrial translation, further validating the pathways identified in our original screens.
Figure 4. CRISPR/Cas9-mediated genome engineering of K-Ras mutant isogenic immortalized primary cells.

A. Schematic of the KRAS locus and the targeting vector used to generate conditional K-Ras mutant alleles. A gRNA located near exon 2 and an AAV-delivered homology donor was used to generate lox-stop-lox (LSL) conditional HA-tagged K-Ras mutant cell lines. B. Cre treatment leads to K-Ras mutant expression and activation. K-Ras activation was measured by Raf-RBD pulldowns in isogenic cells treated with either control GFP or Cre expressing adenovirus. C. Expression of mutant K-Ras leads to increased MAPK and PI3K signaling. LSL-K-Ras G12C AALE cells were treated with GFP or Cre expressing adenovirus and 7 days later cell lysates were immunoblotted with the indicated antibodies to determine the activation of the PI3K and MAPK pathways, two effector pathways downstream of active K-Ras. D. Endogenous mutant K-Ras expression leads to cellular transformation. LSL-K-Ras G12C AALE cells from C were, placed in soft agar and colony growth was quantified 4 weeks later. * p<0.05. E. K-Ras mutant expressing cells are more sensitive to complex I inhibition by rotenone. LSL-K-Ras G12C AALE cells from C were treated with rotenone to compare the sensitivity of K-Ras mutant and WT expressing cells to oxidative phosphorylation inhibition. Cell viability was measured 2, 4, and 6 days after rotenone treatment. F. Mitoribosome inhibition by tigecycline is more toxic to K-Ras mutant expressing cells. LSL-K-Ras G12C AALE cells from C were treated with tigecycline to compare the sensitivity of K-Ras mutant and WT expressing cells to mitochondrial translation inhibition. Cell viability was measured 2, 4, and 6 days after tigecycline treatment. All cellular growth data are expressed as the average ± SEM.
Inhibition of Mitochondrial Translation Results in Inhibition of K-Ras Mutant Tumor Growth
To determine whether the pathways we identified in our screens are required for K-Ras-driven tumor growth, we used CT26 cells that were derived from a carcinogen induced BALB/c mouse colon tumor (Griswold and Corbett, 1975). CT26 cells possess an activating mutation in KRAS (G12D) (Castle et al., 2014) and are dependent upon mutant K-Ras expression for proliferation and tumorigenesis (Smakman et al., 2005). We expressed Cas9 and four gRNAs targeting two synthetic lethal genes identified in our screens (Mrpl52 and Ndufb10) or two gRNAs targeting the Rosa26 locus as a control. A reduction in Ndufb10 and Mrpl52 protein expression was observed in CT26 cells expressing the indicated gRNAs as compared to either Rosa26 gRNAs or non-treated (NT) control cells and this loss of protein expression correlated with reduced proliferation (Fig. 5A and 5B). Anchorage-independent growth was also decreased in CT26 cells with either Ndufb10 or Mrpl52 protein knockdown (Fig. 5C). Next, we took CT26 cells expressing two independent gRNAs for Ndufb10 and Mrpl52 or a Rosa26 control and injected them as subcutaneous xenografts in immune-competent BALB/c mice. Loss of Ndufb10 or, more strikingly, Mrpl52 led to a marked reduction in tumor growth (Fig. 5D). Since we found a vulnerability of K-Ras mutant cells to mitochondrial inhibitors (Fig. 2D), we treated CT26 cells with either VLX-600 or tigecycline to inhibit either mitochondrial respiration or translation respectively. CT26 cells displayed sensitivity to both VLX-600 (IC50 of 100nM) and tigecycline (IC50 of 33μM) (Fig. 5E). Finally, we injected CT26 cells into immune-competent BALB/c mice. Animals were randomly separated into 4 groups and treated with vehicle control, VLX-600, tigecycline, or a combination of VLX-600 and tigecycline via intraperitoneal injection every two days. Combination of tigecycine with VLX-600 was effective in reducing tumor growth compared to each single agent alone or to vehicle control (Fig. 5F). These results suggest that targeting mitochondrial translation and respiration can inhibit the tumorigenic growth of K-Ras mutant cells and support a dependence of K-Ras mutant cells on the mitochondrial pathways we identified in our CRISPR and shRNA screens.
Figure 5. Knockout of synthetic lethal genes or inhibition of complex I and the mitoribosome reduces K-Ras mutant cell growth in vivo.

A. Knockout of Ndufb10 reduces the proliferation of CT26 tumor cells. Cas9 and gRNAs targeting either control Rosa26 or Ndufb10 were expressed in CT26 cells and immunoblotted for the indicated proteins (above) and measured for proliferation (below). NT is non-treated. B. Mutation of Mrpl52 reduces the proliferation of CT26 tumor cells. Cas9 and gRNAs targeting either control Rosa26 or Mrpl52 were expressed in CT26 cells and immunoblotted for the indicated proteins (above) and measured for proliferation (below). NT is non-treated. C. Mutation of either Ndufb10 or Mrpl52 reduces the anchorage-independent growth of CT26 tumor cells in soft agar. Cells from A and B were tested for anchorage independent growth in soft agar and colony number was quantified. D. Mutation of either Ndufb10 or Mrpl52 reduces the in vivo tumor growth of CT26 tumor cells. CT26 cells expressing Cas9 and control Rosa26 gRNA or gRNAs targeting either Ndufb10 or Mrpl52 were subcutaneously injected as allografts in BALB/c mice and tumor growth was measured over time. E. CT26 cells are sensitive to complex I inhibition by VLX-600 and mitoribosome inhibition by tigecycline. CT26 cells were treated with increasing concentrations of VLX-600 or tigecycline to determine sensitivity to oxidative phosphorylation or mitochondrial translation inhibition, respectively. Cell viability was measured 72h after drug treatment and IC50 values for each compound were determined. F. Combined mitochondrial inhibition by VLX-600 and tigecycline reduces tumor growth. CT26 subcutaneous allografts were treated with the indicated inhibitors/concentrations and tumor growth was monitored. All cellular growth and allograft data are expressed as the average ± SEM.
Discussion
In this study, we used CRISPR/Cas9 screening to identify K-Ras synthetic lethal interactions. We screened two pairs of isogenic cell lines using a genome-wide CRISPR library and identified many synthetic lethal interactions with mutant K-Ras (Fig. 1C). Among the synthetic lethal genes, there was a strong enrichment for genes involved in protein synthesis especially in mitochondrial protein translation and other mitochondrial genes with various functions (Fig. 1E and 2B). Cells expressing mutant K-Ras have previously been shown to have higher rates of protein synthesis compared to K-Ras WT cells (Gao and Roux, 2015). Recently we showed that cancer cell lines that have activated PI3K pathways have higher rates of general protein synthesis and protein turnover and become impaired if either pathway is perturbed, while isogenic cells without activated PI3K are much less sensitive (Davoli et al., 2016). As K-Ras lies upstream of PI3K, part of this sensitivity could be due to activation of the PI3K pathway.
K-Ras mutant cells also have higher amounts of mitochondrial reactive oxygen species (ROS) and this increase in mitochondrial ROS is essential for K-Ras-induced tumorigenicity (Weinberg et al., 2010). However, too much ROS can overwhelm the cellular antioxidant response leading to tumor cell death. Recently, vitamin C treatment was shown to be selectively toxic for K-Ras and B-Raf mutant cells, including the same cells that we used in our screens in Fig. 1C, due to an increase in ROS resulting in inactivation of GAPDH that then leads to energetic crisis and death (Yun et al., 2015). The increased ROS associated with mutant K-Ras may lead increased damage of additional mitochondrial proteins resulting in a greater dependency on the residual mitochondrial translation to replenish damaged proteins pools in K-Ras mutant cells.
In CRISPR screens, essential genes are lost regardless of the cell lines chosen for the screen due to their requirement for viability. Recent studies identified between one and two thousand essential genes using whole-genome CRISPR screens in human cells (Wang et al., 2015; Hart et al., 2015; Blomen et al., 2015). Since we could not determine whether any of these genes have synthetic lethality interactions with mutant K-Ras in our CRISPR screens, we generated an shRNA library targeting only essential genes (Fig. 3A). We found a selective dependency of cells expressing oncogenic K-Ras (Fig. 3B) on many of these essential genes including proteasomal subunits and splicing factors, two pathways previously implicated as putative synthetic lethal pathways. Notably, we also found members of the CCT/TRiC chaperone complex including TCP1 (Fig. 3C). A recent report using RNAi screening in lung cancer cell lines identified the CCT/TRiC complex as being selectively toxic in a portion of the cell lines examined (Young et al., 2016). Interestingly, many of these cell lines are K-Ras mutant, while the WT or normal cell lines in the study were refractory to loss of CCT components. Another study found that the CCT/TRiC complex is capable of binding and assisting in the in vitro folding of Ras itself (Melki et al., 1997). Since the CCT/TRiC complex has ATPase activity, and may therefore be druggable by small molecules, it could represent a new way to selectively inhibit K-Ras mutant cell growth.
Genome-engineering techniques like CRISPR/Cas9 represents a major advancement in our ability to recapitulate the mutational events that occur during cancer development in a cell culture system. In this study, we generated a true isogenic cell model system to examine synthetic lethal interactions with mutant K-Ras by engineering immortalized human small airway cells to contain a conditional cassette so that we could precisely control the expression of endogenous mutant K-Ras through expression of Cre recombinase (Fig. 4A). Expression of mutant K-Ras in these cells was sufficient to activate K-Ras signaling and also led to cellular transformation (Fig. 4C and 4D). In support of our screening results we found that cells expressing mutant K-Ras were more sensitive to both oxidative phosphorylation and mitochondrial translation inhibition (Fig. 4E and 4F). This also demonstrates that K-Ras mutant cells derived from different tissues like the lung and colon and with different activating mutations (G13D vs. G12C) share sensitivity to mitochondrial inhibitors. Interestingly, transcriptome analysis of lung tumors expressing mutant K-Ras identified an up-regulation in oxidative phosphorylation transcripts compared to surrounding normal tissue even though complex I proteins are reported to be reduced at the protein level upon expression of mutant K-Ras (Ambrogio et al., 2016; Baracca et al., 2010). Perhaps the reduction in complex I protein levels results in the increased sensitivity we see in K-Ras mutant cells for loss of complex I genes. The ability to generate isogenic pairs with different activating mutations in a variety of cell types from various tissues will undoubtedly allow for a more thorough examination of the genes and pathways required for K-Ras mutant viability.
Our combination of CRISPR and shRNA screening, as well as the engineering of newly derived isogenic cell lines, identified a requirement on mitochondrial processes for K-Ras mutant cell growth. In support of this observation, a recent study identifying core essential genes used DLD1 K-Ras mutant cells and observed a dependence on mitochondrial translation but they did not analyze the DLD1 WT cell line for direct comparison (Hart et al., 2015). Furthermore, a whole-genome in vivo shRNA screen identified a requirement for one component of the mitoribosome, Mrpl52, in oncogenic H-Ras induced growth of mouse epidermal cells suggesting this relationship might be conserved across species (Beronja et al., 2013). K-Ras itself is known to localize to the outer membrane of the mitochondria after phosphorylation on serine 181 (Bivona et al., 2006), proteotoxic stress induced destruction of the mitochondria results in the regression of K-Ras-driven tumors (De Raedt et al., 2011), and K-Ras compartmentalized specifically to the mitochondrial outer membrane is capable of sustaining normal signaling comparable to that seen of oncogenic K-Ras (Hernandez-Valladares and Prior, 2015). It is unclear whether the dependence of K-Ras mutant cells on mitochondrial translation we observe is due to K-Ras itself directly signaling to or from the mitochondria but it is an interesting possibility. We found that K-Ras-driven tumors are sensitive to treatment with mitochondrial inhibitors including antibiotics like tigecycline (Fig. 5F). Whether these mitochondrial inhibitors can augment additional targeted therapies like BRAF or MEK inhibitors to achieve a more robust response will need to be explored in the future.
Experimental Procedures
Cell Culture and Reagents
HCT116 and DLD1 isogenic pairs of cell lines were previously described (Luo et al., 2009) and were grown in RPMI-1640 or McCoy’s 5A media supplemented with 10% FCS and 1% penicillin/streptomycin. CT26 cells were obtained from ATCC in 2016 and were maintained in RPMI-1640 with 10% FCS and 1% penicillin/streptomycin. AALE cells immortalized with hTERT and the early region of SV40 were a gift from Dr. William Hahn (Dana-Farber Cancer Institute) and were maintained in SABM media with SAGM supplements and growth factors (Lonza). All cells were maintained at 37C and 5% CO2.
Tigecycline (ApexBio, cat. # A5226) was dissolved in PBS. VLX-600 (Xcessbio, cat. # M60261-2s) and rotenone (Tocris, cat. # 3616) were dissolved in DMSO.
sgRNAs targeting mouse Mrpl52 (sgRNA #1 - GCACTGCAGCGTAGTGGCGC, sgRNA #2 - GAATACAGGCATGGAAGCTC, sgRNA #3 - GCTGCCAACCCTTCCGGCTA), Ndufb10 (sgRNA #1 -GAAGGCTTGTCAGCAGAGGG, sgRNA #2 -GAAGGCCTACGACCTCGTCG, sgRNA #3 -GGGAGCGAGGTCTGCGGCGA, sgRNA #4 -GCTATGAGGCTGAGATGCAG), and Rosa26 (sgRNA #1– GAAGATGGGCGGGAGTCTTC, sgRNA #2 - GCTGGAGTTGCAGATCACGA) were cloned into BsmBI digested lentiCRISPR V2 puro (Addgene plasmid #52961) with an FE modified tracr as described (Chen et al., 2013).
shRNAs targeting human SAMM50 (shRNA #1 – GCGGACATTCACTGAAATCAT, shRNA #2–GGAGATTAACGGGCAGTTATA, shRNA #3 - CGAAAGAAATTTCTCTGTAAT) were cloned into pGIPZ vector. shRNAs targeting human TCP1 were cloned into pHAGE ind10 mirE (shRNA #1 – CCATGATGCACTTTGTGTAGTA, shRNA #2 – CTGTGATGATGAGCTGATCTTA, shRNA #3–AACTGGTGGAATTGATGATATA, shRNA #4– CCAGAGAGAATCAGATATCACA, shRNA #5 – ACTGGCTGATCTGCAAGACAAA, shRNA #6 - CTGAGCTGATCTTAATCAAAAA). Cells were selected with puromycin (1 or 2 μg/mL). For inducible shRNA expression, 100 ng/mL doxycycline (Clontech) was added to the media.
Genome-Wide CRISPR Screening For KRas Synthetic Lethal Genes
A library of gRNAs targeting 18,166 genes with 5 gRNAs per gene for a total of approximately 91,000 gRNAs was synthesized and cloned into the lentiCRISPR V2 puro vector. Pooled virus was prepared by transfecting 293T cells with the library plasmid pool with psPax2 and pMD2.G lentiviral packaging vectors. Viral supernatants were harvested at 48 and 72 hours post transfection and concentrated with lenti-X concentrator solution (Clontech). HCT116 and DLD1 cells were infected at a low MOI (0.2) with a representation of 500 in triplicate. Cells were selected with puromycin (1 or 2 μg/mL) for 3 days until an uninfected control plate completely died. An initial cell pellet was taken as PD0, cells were grown an additional 10 population doublings (PD10), and a final cell pellet was collected. Genomic DNA was isolated by phenol:chloroform extraction and gRNAs were PCR amplified with barcoded primers for sequencing on an Illumina NextSeq 500. Sequencing reads were aligned to the initial library and counts were obtained for each gRNA. MAGeCK and EdgeR were used to calculate p-values, FDRs, and log2 fold changes for comparison between the PD10 and PD0 samples for each cell line. GO and GSEA analyses were performed using both the GenePattern server (The Broad Institute) and David Bioinformatics Resources (version 6.8).
shRNA Essential Gene Screen
A library of 18,036 shRNAs targeting 1161 essential genes with ~15 shRNAs per gene was synthesized and cloned into a doxycycline-inducible pHAGE ind10 mirE vector. One thousand shRNAs targeting E. coli genes were included as negative controls. Virus was prepared as for the CRISPR screen and the isogenic DLD1 pair of cells was infected at an MOI of 0.2 in triplicate with a representation of 1,000. Following puromycin selection, an initial PD0 cell pellet was taken and cells were treated with 100 ng/mL doxycycline to induce shRNA expression. Cells were maintained in 100 ng/mL doxycycline throughout the screen and cell pellets were taken at PD3, PD7, and PD10 to monitor the dropout of shRNAs over time. Genomic DNA isolation and sequencing of shRNAs were performed as described for the CRISPR screen.
Proliferation and Soft Agar Assays
For colony formation assays, 250 cells were plated per well of a 6-well plate in triplicate. Colonies were allowed to form over 9–14 days and were fixed with 4% paraformaldehyde (Electron Microscopy Services), stained with 0.5% crystal violet, and quantified by imageJ (NIH).
1,000 HCT116, DLD1, and CT26 or 500 AALE cells were plated per well of 96-well plates and proliferation was measured over time with either CellTiter Blue (Promega) or CyQuant Direct Cell Proliferation Reagent (Thermo). IC50 values for the indicated drugs were determined using Prism (GraphPad).
For soft agar assays, 10,000 cells in a layer of 0.6% agar were plated on a bottom layer of 0.6% agar and allowed to grow for 2–3 weeks. Colonies were stained with MTT (5 mg/mL, Sigma) and quantified using imageJ.
Animal Xenografts Assays
For all xenografts, 200,000 CT26 cells in 50uL PBS were mixed with 50uL Matrigel (Corning) and injected into 6 to 8-week old female BALB/C mice (Stock #000651, The Jackson Laboratory). For lentiCRISPR knockout experiments, tumors were measured by caliper every 3 days. For drug treatments, mice were treated every other day starting 5 days after injection with the indicated doses and tumors were measured by caliper at each treatment. Tumor volume was calculated by 0.5(length) × (width)2. All mouse work performed in this study was completed according to a protocol approved by Beth Israel Deaconess Medical Center Institutional Animal Care and Use Committee. Mice were housed in 12:12 light/dark cycle and fed ad libitum.
Generation of Isogenic KRas G12C AALE Cells
An AAV vector was designed to insert the loxP-stop-loxP (LSL) cassette 5′ to exon 2 of human KRAS. Homology of a total of 1354 bp was amplified from genomic DNA using the primers GTGCAGCGGTGATACAGGAT and TCCGGTAGTTGTAGGTTCTC and TOPO cloned into pCRII TOPO. A LSL cassette was amplified from LSL-Cas9-Rosa26TV (Addgene plasmid #61408) and was inserted 5′ to exon 2 in the pCRII vector using Gibson assembly that also introduced a unique ClaI restriction site on the 5′ side of the LSL cassette. An EF1 driven puroΔTK selection cassette flanked by FRT sites was synthesized as a gene block fragment (IDT) and introduced into the ClaI restriction site by Gibson assembly so that it was oriented in the opposite direction of the KRAS gene. An adenoviral strong splice acceptor inserted in a HindIII site just 3′ to the first loxP site in the LSL cassette. A 3xHA tag was then added to the beginning of the KRAS coding sequence between the initial methionine and the second amino acid (Thr) with a Gly-Gly-Ser linker by Gibson assembly. The G12C point mutation and point mutations to prevent Cas9 cutting of the gRNA targeting sequence in the targeting vector were made using site-directed mutagenesis. The targeting vector was PCR amplified and moved into a modified version pAAV-MCS2 (Addgene plasmid #46954) with expanded restriction enzyme sites using XhoI and NotI. Recombinant AAV2 was packaged in 293T cells using the pHelper and pRC2-mi342 plasmids (Clontech). Three days after transfection, cells were harvested by scraping and AAV2 was isolated using AAVpro Extraction Solution (Clontech). AAV was frozen at −80C until use.
One million AALE cells were nucleofected (Lonza 4D nucleofector) with plasmids to express Cas9 (pcDNA3.3-TOPO hCas9, Addgene plasmid #41815) and a gRNA targeting exon 2 of KRAS (TGACGATACAGCTAATTCA) in a pCRII U6-gRNA expression vector. One day after transfection, cells were infected with 20 μL adeno-associated virus (AAV2) containing the LSL and puroΔTK selection cassettes. Following one week of culture post-AAV infection, cells were selected with puromycin. Surviving cells were treated with adeno-FLPe (Vector Biolabs) and cells were selected with 10 μM ganciclovir (Sigma) to isolate cells that properly recombined out the puroΔTK selection cassette. Single cell clones were isolated, expanded, and genotyping PCRs and sequencing were performed to check for proper integration of the LSL cassette in the KRAS locus.
Western Blotting
All cells were lysed in MLB lysis buffer (25 mM HEPES, pH 7.5, 150 mM NaCl, 1% Igepal CA-630, 10 mM MgCl2, 1 mM EDTA, and 2% glycerol) with protease and phosphatase inhibitors (Roche). Protein was quantified by Bradford assay (Bio-Rad). Protein lysates were separated on 4–12% Bis-Tris gels (Thermo) and transferred to nitrocellulose membranes (Bio-Rad). Membranes were blocked with 5% milk in TBST (Cell Signaling) and incubated with the following antibodies: Vinculin (1:10,000, cat. # V9131) and Mrpl52 (1:1,000, cat. # HPA012319) from Sigma, Ndufb10 (1:1,000, cat. # 15589-1-AP), SAMM50 (1:1,000, cat. # 20824-1-AP) from ProteinTech, TCP1 (1:1,000, cat. # A303-444A-M) from Bethyl, phospho-Thr202/Tyr204 Erk (1:1,000, cat. # 4370P), total Erk (1:2,000, cat. # 4695P), phospho-Ser473 Akt (1:1,000, cat. # 4060P), total Akt (1:1,000, cat. # 2920S) from Cell Signaling, Ras (1:1,000, cat. # 05-516) from Millipore, and HA-HRP (1:1,000, cat. # 12013819001) from Roche. Goat anti-mouse or rabbit HRP conjugated secondary antibodies (1:5,000, cat. #s 31430 and 31460) were used for detection with ECL (Perkin-Elmer, cat. # NEL104001EA).
Ras activity levels were measured by the Ras activation assay kit (Millipore) using 100 μg of lysate and 10 μL of GST-Raf RBD beads per sample. Following a 1h incubation of the beads with lysate, beads were washed 3 times with MLB buffer, resuspended in protein sample buffer with β-mercaptoethanol, boiled for 5 min, and loaded onto 4–12% Bis-Tris gels for western blotting with the indicated antibodies.
Statistical Analyses
Differences between two groups were determined using an unpaired, two-tailed Student’s t test in Prism (Graphpad). Error bars denote S.E.M.
Supplementary Material
Raw read counts for the whole-genome CRISPR screen performed in isogenic DLD1 cells.
Synthetic lethal scores, log2 fold changes, and q-values for each gene in the CRISPR library.
Raw read counts for the whole-genome CRISPR screen performed in isogenic HCT116 cells.
Synthetic lethal scores, log2 fold changes, and q-values for each gene in the CRISPR library.
Data include raw read counts, log2 fold changes, p-values, gene rankings, and FDRs.
Data from the DLD1 isogenic screen using the essential gene shRNA library including raw read counts, log2 fold changes, p-values, FDRs, and synthetic lethal scores at PD3, PD7, and PD10.
Acknowledgments
We thank Eric Wooten for help with sequence alignment and bioinformatics analysis, Sneha Menon for help with the mouse work, and members of the Elledge lab for helpful discussions. T.D.M. is supported by a Damon Runyon Cancer Research Foundation fellowship (DRC 2199-14). This work was supported by U01CA199252 to K.M.H. and S.J.E. S.J.E. is an investigator with the Howard Hughes Medical Institute.
Footnotes
The authors declare no conflict of interest.
Author Contributions
T.D.M. and M.Y.C performed genome-wide CRISPR and essential gene shRNA screens, western blotting, cell viability and growth assays, and shRNA experiments; T.D.M. analyzed the screening data; M.Z.L. prepared the shRNA and CRISPR lentiviral libraries; D.R.C. performed all in vivo experiments; T.D.M., D.R.C., K.M.H., and S.J.E. conceived the study and wrote the paper.
Publisher's Disclaimer: This is a PDF file of an unedited manuscript that has been accepted for publication. As a service to our customers we are providing this early version of the manuscript. The manuscript will undergo copyediting, typesetting, and review of the resulting proof before it is published in its final form. Please note that during the production process errors may be discovered which could affect the content, and all legal disclaimers that apply to the journal pertain.
References
- Ambrogio C, Gomez-Lopez G, Falcone M, Vidal A, Nadal E, Crosetto N, Blasco R, Fernández-Marcos P, Sánchez-Céspedes M, Ren X, et al. Combined inhibition of DDR1 and Notch signaling is a therapeutic strategy for KRAS-driven lung adenocarcinoma. Nat Med. 2016;22(3):270–7. doi: 10.1038/nm.4041. [DOI] [PubMed] [Google Scholar]
- Baracca A, Chiaradonna F, Sgarbi G, Solaini G, Alberghina L, Lenaz G. Mitochondrial Complex I decrease is responsible for bioenergetic dysfunction in K-ras transformed cells. Biochim Biophys Acta. 2010;1797(2):314–23. doi: 10.1016/j.bbabio.2009.11.006. [DOI] [PubMed] [Google Scholar]
- Beronja S, Janki P, Heller E, Lien WH, Keyes BE, Oshimori N, Fuchs E. RNAi screens in mice identify physiological regulators of oncogenic growth. Nature. 2013;501(7466):185–90. doi: 10.1038/nature12464. [DOI] [PMC free article] [PubMed] [Google Scholar]
- Bivona TG, Quatela SE, Bodemann BO, Ahearn IM, Soskis MJ, Mor A, Miura J, Wiener HH, Wright L, Saba SG, et al. PKC regulates a farnesyl-electrostatic switch on K-Ras that promotes its association with Bcl-XL on mitochondria and induces apoptosis. Mol Cell. 2006;21(4):481–93. doi: 10.1016/j.molcel.2006.01.012. [DOI] [PubMed] [Google Scholar]
- Blomen VA, Majek P, Jae LT, Bigenzahn JW, Nieuwenhuis J, Staring J, Sacco R, van Diemen FR, Olk N, Stukalov A, et al. Gene essentiality and synthetic lethality in haploid human cells. Science. 2015;350(6264):1092–6. doi: 10.1126/science.aac7557. [DOI] [PubMed] [Google Scholar]
- Bryant HE, Schultz N, Thomas HD, Parker KM, Flower D, Lopez E, Kyle S, Meuth M, Curtin NJ, Helleday T. Specific killing of BRCA2-deficient tumours with inhibitors of poly(ADP-ribose) polymerase. Nature. 2005;434(7035):913–7. doi: 10.1038/nature03443. [DOI] [PubMed] [Google Scholar]
- Burns MC, Sun Q, Daniels RN, Camper D, Kennedy JP, Phan J, Olejniczak ET, Lee T, Waterson AG, Rossanese OW, et al. Approach for targeting Ras with small molecules that activate SOS-mediated nucleotide exchange. Proc Natl Acad Sci USA. 2014;111(9):3401–6. doi: 10.1073/pnas.1315798111. [DOI] [PMC free article] [PubMed] [Google Scholar]
- Castle JC, Loewer M, Boegel S, de Graaf J, Bender C, Tadmor AD, Boisguerin V, Bukur T, Sorn P, Paret C, et al. Immunomic, genomic and transcriptomic characterization of CT26 colorectal carcinoma. BMC Genomics. 2014;15:190. doi: 10.1186/1471-2164-15-190. [DOI] [PMC free article] [PubMed] [Google Scholar]
- Chen B, Gilbert LA, Cimini BA, Schnitzbauer J, Zhang W, Li GW, Park J, Blackburn EH, Weissman JS, Qi LS, et al. Dynamic imaging of genomic loci in living human cells by an optimized CRISPR/Cas system. Cell. 2013;155(7):1479–91. doi: 10.1016/j.cell.2013.12.001. [DOI] [PMC free article] [PubMed] [Google Scholar]
- Cox AD, Fesik SW, Kimmelman AC, Luo J, Der CJ. Drugging the undruggable RAS: Mission possible? Nat. Rev Drug Discov. 2014;13(11):828–51. doi: 10.1038/nrd4389. [DOI] [PMC free article] [PubMed] [Google Scholar]
- Cullis J, Meiri D, Sandi MJ, Radulovich N, Kent OA, Medrano M, Mokady D, Normand J, Larose J, Marcotte R, et al. The RhoGEF GEF-H1 is required for oncogenic RAS signaling via KSR-1. Cancer Cell. 2014;25(2):181–95. doi: 10.1016/j.ccr.2014.01.025. [DOI] [PubMed] [Google Scholar]
- Davoli T, Mengwasser KE, Duan J, Chen T, Christensen C, Wooten EC, Anselmo AN, Li MZ, Wong KK, Kahle KT, et al. Functional genomics reveals that tumors with activating phosphoinositide 3-kinase mutations are dependent on accelerated protein turnover. Genes Dev. 2016;30(24):2684–95. doi: 10.1101/gad.290122.116. [DOI] [PMC free article] [PubMed] [Google Scholar]
- De Raedt T, Walton Z, Yecies JL, Li D, Chen Y, Malone CF, Maertens O, Jeong SM, Bronson RT, Lebleu V, et al. Exploiting cancer cell vulnerabilities to develop a combination therapy for ras-driven tumors. Cancer Cell. 2011;20(3):400–13. doi: 10.1016/j.ccr.2011.08.014. [DOI] [PMC free article] [PubMed] [Google Scholar]
- Evers B, Jastrzebski K, Heijmans JP, Grernrum W, Beijersbergen RL, Bernards R. CRISPR knockout screening outperforms shRNA and CRISPRi in identifying essential genes. Nat Biotechnol. 2016;34(6):631–3. doi: 10.1038/nbt.3536. [DOI] [PubMed] [Google Scholar]
- Farmer H, McCabe N, Lord CJ, Tutt AN, Johnson DA, Richardson TB, Santarosa M, Dillon KJ, Hickson I, Knights C, et al. Targeting the DNA repair defect in BRCA mutant cells as a therapeutic strategy. Nature. 2005;434(7035):917–21. doi: 10.1038/nature03445. [DOI] [PubMed] [Google Scholar]
- Gao B, Roux PP. Translational control by oncogenic signaling pathways. Biochim Biophys Acta. 2015;1849(7):753–65. doi: 10.1016/j.bbagrm.2014.11.006. [DOI] [PubMed] [Google Scholar]
- Griswold DP, Corbett TH. A colon tumor model for anticancer agent evaluation. Cancer. 1975;36(6 Suppl):2441–4. doi: 10.1002/1097-0142(197512)36:6<2441::aid-cncr2820360627>3.0.co;2-p. [DOI] [PubMed] [Google Scholar]
- Hart T, Chandrashekhar M, Aregger M, Steinhart Z, Brown KR, MacLeod G, Mis M, Zimmermann M, Fradet-Turcotte A, Sun S, et al. High-Resolution CRISPR Screens Reveal Fitness Genes and Genotype-Specific Cancer Liabilities. Cell. 2015;163(6):1515–26. doi: 10.1016/j.cell.2015.11.015. [DOI] [PubMed] [Google Scholar]
- Hernandez-Valladares M, Prior IA. Comparative proteomic analysis of compartmentalised Ras signalling. Sci Rep. 2015;5:17307. doi: 10.1038/srep17307. [DOI] [PMC free article] [PubMed] [Google Scholar]
- Kim HS, Mendiratta S, Kim J, Pecot CV, Larsen JE, Zubovych I, Seo BY, Kim J, Eskiocak B, Chung H, et al. Systematic identification of molecular subtype-selective vulnerabilities in non-small-cell lung cancer. Cell. 2013;155(3):552–66. doi: 10.1016/j.cell.2013.09.041. [DOI] [PMC free article] [PubMed] [Google Scholar]
- Lito P, Solomon M, Li LS, Hansen R, Rosen N. Allele-specific inhibitors inactivate mutant KRAS G12C by a trapping mechanism. Science. 2016;351(6273):604–8. doi: 10.1126/science.aad6204. [DOI] [PMC free article] [PubMed] [Google Scholar]
- Lundberg AS, Randell SH, Stewart SA, Elenbaas B, Hartwell KA, Brooks MW, Fleming MD, Olsen JC, Miller SW, Weinberg RA, et al. Immortalization and transformation of primary human airway epithelial cells by gene transfer. Oncogene. 2002;21(29):4577–86. doi: 10.1038/sj.onc.1205550. [DOI] [PubMed] [Google Scholar]
- Luo J, Emanuele MJ, Li D, Creighton CJ, Schlabach MR, Westbrook TF, Wong KK, Elledge SJ. A genome-wide RNAi screen identifies multiple synthetic lethal interactions with the Ras oncogene. Cell. 2009;137(5):835–48. doi: 10.1016/j.cell.2009.05.006. [DOI] [PMC free article] [PubMed] [Google Scholar]
- Melki R, Batelier G, Soulie S, Williams RC., Jr Cytoplasmic chaperonin containing TCP-1: structural and functional characterization. Biochemistry. 1997;36(19):5817–26. doi: 10.1021/bi962830o. [DOI] [PubMed] [Google Scholar]
- Nielsen CH, Jensen MM, Kristensen LK, Dahlman A, Frohlich C, Jacobsen HJ, Poulsen TT, Lantto J, Horak ID, Kragh M, et al. In vivo imaging of therapy response to a novel pan-HER antibody mixture using FDG and FLT positron emission tomography. Oncotarget. 2015;6(35):37486–99. doi: 10.18632/oncotarget.6060. [DOI] [PMC free article] [PubMed] [Google Scholar]
- Ostrem JM, Peters U, Sos ML, Wells JA, Shokat KM. K-Ras(G12C) inhibitors allosterically control GTP affinity and effector interactions. Nature. 2013;503(7477):548–51. doi: 10.1038/nature12796. [DOI] [PMC free article] [PubMed] [Google Scholar]
- Platt RJ, Chen S, Zhou Y, Yim MJ, Swiech L, Kempton HR, Dahlman JE, Parnas O, Eisenhaure TM, Jovanovic M, et al. CRISPR-Cas9 knockin mice for genome editing and cancer modeling. Cell. 2014;159(2):440–55. doi: 10.1016/j.cell.2014.09.014. [DOI] [PMC free article] [PubMed] [Google Scholar]
- Scholl C, Frohling S, Dunn IF, Schinzel AC, Barbie DA, Kim SY, Silver SJ, Tamayo P, Wadlow RC, Ramaswamy S, et al. Synthetic lethal interaction between oncogenic KRAS dependency and STK33 suppression in human cancer cells. Cell. 2009;137(5):821–34. doi: 10.1016/j.cell.2009.03.017. [DOI] [PubMed] [Google Scholar]
- Shirasawa S, Furuse M, Yokoyama N, Sasazuki T. Altered growth of human colon cancer cell lines disrupted at activated Ki-ras. Science. 1993;260(5104):85–8. doi: 10.1126/science.8465203. [DOI] [PubMed] [Google Scholar]
- Skrtić M, Sriskanthadevan S, Jhas B, Gebbia M, Wang X, Wang Z, Hurren R, Jitkova Y, Gronda M, Maclean N, et al. Inhibition of mitochondrial translation as a therapeutic strategy for human acute myeloid leukemia. Cancer Cell 2011. 2011 Nov 15;20(5):674–88. doi: 10.1016/j.ccr.2011.10.015. [DOI] [PMC free article] [PubMed] [Google Scholar]
- Smakman N, Veenendaal LM, van Diest P, Bos R, Offringa R, Borel Rinkes IH, Kranenburg O. Dual effect of Kras(D12) knockdown on tumorigenesis: increased immune-mediated tumor clearance and abrogation of tumor malignancy. Oncogene. 2005;24(56):8338–42. doi: 10.1038/sj.onc.1208995. [DOI] [PubMed] [Google Scholar]
- Spencer-Smith R, Koide A, Zhou Y, Eguchi RR, Sha F, Gajwani P, Santana D, Gupta A, Jacobs M, Herrero-Garcia E, et al. Inhibition of RAS function through targeting an allosteric regulatory site. Nat Chem Biol. 2017;13(1):62–8. doi: 10.1038/nchembio.2231. [DOI] [PMC free article] [PubMed] [Google Scholar]
- Stein GE, Craig WA. Tigecycline: a critical analysis. Clin Infect Dis. 2006;43(4):518–24. doi: 10.1086/505494. [DOI] [PubMed] [Google Scholar]
- Wang T, Birsoy K, Hughes NW, Krupczak KM, Post Y, Wei JJ, Lander ES, Sabatini DM. Identification and characterization of essential genes in the human genome. Science. 2015;350(6264):1096–101. doi: 10.1126/science.aac7041. [DOI] [PMC free article] [PubMed] [Google Scholar]
- Weinberg F, Hamanaka R, Wheaton WW, Weinberg S, Joseph J, Lopez M, Kalyanaraman B, Mutlu GM, Budinger GR, Chandel NS. Mitochondrial metabolism and ROS generation are essential for Kras-mediated tumorigenicity. Proc Natl Acad Sci USA. 2010;107(19):8788–93. doi: 10.1073/pnas.1003428107. [DOI] [PMC free article] [PubMed] [Google Scholar]
- Young JH, Peyton M, Seok Kim H, McMillan E, Minna JD, White MA, Marcotte EM. Computational discovery of pathway-level genetic vulnerabilities in non-small-cell lung cancer. Bioinformatics. 2016;32(9):1373–9. doi: 10.1093/bioinformatics/btw010. [DOI] [PMC free article] [PubMed] [Google Scholar]
- Yun J, Mullarky E, Lu C, Bosch KN, Kavalier A, Rivera K, Roper J, Chio II, Giannopoulou EG, Rago C, et al. Vitamin C selectively kills KRAS and BRAF mutant colorectal cancer cells by targeting GAPDH. Science. 2015;350(6266):1391–6. doi: 10.1126/science.aaa5004. [DOI] [PMC free article] [PubMed] [Google Scholar]
- Zhang X, Fryknas M, Hernlund E, Fayad W, De Milito A, Olofsson MH, Gogvadze V, Dang L, Påhlman S, Schughart LA, et al. Induction of mitochondrial dysfunction as a strategy for targeting tumour cells in metabolically compromised microenvironments. Nat Commun. 2014;5:3295. doi: 10.1038/ncomms4295. [DOI] [PMC free article] [PubMed] [Google Scholar]
- Zimmermann G, Papke B, Ismail S, Vartak N, Chandra A, Hoffmann M, Hahn SA, Triola G, Wittinghofer A, Bastiaens PI, et al. Small molecule inhibition of the KRAS-PDEdelta interaction impairs oncogenic KRAS signalling. Nature. 2013;497(7451):638–42. doi: 10.1038/nature12205. [DOI] [PubMed] [Google Scholar]
Associated Data
This section collects any data citations, data availability statements, or supplementary materials included in this article.
Supplementary Materials
Raw read counts for the whole-genome CRISPR screen performed in isogenic DLD1 cells.
Synthetic lethal scores, log2 fold changes, and q-values for each gene in the CRISPR library.
Raw read counts for the whole-genome CRISPR screen performed in isogenic HCT116 cells.
Synthetic lethal scores, log2 fold changes, and q-values for each gene in the CRISPR library.
Data include raw read counts, log2 fold changes, p-values, gene rankings, and FDRs.
Data from the DLD1 isogenic screen using the essential gene shRNA library including raw read counts, log2 fold changes, p-values, FDRs, and synthetic lethal scores at PD3, PD7, and PD10.