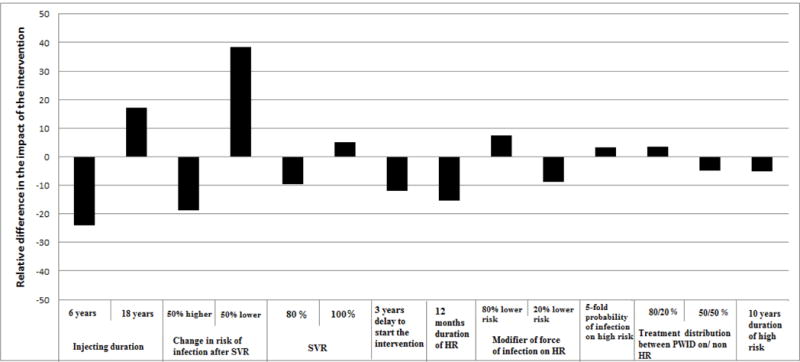
Figure 5.

Results of one-way sensitivity analysis showing the relative difference in CHC prevalence projected in 2030 for varying parameters of the model compared to the base parameter values in Table 1. A value of zero describes no change from the projected CHC prevalence in 2030 compared to the base scenario. A positive or a negative value means that the projected CHC prevalence is lower or higher, respectively, compared to that projected under the base scenario. The scenario of 332 annual antiviral treatments was used.
