

Abstract
Purpose
Model observers have been successfully developed and used to assess the quality of static 2D CT images. However, radiologists typically read images by paging through multiple 2D slices (i.e., multislice reading). The purpose of this study was to correlate human and model observer performance in a low‐contrast detection task performed using both 2D and multislice reading, and to determine if the 2D model observer still correlate well with human observer performance in multislice reading.
Methods
A phantom containing 18 low‐contrast spheres (6 sizes × 3 contrast levels) was scanned on a 192‐slice CT scanner at five dose levels (CTDI vol = 27, 13.5, 6.8, 3.4, and 1.7 mGy), each repeated 100 times. Images were reconstructed using both filtered‐backprojection (FBP) and an iterative reconstruction (IR) method (ADMIRE, Siemens). A 3D volume of interest (VOI) around each sphere was extracted and placed side‐by‐side with a signal‐absent VOI to create a 2‐alternative forced choice (2AFC) trial. Sixteen 2AFC studies were generated, each with 100 trials, to evaluate the impact of radiation dose, lesion size and contrast, and reconstruction methods on object detection. In total, 1600 trials were presented to both model and human observers. Three medical physicists acted as human observers and were allowed to page through the 3D volumes to make a decision for each 2AFC trial. The human observer performance was compared with the performance of a multislice channelized Hotelling observer (CHO_MS), which integrates multislice image data, and with the performance of previously validated CHO, which operates on static 2D images (CHO_2D). For comparison, the same 16 2AFC studies were also performed in a 2D viewing mode by the human observers and compared with the multislice viewing performance and the two CHO models.
Results
Human observer performance was well correlated with the CHO_2D performance in the 2D viewing mode [Pearson product‐moment correlation coefficient R = 0.972, 95% confidence interval (CI): 0.919 to 0.990] and with the CHO_MS performance in the multislice viewing mode (R = 0.952, 95% CI: 0.865 to 0.984). The CHO_2D performance, calculated from the 2D viewing mode, also had a strong correlation with human observer performance in the multislice viewing mode (R = 0.957, 95% CI: 879 to 0.985). Human observer performance varied between the multislice and 2D modes. One reader performed better in the multislice mode (P = 0.013); whereas the other two readers showed no significant difference between the two viewing modes (P = 0.057 and P = 0.38).
Conclusions
A 2D CHO model is highly correlated with human observer performance in detecting spherical low contrast objects in multislice viewing of CT images. This finding provides some evidence for the use of a simpler, 2D CHO to assess image quality in clinically relevant CT tasks where multislice viewing is used.
Keywords: channelized Hotelling observer (CHO), computed tomography (CT), image quality, model observer, multislice reading, task‐based image quality assessment
1. Introduction
Task‐based image quality assessment using model observers1, 2 has gained popularity in recent years to objectively quantify imaging performance in clinical CT.3, 4, 5, 6, 7, 8, 9, 10, 11 Some of the applied models operate in the spatial frequency domain assuming linear shift invariance4, 6, 8, 11; whereas, others, primarily channelized Hotelling observers (CHO), operate in spatial domain.3, 5, 7, 9, 10 Spatial domain CHO‐based model observers are advantageous because they are applicable to images formed by nonlinear iterative reconstruction (IR) or denoizing processes.10, 12, 13, 14
For many image quality assessment applications, it is important to validate the correlation between model and human observer performance. The performance of different CHO models have been previously validated for different tasks, including: low‐contrast object detection,5 low‐contrast object localization,7 and object classification.9 However, these studies focused on tasks that only involve 2D signals in static 2D images, and both model and human observer tasks were performed on 2D images.
In CT clinical practice, radiologists often read images by scrolling through multiple image slices to detect or characterize 3D lesions. Information acquired from this multislice (MS) viewing mode is inherently integrated by the radiologist's visual system to render a decision or diagnosis. This MS viewing mode differs from either a 2D static viewing mode or a fully 3D viewing mode that utilizes various 3D rendering techniques. Several strategies have been previously developed to model MS viewing into CHOs.15, 16 Application of these models and the correlation with human observer performance in low‐contrast detection tasks were investigated in two recent studies.17, 18
Despite these two fairly limited studies, it remains challenging to fully model all the visual effects when scrolling through multiple images in a 3D volume. Relatively little is known regarding how radiologists detect lesions in this type of combined spatial‐temporal image display. In addition, CHO models that incorporate MS viewing (CHO_MS) will need more free parameters than CHO_2D, and so it may require substantially more sample images for validation and training, which increases image acquisition and processing burden as compared to CHO models operating purely in 2D (CHO_2D). Because of the difficulty in modelling the MS viewing, the amount of data needed, and the computational complexity, CHO_MS has not been aggressively pursued for routine quality control and imaging performance assessment. Conversely, the more facile application of CHO_2D promotes its use for routine quality assessment. So it would not be unreasonable to investigate if a 2D model, which has years of validation, can still have a good correlation with human observer performance in a task involving MS viewing – a more clinically relevant task. If this correlation can be demonstrated, then a CHO_2D could still be confidently applied for routine image quality assessment or quality control testing.
The purpose of this study was to have both human and model observers perform a phantom‐based low‐contrast object detection tasks in both 2D and MS viewing modes, and to compare the resulting performance metrics. The specific tasks included detection of low‐contrast objects of multiple sizes and contrast levels that were imaged at different radiation dose levels and reconstructed with both filtered‐backprojection (FBP) and IR methods. In the current study, the task will be limited to a simple 2‐alternative forced choice (2AFC) detection of spherical signal with shape, size, and contrast known exactly and a uniform background.
2. Methods
2.A. CT data acquisition
In this study, a phantom (Helical CT Phantom, CIRS Inc., Norfolk, VA, USA) with a diameter of 18 cm and a length of 4 cm was used [Fig. 1(a)]. The phantom contained three groups of low‐contrast objects [nominal contrast levels: 5, 10, and 15 HU below the liver‐equivalent background (~50 HU)]. Each contrast‐level group included six spheres and two rods. The diameters of the six spheres were 2.4, 3.2, 4.0, 4.8, 6.3, and 9.5 mm. A cross‐section of the phantom is shown in Fig. 1(b). In this study, we investigated detection of the five spheres with diameters between 3.2 mm and 9.5 mm only, which were the objects from the third row to the seventh row in the figure.
Figure 1.
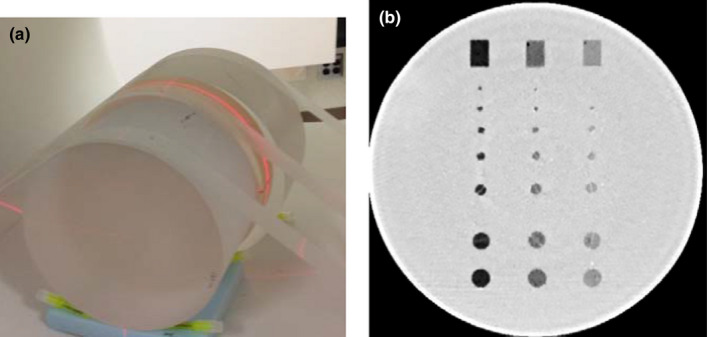
(a) Phantom setup for CT scans. Additional cylindrical phantoms were added to each end of the low‐contrast phantom to avoid the edge effect caused by the phantom‐air interface. (b) An example image showing the low‐contrast module of the phantom. The nominal contrast level of the three groups of low‐contrast disks are −20, −10, and −5 HU respectively. The objects used in this study were spheres from the 3rd row to the 7th row, which had a diameter of 3.2, 4.0, 4.8, 6.3, and 9.5 mm respectively. [Color figure can be viewed at wileyonlinelibrary.com]
The phantom was scanned on a dual‐source 192‐slice CT scanner (Somatom Force, Siemens Healthcare, Forchheim, Germany), operated in single‐source mode with the full 50 cm scan field of view. The scanning parameters were as follows: 120 kV, 192 × 0.6 mm detector configuration (physical z‐coverage 96 × 0.6 mm, with a z‐flying focal spot), 0.5 second rotation time, and 0.6 helical pitch. Five fixed tube current settings were used: 400, 200, 100, 50, and 25 effective mAs (mAs/pitch), corresponding to a volume CTDI (CTDIvol) of 27, 13.5, 6.8, 3.4, and 1.7 mGy respectively. Automatic exposure control was not used since the phantom is a cylinder. At each dose level, the phantom was scanned 100 times to provide an ensemble set of images for both human and model observers. Images were reconstructed using both a medium‐smooth filtered backprojection (FBP) kernel, Br40, that is typically used for soft tissue reconstruction, and an IR method (ADMIRE, ADaptive Model‐based Iterative Reconstruction, Siemens Healthcare) with a strength setting of 3, Br40‐3. The strength setting of the IR method was from 1 to 5, with 1 the weakest and 5 the strongest noise reduction. Image slice thickness and increment were 1 mm and 0.5 mm respectively. Reconstruction field of view was 18 cm × 18 cm, which included the entire phantom.
2.B. Data preparation for observer studies
To evaluate the impact from radiation dose, lesion size, lesion contrast, and reconstruction methods, 16 conditions were selected from 50 possible experimental conditions (5 diameters, 5 dose levels, and 2 reconstruction algorithms) for the observer studies, which are listed in Table 1. These 16 conditions can be categorized into 4 groups: (a) varying dose levels for FBP reconstruction (Conditions 1–5); (b) varying dose levels for IR reconstruction (Conditions 6–10); (c) varying lesion contrast (Conditions 11, 2, and 12); (d) varying lesion sizes (Conditions 13, 2, 14, 15, and 16).
Table 1.
Configurations for different effective mAs, reconstruction algorithm, object contrast and size in the 16 2AFC study
| 1 | 2 | 3 | 4 | 5 | 6 | 7 | 8 | 9 | 10 | 11 | 12 | 13 | 14 | 15 | 16 | |
|---|---|---|---|---|---|---|---|---|---|---|---|---|---|---|---|---|
| Eff. mAs | 25 | 50 | 100 | 200 | 400 | 25 | 50 | 100 | 200 | 400 | 50 | 50 | 50 | 50 | 50 | 50 |
| Recon | FBP | FBP | FBP | FBP | FBP | IR | IR | IR | IR | IR | IR | IR | IR | IR | IR | IR |
| Object contrast (HU) | 10 | 10 | 10 | 10 | 10 | 10 | 10 | 10 | 10 | 10 | 5 | 20 | 10 | 10 | 10 | 10 |
| Object diameter (mm) | 4 | 4 | 4 | 4 | 4 | 4 | 4 | 4 | 4 | 4 | 4 | 4 | 3.2 | 4.8 | 6.3 | 9.5 |
A 3D volume of interest (VOI) surrounding each sphere was extracted (Fig. 2). In the axial slice, the dimension of the VOI was approximately three times the diameter of each sphere. Along the longitudinal direction, the dimension of the VOI was equal to the diameter of each sphere. For each sphere, another 3D VOI was extracted from exactly the same in‐plane location, but 2 cm away along the longitudinal direction. These VOI served as the signal‐absent background.
Figure 2.
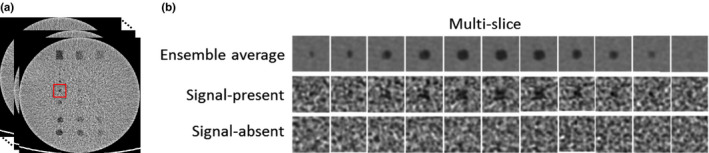
Extraction of multislice images surrounding low‐contrast objects with signal present and signal absent (a). The signal present images after ensemble average over 100 scans are also shown in the first row of (b). [Color figure can be viewed at wileyonlinelibrary.com]
Signal present and absent VOIs were randomly placed side‐by‐side to create a 2‐alternative forced choice (2AFC) trial. For each 2AFC trial, observers were challenged to decide which VOI contained the signal. Sixteen 2AFC studies were generated, each with 100 trials. In total, 1600 trials were presented to both model and human observers.
2.C. Human observer studies
Three board‐certified medical physicists participated in the human observer studies. Each was presented 16 2AFC studies for multislice viewing mode. Observers were allowed to page back and forth through multiple slices of the 3D volumes. The observer controlled the scrolling speed according to their own comfort level. For each 2AFC task, the object's expectation image (created from the ensemble average) was presented to the human observer and displayed next to the sample test images in the graphical user interface (Fig. 3). For comparison, the same 16 2AFC studies were also performed in a 2D viewing mode. In this mode, only the central slice was shown and the observers were not allowed to scroll through the slices. In all studies, images were displayed in a fixed window width (80 HU) and window level (50 HU). The viewing distance was approximately 40–50 cm. The display monitors were calibrated based on those specified in the ACR Technical Standard for Electronic Practice. The observation rooms were dimly illuminated with low ambient light in line with ACR specifications. The observers were encouraged to take a break between reading sessions to avoid fatigue. Percent correct (Pc) values for each observer and each 2AFC study were calculated by dividing the number of correct decisions by 100 – the total number of trials.
Figure 3.
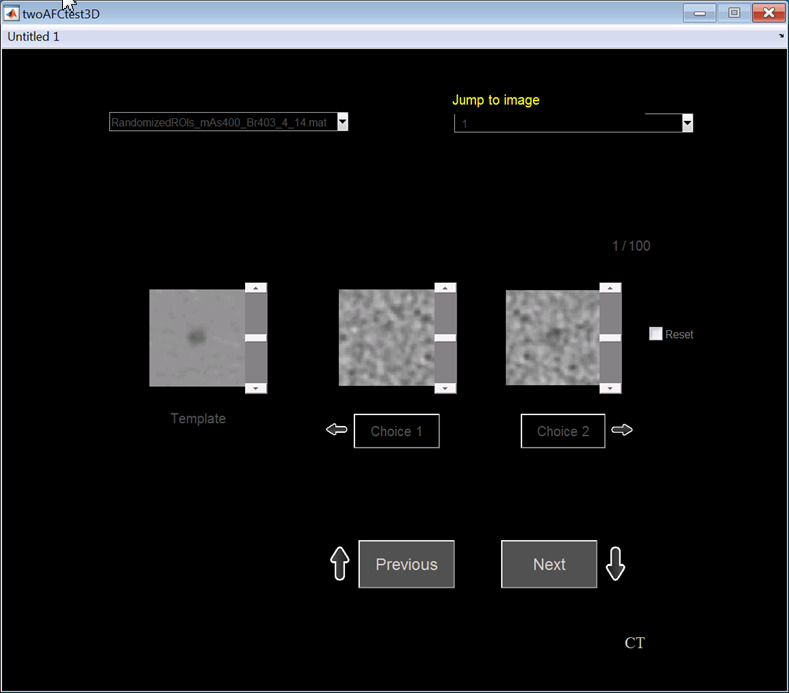
Graphical user interface for the 2AFC human observer studies in both static 2D viewing mode and multislice viewing mode. The ensemble average of the signal‐present images was shown at the side. In the MS mode, observers were required to scroll multiple slices before they made a decision. In the 2D mode, observers were not allowed to scroll slices. [Color figure can be viewed at wileyonlinelibrary.com]
2.D. Model observer studies
2.D.1. CHO_2D
For images presented in the 2D static viewing mode, a previously validated CHO_2D model was used to calculate the Pc for each of the 16 conditions at different dose levels, reconstructions, object contrast and sizes.5 The CHO calculation is briefly summarized below.
The test statistic of a CHO is given by , where is the channelized image and is the template defined as1
| (1) |
where and are the channelized ensemble average of the signal present and signal absent images respectively. is the channelized intraclass scatter matrix (average of the covariance matrix for the channelized images when the signal is present and absent: and ). is the matrix representation of the channel filters. and denote the channelized images when signal is present and absent respectively.
Many different types of filters have been used to channelize images, including Gabor,19 Laguerre‐Gauss (LG),20, 21, 22, 23 and difference of Gaussian (DOG).24 In this study, we applied Gabor filters as they have been demonstrated to model human visual system responses.25 A 2D version of Gabor filters can be expressed as3
| (2) |
where is channel width in spatial domain, central frequency, orientation, and phase factor. Four channel passbands were used: [1/64, 1/32], [1/32, 1/16], [1/16, 1/8], and [1/8, 1/4] cycles/pixel. The corresponding center frequencies were 3/128, 3/64, 3/32, and 3/16 cycles/pixel, and the corresponding bandwidths were 1/64, 1/32, 1/16, and 1/8 respectively. The channel width , where is the bandwidth in spatial frequency domain. Three orientations (0, π/3, and 2π/3 radians) and 1 phase (0) were also used. Compared to the setup that was used in Ref. 5, a few changes were made. First, only 1 phase was used. Second, the number of passbands was reduced from 6 to 4. Third, the number of orientations was reduced from 5 to 3. These changes led to a total of 12 channels in the current CHO implementation. The reason why we reduced the number of channels was because the contribution by the additional phase, frequency passbands, and orientations was negligible for the studied task. More importantly, fewer number of channels may lead to better statistics of the CHO calculation and may require fewer number of repeated scans.26 With 12 channels, the currently available 100 repeated scans are sufficient to train the covariance matrices and provide negligible bias in a resubstitution method.
2.D.2. CHO_MS
We applied a multislice CHO (CHO_MS) method originally proposed by Chen et al.15 and later expanded by Plastisa et al.16 to predict the observer performance when a multislice viewing mode was used. In Plastisa et al.'s work, three different designs of CHO_MS were proposed, types a, b, and c, to model how human observers utilize the multislice information when scrolling across slices. In the current study, we focused on the type‐a method, which was also used by Gifford et al.27
In this method, 2D CHO templates are first estimated for all slices, slice by slice, using the training set of VOI, which is given by
| (3) |
where denotes the total number of slices in the VOI and the index of slices. The variables in this equation is the same as that in Eq. (1) except that all the variables are calculated for each slice, . For a test VOI consisting of multiple slices , each 2D slice is channelized using the same channel filters by and denotes the mean of the intraclass scatter matrix for each slice . The test statistics for each slice is calculated as . This first step is called a pre‐processing step, where the calculation of test statistics for each slice is performed in essentially the same way as that in the CHO_2D calculation except that different templates are applied for each slice.
After obtaining the test statistics for each slice, the next step was to integrate them into a single test statistic, which was achieved by using a Hotelling model. With relatively few elements, which are determined from only tens or hundreds of slices, channelization is not necessary. The test statistics for all n slices can be written in a form of vector, . The Hotelling model first calculates a template for all n slices combined, which is given by
| (4) |
where and denote the vectors of the mean test statistics of the signal present and absent VOIs, respectively, denotes the intraclass scatter matrix of the test statistics, i.e., the mean of the covariance matrix: and for signal present and absent VOIs respectively. An integrated test statistic is subsequently calculated by
| (5) |
This step is called the multislice integration step. Figure 4 illustrates the procedures to calculate the test statistics integration across multiple slices.
Figure 4.
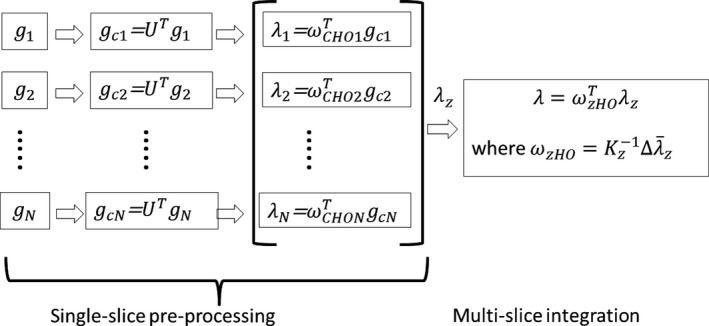
Illustration of the procedure for CHO_MS calculation. Two primary steps are involved. The first step is referred to as single‐slice preprocessing, where the calculation of test statistics for each slice is performed in the same way as that in the CHO_2D calculation except that different templates are applied for each slice. The second step is called multislice integration, which involves integrating test statistics from multiple slices into a single test statistic by using a Hotelling model. This procedure is essentially the same as the method proposed by Chen et al.15 and the type a method described by Plastisa et al.16
In the CHO_MS calculation, we applied the same Gabor filter parameters as in the CHO_2D calculation: 4 passbands × 3 orientations × 1 phase = 12 channels.
2.D.3. Internal noise
After calculating the test statistics, an internal noise component was added according to the following equation:
| (6) |
where is a weighting factor, is a normally distributed random variable with a zero mean and a standard deviation of that were obtained from the square root of the variance of the test statistics for the signal‐absent images. For the CHO_2D, the internal noise was added to the test statistics of the central slice. For the CHO_MS, the internal noise was added to the test statistics after multislice integration. The internal noise weighting factor was set to 1.35 and 1.9 for the CHO_2D and CHO_MS respectively. The weighting factor was determined by using the condition 7 (50 mAs, 14 HU, 4 mm, Br40‐3) as the calibration reference to match the model observer and human observer performance. After adding the internal noise, the test statics were compared and the 2AFC decision was made.
2.E. Figure of merit and data analysis
The percent correct (Pc) for 100 pairs of signal‐present and signal‐absent images (VOIs) was calculated and used as the figure of merit (FOM) to describe the low‐contrast detectability. The Pc obtained from the 2AFC experiment is equivalent to the area under the receiver operating characteristic (ROC) curve (Az).
We used a “resubstitution” strategy28 to calculate the test statistics, i.e., the same set of images was used for training and testing the model. In other words, the same set of images used to build the template were used to calculate the decision variables and hence the FOM. Different from the holdout method, this method introduces positive bias in the FOM, but decreases with increasing number of samples (i.e., scans).
In order to obtain the mean and standard deviation of the test statistics, a bootstrap method was used, in which 100 samples were selected with replacement from the existing 100 images (VOIs) to create new datasets. The likelihood of selecting each sample is the same and each image can be selected repeatedly. Each condition was repeated 200 times to calculate the mean and standard deviation of the test statistics.
The mean and standard deviation of the three reader results for each condition were calculated. The Pearson product‐moment correlation coefficient between the CHO and human observer results (averaged over the three readers for each condition) was calculated for (a) CHO_2D vs. human observer in the 2D viewing mode, and (b) CHO_MS vs. human observer in the MS viewing mode (JMP 9.0.1, SAS Institute Inc., Cary, NC, USA). To determine if CHO_2D still correlates well with human observer in the MS viewing mode, we also calculated the correlation between (c) CHO_2D (calculated from the 2D viewing mode) vs. human observer in the MS viewing mode.
3. Results
3.A. Correlation between CHO and human observers in the 2D viewing mode
Figure 5 compares the performance of human observers and CHO_2D for each of the 16 conditions. To better visualize the results, the 16 conditions listed in Table 1 were categorized into 4 groups and plotted in the same figure: (a) varying dose levels with other factors fixed (10 HU, 4 mm, FBP); (b) varying dose levels with other factors fixed (10 HU, 4 mm, IR); (c) varying lesion contrast with other factors fixed (50 mAs, 4 mm, IR); (d) varying lesion sizes with other factors fixed (50 mAs, 10 HU, IR). The CHO_2D had a high correlation with human observers in the 2D viewing mode [Pearson product‐moment correlation coefficient R = 0.972, 95% confidence interval (CI): 0.919 to 0.990]. The three later groups of the plot in Fig. 5 share one data point from the same condition (50 mAs, 10 HU, 4 mm, IR) for visualization purpose, but were only counted once in the correlation calculation. This correlation between model and human observers in the 2D viewing mode was consistent with our previous results in Ref. 5.
Figure 5.
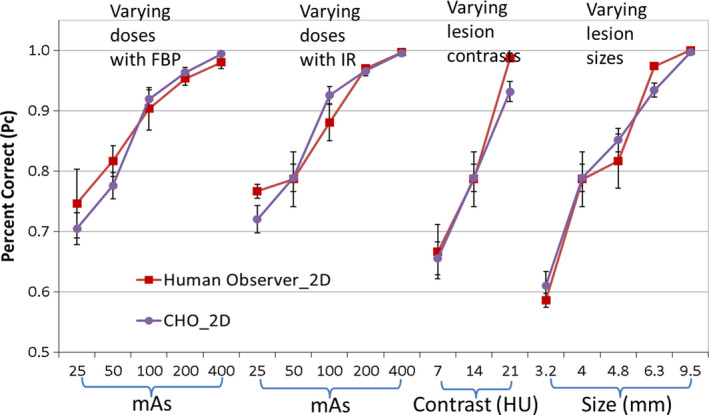
Comparison between CHO_2D and human observers in the 2D viewing mode. [Color figure can be viewed at wileyonlinelibrary.com]
3.B. Correlation between CHO_MS and human observers in the MS viewing mode
Figure 6 compares the performance of human observers and CHO_MS for each of the 16 conditions. Again, the 16 conditions listed in Table 1 were categorized into four groups and plotted in the same figure. Observer performance was highly correlated between CHO_MS and human observers using the multislice viewing mode (R = 0.952, 95% CI: 0.865 to 0.984).
Figure 6.
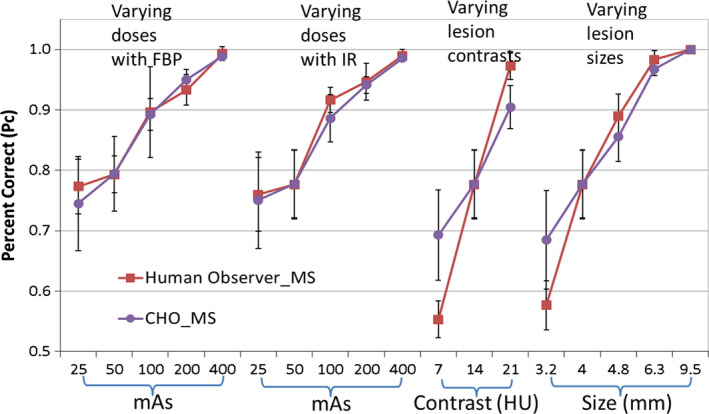
Comparison between CHO_MS and human observers in the MS viewing mode. [Color figure can be viewed at wileyonlinelibrary.com]
3.C. Correlation between CHO_2D and human observers in the MS viewing mode
Figure 7 compares the performance of human observers in the MS viewing mode and CHO_2D for each of the 16 conditions. Again, the 16 conditions listed in Table 1 were categorized into 4 groups and plotted in the same figure. It can be seen that observer performance was highly correlated between CHO_2D in the 2D viewing mode and human observers in the MS viewing mode (R = 0.957, 95% CI: 0.879 to 0.985).
Figure 7.
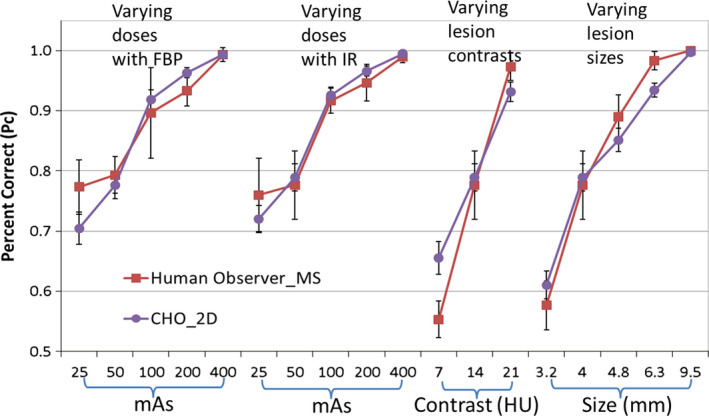
Comparison between CHO_2D in the 2D viewing mode and human observers in the MS viewing mode. [Color figure can be viewed at wileyonlinelibrary.com]
Table 2 shows the correlation between various combinations. It is interesting to note that, although the CHO_MS correlates well with human observers in the MS viewing mode, the correlation coefficient was the worst among all configurations.
Table 2.
Correlation between model and human observers in both 2D and MS viewing modes
| Correlation | Lower 95% CI | Upper 95% CI | ||
|---|---|---|---|---|
| Human_MS | Human_2D | 0.9647 | 0.8988 | 0.988 |
| CHO_2D | Human_2D | 0.9719 | 0.9189 | 0.9904 |
| CHO_2D | Human_MS | 0.9574 | 0.8788 | 0.9854 |
| CHO_MS | Human_2D | 0.9645 | 0.8983 | 0.9879 |
| CHO_MS | Human_MS | 0.9523 | 0.8648 | 0.9837 |
| CHO_MS | CHO_2D | 0.9825 | 0.9489 | 0.9941 |
Does the MS viewing mode improve performance over the 2D mode?
Figure 8 compares the human observer performance in the MS viewing mode and the 2D mode for Readers 1, 2, 3, and all readers averaged. Human observer performance varied among readers between the MS and 2D modes (Table 3). One reader performed better in the MS mode; whereas the other 2 readers showed no significant difference between the 2 modes. Overall, there was no significant difference between the 2D and the MS viewing modes.
Figure 8.
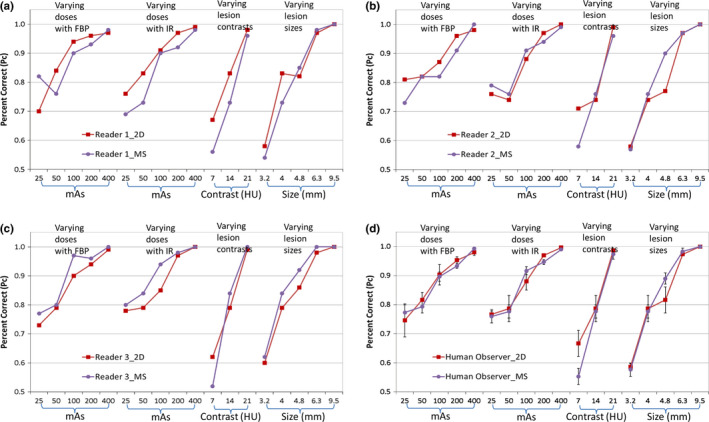
Comparison of human observer performance between the 2D and MS viewing modes: (a) Reader 1; (b) Reader 2; (c) Reader 3; (d) All readers. [Color figure can be viewed at wileyonlinelibrary.com]
Table 3.
Comparison among readers between the 2D and MS viewing modes
| Reader 1 | Reader 2 | Reader 3 | All readers | |
|---|---|---|---|---|
| Mean difference | −0.02 | −0.01 | 0.02 | −0.006 |
| CI lower 95% | −0.054 | −0.040 | −0.001 | −0.045 |
| CI upper 95% | 0.0053 | 0.020 | 0.043 | 0.034 |
| Wilcoxon signed rank test | P = 0.057 | P = 0.38 | P = 0.013 | P = 0.66 |
4. Discussion
We performed a human and model observer study to compare the performance of low‐contrast detection in a 2AFC task using both a 2D static viewing mode and a MS viewing mode. The model observer was based on CHO and calculated for both modes: CHO_2D and CHO_MS. There were 4 major findings from this study: (I) CHO_2D is highly correlated with human observers in the 2D viewing mode; (II) CHO_MS is also well‐correlated with human observers in the MS viewing mode; (III) CHO_2D in the 2D viewing mode is well correlated with human observers in the MS viewing mode; (IV) No significant improvement was shown for the MS viewing mode over the 2D viewing mode for human observers in the studied 2AFC low‐contrast detection task.
Findings (I) and (II) are not new. Finding (I) confirmed the results shown in our previous publication: the CHO_2D correlates well with human observers in a 2D static viewing mode.5 Finding (II) was similar to the results shown in a recent publication by Ba et al.29 where they showed a good agreement between CHO_MS and human observers in the MS viewing mode as well. In Ba et al.'s study, two different models were tested, one using a slice‐specific template (the same as in the current study) and the other using a template from the central slice. They concluded that there was no significant difference between these two models.
The key new contribution of the current study is the Finding (III): CHO_2D in the 2D viewing mode correlated well with human observers in the MS viewing mode for the task of detecting low contrast spherical objects. This finding is important for practical implementation of CHO‐based image quality assessment in clinical CT. Despite its many advantages compared to traditional metrics such as MTF, noise, and contrast‐to‐noise ratio, CHO‐based image quality assessment has not been widely adopted as a routine CT image quality assessment tool. One of the main roadblocks is the required large number of repeated scans to train a model, for both CHO_2D and CHO_MS. We performed 100 repeated scans at each dose level in the current study. From statistical perspective, this is still a small number to train a CHO model. However, it is extremely challenging in routine practice to require a measurement to be repeated by 100 times or more. Therefore, even for the simpler 2D mode CHO, tremendous efforts have already been devoted to making the measurement of CHO‐based image quality metrics more efficient by optimizing the number of repeated scans,26 optimizing channel filter selection,30 and utilizing multiple slices of low‐contrast objects in a cylindrical shape to reduce the number of repeated scans.31 Some of these strategies such as utilizing multiple slices in a cylindrical shape do not work for the CHO_MS model. In addition, the amount of data that need to be processed in a MS model could be more than 10 times higher than a 2D model, which is a huge burden for routine quality control testing. If a CHO_2D does not well represent human performance in the more relevant MS viewing mode, additional efforts would be required to incorporate multislice sets of images into the CHO calculation. Consequently practical implementation of CHO‐based image quality metrics would become even more burdensome. Based on the Finding (III) in the current study, at least for the task of detecting spherical low‐contrast objects, one can directly calculate the CHO using 2D phantom images to correlate with the image quality obtainable in a more realistic viewing mode that involves multislice scrolling, which would be much more efficient than the multislice CHO implementation.
It is interesting to note that we did not observe significant improvement with the MS viewing mode compared to the 2D static viewing mode in the studied low‐contrast detection task [Finding (IV)]. Presumably, by scrolling through multiple slices, the low‐contrast objects, if present, would provide more information that could be utilized by the observer. However, it appears that one of the observers benefitted from the MS viewing mode, while the other two observers did not. One of the reasons might be that, for the 2D static viewing mode, the central slice was directly displayed to the observer, which contains the most evident signal‐present slice. Other slices containing less obvious signal may not have provided additional information to help the decision making process for the observer. This observation appears to be only applicable to detection tasks for objects without elongated dimension along the z‐direction. When the object has a large size along the z‐direction such as a long vessel, the multislice viewing should help.
There are some limitations in this study. First, we did not study the impact of scrolling speed, slice thickness and interval. The observers were allowed to scroll back and forth at their own pace, which is consistent with realistic reading of patient images. Slice thickness and interval may also have some impact on the observer performance during the multislice scrolling, which remains a future research topic. Second, 2AFC is the simplest form of localization (observers choose from two possible locations). It is likely that all the findings can be generalized to a localization task when the location of the signal is completely unknown, just like in our previous validation of CHO for both 2AFC and localization tasks in a 2D viewing mode,5, 7 but this remains to be confirmed in a future study. Third, only a simple task with signal known exactly and a uniform background was investigated in the current study. In more realistic and complex tasks with anatomical and varying background and/or varying signal shape, size, contrast, and location, it is expected that the detection performance of human observers will degrade.32 The performance in the MS viewing mode is expected to be much improved over the 2D viewing mode since multislice scrolling becomes helpful for the observers to differentiate signal from anatomical structures and background noise, especially when anatomical structures in a 2D image mimic the signal, such as in the lung where some vessels are hard to be differentiated from nodules without scrolling across multiple slices. Along the same line as demonstrated in the current study, if the performance estimated by a model observer in the 2D mode (with or without anatomical background, with or without localization task) can still be demonstrated to correlate well with the human observers in MS viewing mode with realistic anatomical background, CHO‐based image quality assessment for clinical CT tasks and quality control will be greatly simplified. Finally, only 3 readers participated in the human observer study and the results showed some variation among readers, especially regarding whether the multislice reading is helpful or not. These topics remain to be investigated in the future.
5. Conclusions
CHO‐based model observers with both a 2D model and a multislice model were validated to be highly correlated with human observers in a 2AFC low‐contrast detection task that involves multislice reading. A 2D CHO model is highly correlated with human observer in detecting spherical low contrast objects in multislice viewing of CT images. This finding potentially justifies the use of a simpler, 2D CHO to assess image quality in clinically relevant CT tasks where multislice viewing is used.
Conflicts of interest
Dr. McCollough receives industry grant support from Siemens Healthcare. All other authors have no conflicts to disclose.
Acknowledgments
Research reported in this publication was supported by the National Institute of Biomedical Imaging and Bioengineering of the National Institutes of Health under Award Numbers R01 EB017095 and U01 EB017185. The content is solely the responsibility of the authors and does not necessarily represent the official views of the National Institutes of Health. The authors would like to thank Ms. Kris Nunez for her assistance with manuscript preparation.
References
- 1. Barrett HH, Yao J, Rolland JP, Myers KJ. Model observers for assessment of image quality. Proc Natl Acad Sci U S A. 1993;90:9758–9765. [DOI] [PMC free article] [PubMed] [Google Scholar]
- 2. ICRU Report 54 . Medical Imaging ‐ The Assessment of Image Quality. International Commission on Radiation Units and Measurements (ICRU); 1995.
- 3. Wunderlich A, Noo F. Image covariance and lesion detectability in direct fan‐beam x‐ray computed tomography. Phys Med Biol. 2008;53:2471–2493. [DOI] [PMC free article] [PubMed] [Google Scholar]
- 4. Richard S, Yadava G, Li X, Samei E. Predictive models for observer performance in CT: applications in protocol optimization. Proc SPIE. 2011;7961. [Google Scholar]
- 5. Yu L, Leng S, Chen L, Kofler JM, Carter RE, McCollough CH. Prediction of human observer performance in a 2‐alternative forced choice low‐contrast detection task using channelized Hotelling observer: impact of radiation dose and reconstruction algorithms. Med Phys. 2013;40:041908. [DOI] [PMC free article] [PubMed] [Google Scholar]
- 6. Wilson JM, Christianson OI, Richard S, Samei E. A methodology for image quality evaluation of advanced CT systems. Med Phys. 2013;40:031908. [DOI] [PubMed] [Google Scholar]
- 7. Leng S, Yu LF, Zhang Y, Carter R, Toledano AY, McCollough CH. Correlation between model observer and human observer performance in CT imaging when lesion location is uncertain. Med Phys. 2013;40:081908 [DOI] [PMC free article] [PubMed] [Google Scholar]
- 8. Gang GJ, Stayman JW, Zbijewski W, Siewerdsen JH. Task‐based detectability in CT image reconstruction by filtered backprojection and penalized likelihood estimation. Med Phys. 2014;41:081902. [DOI] [PMC free article] [PubMed] [Google Scholar]
- 9. Zhang Y, Leng S, Yu LF, Carter RE, McCollough CH. Correlation between human and model observer performance for discrimination task in CT. Phys Med Biol. 2014;59:3389–3404. [DOI] [PMC free article] [PubMed] [Google Scholar]
- 10. Li K, Garrett J, Ge Y, Chen GH. Statistical model based iterative reconstruction (MBIR) in clinical CT systems. Part II. Experimental assessment of spatial resolution performance. Med Phys. 2014;41:071911. [DOI] [PMC free article] [PubMed] [Google Scholar]
- 11. Samei E, Richard S. Assessment of the dose reduction potential of a model‐based iterative reconstruction algorithm using a task‐based performance metrology. Med Phys. 2015;42:314–323. [DOI] [PubMed] [Google Scholar]
- 12. Fessler JA, Rogers WL. Spatial resolution properties of penalized‐likelihood image reconstruction: space‐invariant tomographs. IEEE Trans Image Process. 1996;5:1346–1358. [DOI] [PubMed] [Google Scholar]
- 13. Yu L, Vrieze TJ, Leng S, Fletcher JG, McCollough CH. Technical note: measuring contrast‐ and noise‐dependent spatial resolution of an iterative reconstruction method in CT using ensemble averaging. Med Phys. 2015;42:2261–2267. [DOI] [PMC free article] [PubMed] [Google Scholar]
- 14. McCollough CH, Yu L, Kofler JM, et al. Degradation of CT low‐contrast spatial resolution due to the use of iterative reconstruction and reduced dose levels. Radiology. 2015;276:499–506. [DOI] [PMC free article] [PubMed] [Google Scholar]
- 15. Chen M, Bowsher JE, Baydush AH, Gilland KL, DeLong DM, Jaszczak RJ. Using the Hotelling observer on multislice and multiview simulated SPECT myocardial images. IEEE Trans Nucl Sci. 2002;49:661–667. [Google Scholar]
- 16. Platisa L, Goossens B, Vansteenkiste E, et al. Channelized Hotelling observers for the assessment of volumetric imaging data sets. J Opt Soc Am A Opt Image Sci Vis. 2011;28:1145–1163. [DOI] [PubMed] [Google Scholar]
- 17. Ba A, Eckstein MP, Racine D, et al. Low contrast detectability in CT for human and model observers in multi‐slice data sets. Proc SPIE. 2015;9416. [Google Scholar]
- 18. Yu L, Chen B, Kofler JM, Favazza CP, Leng S, McCollough CH. Multi‐slice reading in a low‐contrast detection task in CT: Correlation between human and model observer performance. Radiological Society of North America (RSNA) Annual Meeting; 2015.
- 19. Eckstein MP, Whiting JS. Lesion detection in structured noise. Acad Radiol. 1995;2:249–253. [DOI] [PubMed] [Google Scholar]
- 20. Barrett HH, Abbey CK, Gallas B, Eckstein MP. Stabilized estimates of Hotelling observer detection performance in patient structured noise. Proc SPIE. 1998;3340. [Google Scholar]
- 21. Eckstein MP, Abbey CK, Bochud FO. Visual signal detection in structured backgrounds. IV. Figures of merit for model performance in multiple‐alternative forced‐choice detection tasks with correlated responses. J Opt Soc Am A Opt Image Sci Vis. 2000;17:206–217. [DOI] [PubMed] [Google Scholar]
- 22. Chawla AS, Sarnei E, Saunders R, Abbey C, Delong D. Effect of dose reduction on the detection of mammographic lesions: a mathematical observer model analysis. Med Phys. 2007;34:3385–3398. [DOI] [PubMed] [Google Scholar]
- 23. Park S, Barrett HH, Clarkson E, Kupinski MA, Myers KJ. Channelized‐ideal observer using Laguerre‐Gauss channels in detection tasks involving non‐Gaussian distributed lumpy backgrounds and a Gaussian signal. J Opt Soc Am A Opt Image Sci Vis. 2007;24:B136–B150. [DOI] [PMC free article] [PubMed] [Google Scholar]
- 24. Wilson HR, Bergen JR. A four mechanism model for threshold spatial vision. Vis Res. 1979;19:19–32. [DOI] [PubMed] [Google Scholar]
- 25. Marcelja S. Mathematical description of the responses of simple cortical cells. J Opt Soc Am. 1980;70:1297–1300. [DOI] [PubMed] [Google Scholar]
- 26. Ma C, Yu L, Chen B, Favazza CP, Leng S, McCollough CH. Impact of number of repeated scans on model observer performance for a low‐contrast detection task in computed tomography. J Med Imaging. 2016;3:023504. [DOI] [PMC free article] [PubMed] [Google Scholar]
- 27. Gifford HC, King MA, Pretorius PH, Wells RG. A comparison of human and model observers in multislice LROC studies. IEEE Trans Med Imaging. 2005;24:160–169. [DOI] [PubMed] [Google Scholar]
- 28. Barrett HH, Myers KJ. Foundations of Image Science; 2004.
- 29. Ba A, Eckstein MP, Racine D, et al. Anthropomorphic model observer performance in three‐dimensional detection task for low‐contrast computed tomography. J Med Imaging. 2016;3:011009. [DOI] [PMC free article] [PubMed] [Google Scholar]
- 30. Ma C, Yu L, Favazza CP, Leng S, McCollough CH. Impact of Channel Filter Choices on Channelized Hotelling Observer Performance for a Low‐contrast Detection Task in CT. Radiological Sciety of North America Annual Meeting; 2016.
- 31. Favazza CP, Yu L, Leng S, McCollough CH. Impact of using multi‐slice training sets on the performance of a channelized hotelling observer in a low‐contrast detection task in CT (abstract). Med Phys. 2015;42:3622. [Google Scholar]
- 32. Burgess AE, Judy PE. Signal detection in power‐law noise: effect of spectrum exponents. J Opt Soc Am A Opt Image Sci Vis. 2007;24:B52–B60. [DOI] [PubMed] [Google Scholar]