

Abstract
Introduction
Expectant management (EM) reduces overtreatment in low-risk but not intermediate-risk localized prostate cancer (PCa). We assessed the use and predictors of EM to understand its uptake in U.S. practice.
Methods
Using the U.S. SEER-Medicare database, we conducted a retrospective cohort study of men 66 years and older diagnosed with low-risk (N=25,506) or intermediate-risk (N=25,597) localized PCa between 2004 – 2011 and followed through December 31, 2012. We defined EM as no definitive therapy (DT) and at least one prostate-specific antigen (PSA) test or re-biopsy 4 – 12 months post diagnosis; or receiving DT after PSA testing or re-biopsy 7 – 12 months after diagnosis. We performed separate analyses for low-risk and intermediate-risk groups using multiple logistic regressions.
Results
For men diagnosed with PCa in 2004–2011, EM increased from 22% to 43% in the low-risk group and from 15% to 18% in the intermediate-risk group. In the low-risk group, EM increased with patients’ age (adjusted odds ratio [aOR] = 1.26 for 71–75 years; 2.21 for 76–80 years; 6.33 for older then 80, p<0.0001, compared to 66–70 years). EM uptake was higher among men with comorbidities (aOR=1.29), and residing in the Pacific region (aOR=0.56, compared to the East Coast).
Conclusions
In U.S. practice, the utilization of EM steadily increased in low-risk PCa and remained low in the intermediate-risk group over time. While patients with advanced age or comorbidities were more likely to receive EM, its use varied substantially by geographic region. Our findings bring attention to the presence of multiple barriers for EM implementation.
Keywords: prostatic neoplasms, utilization
Introduction
Prostate cancer (PCa) is the most common non-skin cancer in the U.S., affecting 1 in 7 men.1 It is also the third leading cause of cancer death in U.S. men with 26,120 deaths expected in 2016.1 With the advent of PSA testing, PCa incidence has greatly increased. Over 90% of PCa cases are diagnosed at an early-stage.2 Because of the slow progression of PCa, most deaths among PCa patients within 15 years of initial diagnosis are caused by other competing risks.3 As studies have shown that definitive therapy (DT), including radical prostatectomy (RP) and radiation therapy (RT), are associated with high rates of urinary, bowel, and sexual dysfunction,4,5 it has become debatable whether definitive treatment is beneficial for PCa patients with low risk of recurrence.
To avoid the overtreatment of PCa, expectant management (EM), including active surveillance (AS) and watchful waiting (WW), has emerged as a viable option for initial management for patients with low-risk PCa.6 AS involves monitoring patients for disease progression through scheduled periodic PSA tests and re-biopsies.7 WW is a less rigorous approach than AS, offering palliative care when patients exhibit symptoms of advanced disease.8,9 Prior studies with longer than 10-years of follow up have demonstrated similar survival between EM and DT among low-risk groups.10,11 Findings comparing survival outcomes for EM versus DT among men with intermediate-risk of recurrence have been inconsistent.12–16
Currently, EM is recommended by the U.S. National Comprehensive Cancer Network, the American Urological Association (AUA), and the European Association of Urology, for managing low-risk localized PCa but not for intermediate-risk PCa.6,17,18 One study found an increasing trend of EM in U.S. community practice.19 However, the study finding was limited to PCa patients with complete clinical information and diagnosed up to 2010. We conducted this population-based study with imputation to include a larger and less selective study population with 51,103 men with clinically localized PCa diagnosed from 2004- 2011 with follow-up through December 31, 2012. We also investigated patient and physician characteristics associated with EM to inform the most recent data on the patterns and predictors of EM in U.S. oncology practice.
Materials and Methods
Data Source
We used the linked Surveillance, Epidemiology, and End Results (SEER)-Medicare database for this analysis. Details about SEER-Medicare linkage database have been described elsewhere.20 Briefly, the SEER program is a population-based tumor registry that records all incidences of cancer in 18 selected geographic areas, covering approximately 26% of the United States population. SEER collects patient demographics, tumor histology and pathology, first course of treatment, and survival (through linkage with state death certificates). The Medicare program covers hospital, physician, and outpatient services for the U.S. population aged 65 and older. This study was reviewed by the Institutional Review Board at Georgetown University and declared exempt.
Study Subjects
We included all males 66 years and older who were newly diagnosed with low-risk or intermediate-risk localized PCa from January 1, 2004 through December 31, 2011, and followed through December 31, 2012. We restricted our study sample to men 66 years and older to ensure we had at least a year of patients’ comorbidity history from the Medicare program (eligibility: 65 years). Low- and intermediate- risk of recurrence was based on definitions from the AUA using prostate-specific antigen (PSA) value at diagnosis (< 10 versus 10–20), Gleason sum (less than 7 versus 7), and clinical T-stage (T2a or less versus T2b).21 We excluded men who were 1) missing information for two or three criteria; 2) not enrolled in both Medicare part A and B or in HMO care due to the lack of complete medical visit data; 3) died within a year after their PCa diagnosis due to inadequate follow-up to classify their initial treatment choice as EM or DT; 4) received ADT alone within 12 months after diagnosis. Additionally, we considered re-biopsy or PSA test within 3 months post diagnosis for confirmatory, instead of monitoring purposes. Men who only had PSA or re-biopsy within 3 months after diagnosis and no further records were excluded due to lack of follow-up data. A flow chart for generating the final patient population is presented in Figure 1.
Figure 1.
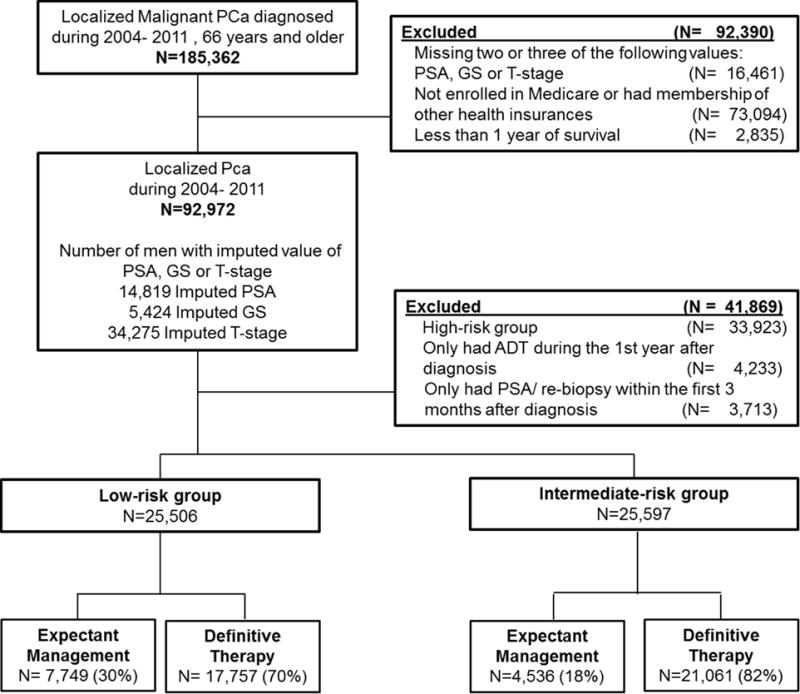
Flow chart of study population selection
Definitions for Expectant Management (EM) and Definitive Therapy (DT)
We grouped our study subjects into EM and DT based on the use of curative-intent treatment and monitoring procedures 12 months post diagnosis. The EM group included men who 1) did not receive prostatectomy or radiation in the first year but had at least one PSA or biopsy during months 4 – 12; and 2) had PSA test or re-biopsy completed during months 7 – 12 and before their radiation or prostatectomy in the first year. We defined DT using records on the first course of treatment after diagnosis from the SEER database and claims from Medicare data. The DT group included men who 1) had prostatectomy or radiation during the first 6 months after diagnosis and 2) had prostatectomy or radiation during months 7-12 before their follow-up PSA test or re-biopsy, if any, during months 7–12. Health Common Procedure Coding System (HCPCS) codes for capturing the use and timing of relevant procedures are summarized in Appendix 1.
Covariates
We used SEER records to obtain age and year of diagnosis, race or ethnicity, registry region, marital status, tumor grade, Gleason sum, clinical T-stage, and PSA level at diagnosis. Using inpatient, outpatient, and provider data from Medicare claims, we obtained patients’ comorbidities including myocardial infarction, diabetes, fracture, and stroke. We calculated the Charlson comorbidity index as a proxy of overall health. The presence of comorbidities were determined by either one inpatient primary diagnosis, two outpatient records at least 30 days apart, or one inpatient record and one outpatient record. We also ascertained where urologists were trained and their years of practice at time of PCa diagnosis from the American Medical Association (AMA) Masterfile.
Statistical Analysis
We first described population characteristics among the total population, the low-risk group, and the intermediate-risk group. We then performed chi-square tests to compare sociodemographics and clinical characteristics between patients using EM and DT. To identify predictors associated with EM use, we performed multiple logistic regression analyses with all covariates as independent factors. Results are expressed as adjusted odds ratios (aOR) with 95% Wald confidence intervals (CIs). Using multiple logistic regression, we also calculated adjusted probability of EM use to show absolute differences in EM use.22 Tests were two sided. All data management and statistical analyses were performed using SAS, Version 9.3 (Cary, NC).
Handling of Missing Data
We performed two multiple imputations using covariates available in the dataset to estimate missing data in our final cohort. We first imputed PSA, Gleason sum, and T-stage data for men missing only one of these variables required to define PCa patients’ risk group (Figure 2). We then performed second imputations to obtain estimates for all other covariates with missing information. We conducted the main analyses in men with imputed data to avoid potential bias due to missing data and conducted sensitivity analyses among men with complete information.
Figure 2.
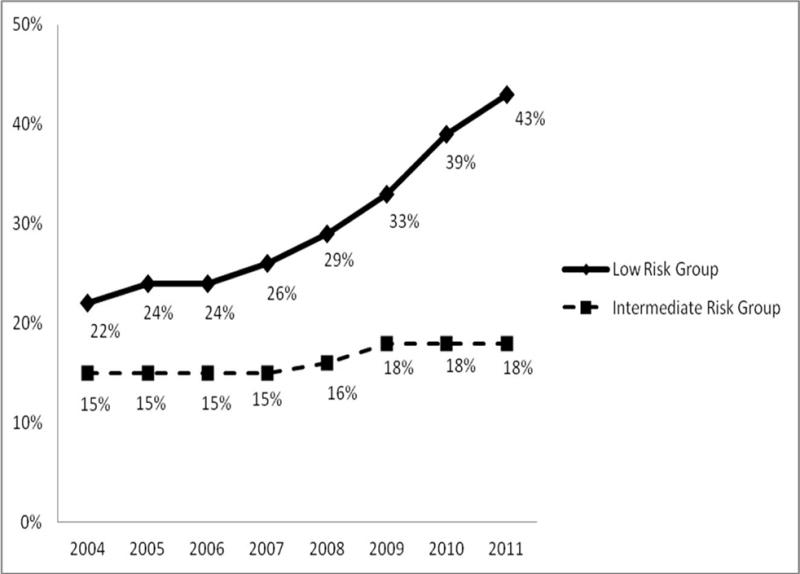
Secular trends with adjusted probability of use of expectant management among men diagnosed with clinically localized prostate cancer with low-and intermediate risk of recurrence
Results
Study Population
We identified 25,506 low-risk and 25,597 intermediate-risk men who were diagnosed with localized PCa between 2004 – 2011 and were followed through December 31, 2012. The median age at diagnosis was 72 and 73 years, respectively. In both groups, the majority of patients were white, married, resided in a metropolitan or urban area at the time of diagnosis, had no major comorbidities, and had PCa as their first cancer (Table 1). The majority of health care providers received medical training in the U.S. (87%). Thirty-six percent of men received care from providers who had more than 30 years of practice since medical school graduation.
Table 1.
Patient and physician characteristics among men diagnosed with low- and intermediate -risk localized prostate cancer patients diagnosed during 2004–2011 and followed through December 31, 2012.
| Low Risk Group N=25,506 (%) |
Intermediate Risk Group N=25,597 (%) |
|
|---|---|---|
| I. Sociodemographic Factors | ||
| Diagnosis Year | ||
| 2004 | 3,363 (13%) | 2,922 (11%) |
| 2005 | 3,267 (13%) | 2,854 (11%) |
| 2006 | 3,590 (14%) | 3,317 (13%) |
| 2007 | 3,524 (14%) | 3,542 (14%) |
| 2008 | 3,232 (13%) | 3,345 (13%) |
| 2009 | 2,876 (11%) | 3,054 (12%) |
| 2010 | 2,865 (11%) | 3,203 (13%) |
| 2011 | 2,789 (11%) | 3,360 (13%) |
| Age at Diagnosis | ||
| 66–70 | 9,884 (39%) | 7,807 (31%) |
| 71–75 | 8,865 (35%) | 8,716 (34%) |
| 76–80 | 4,972 (19%) | 6,250 (24%) |
| 81+ | 1,785 (7%) | 2,824 (11%) |
| Race/Ethnicity | ||
| White | 21,927 (86%) | 21,333 (83%) |
| African-American | 2,191 (9%) | 2,631 (10%) |
| Asian | 458 (2%) | 610 (2%) |
| Other | 930 (4%) | 1,023 (4%) |
| Married | ||
| Yes | 18,220 (71%) | 17,935 (70%) |
| No | 7,286 (29%) | 7,662 (30%) |
| Registry Site | ||
| Pacific | 10,225 (40%) | 10,599 (41%) |
| East | 7,818 (31%) | 7,401 (29%) |
| Central | 5,577 (22%) | 5,518 (22%) |
| Mountain | 1,886 (7%) | 2,079 (8%) |
| Residency | ||
| Metro/Urban | 22,813 (89%) | 23,041 (90%) |
| Less urban/Rural | 2,693 (11%) | 2,556 (10%) |
| II. Clinical Factors | ||
| Charlson Index 2 Years Prior to | ||
| Prostate Cancer Diagnosis | ||
| 0 | 17,379 (68%) | 16,826 (66%) |
| 1 | 5,138 (20%) | 5,210 (22%) |
| 2+ | 2,989 (12%) | 3,561 (14%) |
| Cancer Sequence | ||
| PCa as primary cancer | 22,518 (88%) | 22,606 (88%) |
| Other cancer before PCa | 2,988 (12%) | 2n991 (12%) |
| III. Physician Characteristics | ||
| Medical School Training in U.S. | ||
| Yes | 22,270 (87%) | 22,426 (88%) |
| No | 3,236 (13%) | 3,171 (12%) |
| Years in Practice Since Graduated from Medical School | ||
| 31+ | 9,196 (36%) | 9,204 (36%) |
| 21–30 | 8,745 (34%) | 8,938 (35%) |
| 11–20 | 6,171 (24%) | 6,024 (24%) |
| <=10 | 1,394 (5%) | 1,431 (6%) |
Patterns of treatment between EM and DT in the low-risk group
Approximately 30% of men were classified as receiving EM during the first year post-diagnosis (Table 2). The patients’ median ages were 74 and 71 years for EM and DT, respectively. For patients who underwent EM, 99% had at least one PSA test (median time post-diagnosis: 160 days) and 9% had a re-biopsy (median time post-diagnosis: 206 days). In the DT group, 92% had radiation and 8% had radical prostatectomy (median of 78 and 79 days post-diagnosis for radiation and radical prostatectomy, respectively).
Table 2.
Comparison of patient and physician characteristics between expectant management and definitive therapy group among 25,506 men diagnosed with low-risk prostate cancer during 2004–2011 and followed through December 31, 2012.
| Expectant management | Definitive therapy | p-value | |
|---|---|---|---|
|
| |||
| N=7,749 | N=17,757 | ||
| I. Sociodemographic Factors | |||
| Year of Diagnosis | p<0.001 | ||
| 2004 | 10% | 15% | |
| 2005 | 11% | 14% | |
| 2006 | 12% | 15% | |
| 2007 | 13% | 14% | |
| 2008 | 13% | 13% | |
| 2009 | 12% | 11% | |
| 2010 | 14% | 10% | |
| 2011 | 15% | 9% | |
| Age at Diagnosis | p<0.001 | ||
| 66–70 | 29% | 43% | |
| 71–75 | 31% | 36% | |
| 76–80 | 25% | 17% | |
| 81+ | 15% | 4% | |
| Race/Ethnicity | p<0.001 | ||
| White | 88% | 85% | |
| African-American | 7% | 9% | |
| Asian | 2% | 2% | |
| Other | 3% | 4% | |
| Married | p<0.001 | ||
| Yes | 65% | 74% | |
| No | 35% | 26% | |
| Regions | p<0.001 | ||
| Pacific | 46% | 38% | |
| East | 24% | 33% | |
| Central | 23% | 22% | |
| Mountain | 7% | 7% | |
| Residency | p=0.10 | ||
| Metro/Urban | 90% | 89% | |
| Less urban/Rural | 10% | 11% | |
| II. Clinical Factors | |||
| Charlson Index 2 Year Prior to Diagnosis | p<0.001 | ||
| 0 | 64% | 70% | |
| 1 | 21% | 20% | |
| 2+ | 15% | 10% | |
| Cancer Sequence | p<0.001 | ||
| PCa as primary cancer | 86% | 89% | |
| Other cancer before PCa | 14% | 11% | |
| III. Physician Characteristics | |||
| Medical School Training in U.S. | p=0.43 | ||
| Yes | 88% | 87% | |
| No | 12% | 13% | |
| Years in Practice Since Graduated from Medical School | p=0.57 | ||
| 31+ | 37% 36% | ||
| 21–30 34% | 34% | ||
| 11–20 | 24% | 24% | |
| <=10 | 5% | 5% | |
In unadjusted bivariate analyses of the low-risk group, compared to DT group, EM recipients tended to be diagnosed in recent years, older, unmarried, with more comorbidities, and from the Pacific region. We found similar physician characteristics in both patient groups (Table 2).
Time trends and predictors associated with EM use
We noted an increasing secular trend in favor of EM versus DT use during 2004 – 2011 (adjusted probability increased from 22% to 43% and the adjusted odds ratio [aOR] = 2.83 for EM use in 2011 versus 2004) in the low-risk group (Table 3). Additionally, EM uptake increased substantially with increasing patient age (65% versus 22%, aOR=6.33, 95%C.I. = 5.66- 7.08 for men over 80 years old versus 66–69).
Table 3.
Patient and physician characteristics associated with use of expectant management among 25,506 men diagnosed with low- risk prostate cancer patients during 2004–2011 and followed through December 31, 2012.
| Adjusted Probability | Adjusted OR (95% C.I.) | p-valuea | p-valueb | |
|---|---|---|---|---|
| I. Sociodemographic Factors | ||||
| Diagnosis Year | <0.001 | |||
| 2004 | 22% | 1.00 | ||
| 2005 | 24% | 1.17 (1.04, 1.32) | 0.008 | |
| 2006 | 24% | 1.17 (1.04, 1.31) | 0.009 | |
| 2007 | 26% | 1.27 (1.14, 1.43) | <0.001 | |
| 2008 | 29% | 1.50 (1.33, 1.68) | <0.001 | |
| 2009 | 33% | 1.79 (1.59, 2.01) | <0.001 | |
| 2010 | 39% | 2.36 (2.11. 2.65) | <0.001 | |
| 2011 | 43% | 2.83 (2.52, 3.17) | <0.001 | |
| Age at Diagnosis | <0.001 | |||
| 66–70 | 22% | 1.00 | ||
| 71–75 | 26% | 1.26 (1.18,1.35) | <0.001 | |
| 76–80 | 39% | 2.21 (2.05, 2.39) | <0.001 | |
| 81+ | 65% | 6.33 (5.66, 7.08) | <0.001 | |
| Race/Ethnicity | ||||
| White | 30% | 1.00 | ||
| African-American | 23% | 0.73 (0.65, 0.81) | <0.001 | |
| Asian | 28% | 0.80 (0.64, 0.98) | 0.03 | |
| Other | 24% | 0.68 (0.58, 0.80) | <0.001 | |
| Married | <0.001 | |||
| Yes | 27% | 1.00 | ||
| No | 35% | 1.53 (1.44, 1.62) | <0.001 | |
| Regions | <0.001 | |||
| Pacific | 34% | 1.00 | ||
| East | 22% | 0.56 (0.52, 0.60) | <0.001 | |
| Central | 30% | 0.85 (0.79, 0.92) | <0.001 | |
| Mountain | 30% | 0.85 (0.76, 0.96) | 0.007 | |
| Residency | 0.003 | |||
| Metro/Urban | 29% | 1.00 | ||
| Less urban/Rural | 30% | 0.86 (0.78, 0.95) | 0.003 | |
| II. Clinical Factors | ||||
| All Charlson Index 2 Year Prior | <0.001 | |||
| 0 | 28% | 1.00 | ||
| 1 | 29% | 1.11 (1.03, 1.19) | 0.005 | |
| 2+ | 33% | 1.29 (1.18, 1.41) | <0.001 | |
| Cancer Sequence | 0.001 | |||
| PCa as primary cancer | 28% | 1.00 | ||
| Other cancer before PCa | 32% | 1.22 (1.12, 1.33) | <0.001 | |
| III. Physician | ||||
| Characteristics | ||||
| Medical School Training in U.S. | 0.47 | |||
| Yes | 29% | 1.00 | ||
| No | 28% | 0.97 (0.89, 1.06) | 0.47 | |
| Years in Practice Since Graduated from Medical School | ||||
| 31+ | 28% | 1.00 | 0.25 | |
| 21–30 | 29% | 1.05 (0.98, 1.12) | 0.20 | |
| 11–20 | 30% | 1.05 (0.97, 1.13) | 0.20 | |
| <=10 | 31% | 1.12 (0.99, 1.28) | 0.08 | |
: p-value for pair-wise test that compared each level of a covariate with the reference level
: p-value that corresponded to an overall test (comparing all levels among themselves)
In the adjusted analyses of the low-risk group, we identified other predictors of EM use, including white race and history of prior cancer. Additionally, EM use varied considerably by patients’ geographic region with the Eastern region having a lower uptake of EM compared to the Pacific region (aOR= 0.56, 95% C.I. = 0.52, 0.60). Men with more comorbidities had higher EM uptake (OR=1.30, 95% C.I. = 1.17, 1.45).
In the intermediate-risk group, we found similar determinants of EM use to the low-risk group, except that EM use in the intermediate-risk group remained stable over time (Figure 2). In our sensitivity analyses using men who had complete information for risk grouping, we obtained the same predictors of EM treatment with similar estimates (see Appendices 2 and 3).
Discussion
In this large population-based study, we report that EM uptake for managing low-risk localized PCa in U.S. urologic practice has greatly increased from 22% in 2004 to 43% in 2011. We noted that only 9% of these patients followed AS with a re-biopsy during the first year post diagnosis. The findings alert us to possible barriers for care providers and patients in choosing EM and adhering to AS protocol. We also found a much lower percentage of EM use in the intermediate-risk group and it did not increase in recent years, consistent with evidence based clinical management guidelines that recommend DT for this group. Nevertheless it is notable that 18% of these patients followed EM and did not receive timely DT within the first year post diagnosis.
We found EM use in US urological practice to be highest at 43% in 2011 which was lower than expected suggesting barriers to EM adoption outside of clinical trial settings. According to the NIH consensus development conference in 2011, an estimate of up to 50% of men with low-risk localized PCa should be recommended for AS.23 The observed low use of EM may be due to uncertainty of the appropriateness, timing, and patient selection of EM in practice. Specifically, variation in EM patient management research protocols or patient care pathways has led to conflicting findings regarding its comparative benefit to DT which may reduce the enthusiasm for EM by some urologists. In the absence of randomized controlled trials validating treatment choices for localized prostate cancer, practitioners may have recommended DT until longer term evidence for EM emerged after 2010. Additionally, during the study period, there was inadequate guidance for providers regarding criteria for starting and stopping AS primarily due to uncertainty regarding the validity of varying eligibility criteria and even greater variability in triggers for shifting from EM to DT. Along with the absence of consensus guidelines from major urology professional organizations on the use of EM, such uncertainty may also have made providers hesitant to use EM. Finally, it is unclear how best to select patients for EM. Recent studies have suggested that magnetic resonance imaging (MRI) scans and serum and tumor based markers, such as PSA-isoforms, may improve patient selection for EM.24 Additionally, several genomic testing tools are commercially available to urologists for identifying low-risk localized PCa for AS.25 Although the clinical utility of these selection tools to identify patients for AS is still under research, the development and integration of these tools for individualized AS protocols should increase AS use in the very near future.
Higher uptake of EM among men of advanced age and with more comorbidity may reflect patient and physician preference for a conservative intervention policy among patients for whom the competing risk for death is higher due to shorter life expectancy. Higher EM use among unmarried men is consistent with literature that married men are usually treated more aggressively than unmarried men.26,27 Our finding of higher use of EM among whites vs. blacks needs further investigation. Regional variation in medical practice has been reported and reasons behind this phenomena may include variations in regional practice styles, reimbursement policies of local institutions, and level of patient-physician shared decision-making.28
Although provider preference has been recognized to play an important role in the management of low-risk prostate cancer,29 our data did not show EM adoption to be affected by providers’ medical school training or years of practice. This may be due to the requirements for U.S. medical licensure, including residency training at U.S. institutions for most foreign physicians and continued medical education during practice. Additionally, medical school training and years of practice are not likely to accurately reflect providers’ knowledge and perceptions of EM and the extent to which they discuss the risks and benefits of EM versus conventional DT with patients.
A major strength of this study is the large study population which reflects urologic practice in non-clinical trial settings in the US. Moreover, detailed ascertainment of cancer-related treatment from registry data and claims data allowed us to correctly identify patients with or without DT after PCa diagnosis. This study is limited in the lack of important factors for treatment choices, including Epstein criteria for high-volume Gleason’s score, receipt of a confirmatory biopsy, patients’ and physicians’ preference, and patients’ accessibility to medical care, although we evaluated patients’ residency in urban or rural area as a proxy for their access to care and found no difference in their EM use. The study finding may not be generalizable to patients without continuous enrollment in Medicare and not covered by a Health Maintenance Organization (HMO). Finally, there has been a warning regarding PSA value errors in the SEER-Medicare data, which affected approximately 5% of risk groups.30
Conclusions
This large population-based study demonstrated a steadily increasing adoption of EM in U.S. men with low-risk PCa, but not in men with intermediate risk cancer whose receipt of EM remained stable through 2012. The substantial variation of EM use by regions suggests a need for more evidence to develop clinical consensus about selecting optimal patient populations for EM, especially in regards to those with intermediate risk disease, and men of younger age and without comorbidities. The information will be important as the field moves toward using personalized risk categorization for most optimal treatment.
Acknowledgments
This study was supported by the National Cancer Institute at the National Institutes of Health [grant numbers P30CA051008] and the Agency of Healthcare Research and Quality [grant number:K01HS022915]. The content is solely the responsibility of the authors and does not necessarily represent the official views of the National Cancer Institute or the Agency of Healthcare Research and Quality. The authors also acknowledge Ms. Tania Lobo, M.S. for her dedicated work in data management. The authors also acknowledge the efforts of the Applied Research Program, National Cancer Institute; the Office of Research, Development and Information, Centers for Medicare and Medicaid Services; Information Management Services, Inc.; and the Surveillance, Epidemiology, and End Results Program tumor registries in the creation of the Surveillance, Epidemiology, and End Results -Medicare database.
Abbreviations Key
- aOR
adjusted odds ratio
- AS
active surveillance
- C.I.
confidence interval
- DT
definitive therapy
- EM
expectant management
- PCa
prostate cancer
- PSA
prostate-specific antigen
- SEER
Surveillance
- Epidemiology
and End Results
- U.S.
United States
Appendix 1.
Healthcare Common Procedure Coding System and International Classification of Disease, Ninth Revision codes used for abstracting biopsy, prostate-specific-antigen (PSA) test, androgen deprivation therapy, radiation and prostatectomy information from Medicare claims.
| Procedures | Code types | Code |
|---|---|---|
| Biopsy | HCPCS | 55700 |
| PSA test | HCPCS | G0103, 84153 |
| Androgen deprivation therapy | HCPCS | J9202,J1950,J9217,J9219,J9218,J9225,J3315 |
| Radiation | ICD-9 Diagnosis | V580,V671,V661 |
| ICD-9 Procedure | 9221,9222,9223,9224,9225,9226,9227, 9228,9229 | |
| HCPCS | (77499, 77750- 77799) or (hcpcs1 >=77261 and hcpcs1<=77431) | |
| Revenue center | 0330,0333 | |
| Prostatectomy | HCPCS | 55810,55811,55812,55813,55814,55815,55840,55841, 55842,55843,55844,55845 |
| ICD-9 procedure | 605 |
Appendix 2.
Patient and physician characteristics among men diagnosed with low and intermediate-risk localized prostate cancer patients during 2004–2011 with complete PSA value, Gleason sum, and stage at diagnosis information.
| Low-risk Group N=17,859 (%) |
Intermediate-risk Group N=18,258 (%) |
|
|---|---|---|
| I. Sociodemographic Factors | ||
| Diagnosis Year | ||
| 2004 | 2,249 (13%) | 1,955 (11%) |
| 2005 | 2,277 (13%) | 1,994 (11%) |
| 2006 | 2,565 (14%) | 2,370 (13%) |
| 2007 | 2,520 (14%) | 2,612 (14%) |
| 2008 | 2,302 (13%) | 2,416 (13%) |
| 2009 | 1,722 (10%) | 1,831 (10%) |
| 2010 | 2,160 (12%) | 2,479 (14%) |
| 2011 | 2,064 (12%) | 2,601 (14%) |
| Age at Diagnosis | ||
| 66–70 | 7,223 (40%) | 5,757 (32%) |
| 71–75 | 6,345 (36%) | 6,401 (35%) |
| 76–80 | 3,320 (19%) | 4,395 (24%) |
| 81+ | 971 (5%) | 1,705 (9%) |
| Race/Ethnicity | ||
| White | 15,290 (86%) | 15,106 (83%) |
| African-American | 1,608 (9%) | 2,022 (11%) |
| Asian | 325 (2%) | 429 (2%) |
| Other | 636 (4%) | 701 (4%) |
| Married | ||
| Yes | 13,185 (74%) | 13,046 (71%) |
| No | 4,674 (26%) | 5,212 (29%) |
| Registry Site | ||
| Pacific | 6,015 (34%) | 6,211 (34%) |
| East | 5,539 (31%) | 5,411 (30%) |
| Central | 3,495 (20%) | 3,646 (20%) |
| Mountain | 958 (5%) | 1,133 (6%) |
| Unknown/Missing | 1,852 (10%) | 1,857 (10%) |
| Residency | ||
| Metro/Urban | 15,976 (89%) | 16,479 (90%) |
| Less urban/Rural | 1,883 (11%) | 1,779 (10%) |
| II. Clinical Factors | ||
| All Charlson Index 2 Year Prior | ||
| 0 | 12,282 (69%) | 12,064 (66%) |
| 1 | 3,564 (20%) | 3,708 (20%) |
| 2+ | 2,013 (11%) | 2,486 (14%) |
| Cancer Sequence | ||
| PCa as primary cancer | 15,895 (89%) | 16,200 (89%) |
| Other cancer before PCa | 1,964 (11%) | 2,058 (11%) |
| III. Physician Characteristics | ||
| Medical School Training in U.S. | ||
| Yes | 11,596 (65%) | 11,502 (63%) |
| No | 1,656 (9%) | 1,585 (9%) |
| Unknown/Missing | 4,607 (26%) | 5,171 (28%) |
| Years in Practice Since Graduated from Medical School | ||
| 31+ | 4,774 (27%) | 4,579 (25%) |
| 21–30 | 4,417 (25%) | 4,521 (25%) |
| 11–20 | 3,329 (19%) | 3,196 (18%) |
| <=10 | 732 (4%) | 791 (4%) |
| Unknown/Missing | 4,607 (26%) | 5,171 (28%) |
Appendix 3.
Patient and physician characteristics associated with use of expectant management among men diagnosed with low- and intermediate-risk localized prostate cancer patients during 2004–2011and with complete PSA value, Gleason Sum and stage at diagnosis information.
| Low-risk Group | Intermediate-risk Group | ||||||
|---|---|---|---|---|---|---|---|
| Adjusted OR (95% C.I.) | p-valuea | p-valueb | Adjusted OR (95% C.I.) | p-valuea | p-valueb | ||
| I. Sociodemographic Factors | |||||||
| Diagnosis Year | <0.001 | <0.001 | |||||
| 2004 | 1.00 | 0.042 | 1.00 | ||||
| 2005 | 1.19 (1.01, 1.41) | 1.00 (0.81, 1.23) | 0.965 | ||||
| 2006 | 1.31 (1.11, 1.54) | 0.001 | 1.11 (0.91, 1.36) | 0.292 | |||
| 2007 | 1.35 (1.15, 1.59) | <0.001 | 1.02 (0.84, 1.25) | 0.836 | |||
| 2008 | 1.61 (1.35, 1.91) | <0.001 | 1.21 (0.99, 1.49) | 0.067 | |||
| 2009 | 2.01 (1.66, 2.44) | <.0001 | 0.90 (0.70, 1.16) | 0.408 | |||
| 2010 | 2.83 (2.30, 3.49) | <0.001 | 1.53 (1.20, 1.93) | 0.001 | |||
| 2011 | 3.10 (2.44, 3.94) | <0.001 | 1.44 (1.09, 1.90) | 0.010 | |||
| Age at Diagnosis | <0.001 | <0.001 | |||||
| 66–70 | 1.00 | <0.001 | 1.00 | ||||
| 71–75 | 1.33 (1.20,1.49) | 1.15 (0.98, 1.34) | 0.081 | ||||
| 76–80 | 2.20 (1.95, 2.49) | <0.001 | 1.83 (1.57, 2.13) | <0.001 | |||
| 81+ | 6.04 (5.08, 7.20) | <0.001 | 4.24 (3.57, 5.03) | <0.001 | |||
| Race/Ethnicity | 0.001 | 0.003 | |||||
| White | 1.00 | 0.019 | 1.00 | ||||
| African-American | 0.80 (0.67, 0.96) | 0.88 (0.72, 1.08) | 0.214 | ||||
| Asian | 0.68 (0.49, 0.94) | 0.018 | 0.61 (0.43, 0.86) | 0.005 | |||
| Other | 0.73 (0.57, 0.93) | 0.012 | 0.69 (0.52, 0.93) | 0.013 | |||
| Married | <0.001 | <0.001 | |||||
| Yes | 1.00 | 1.00 | |||||
| No | 1.72 (1.56, 1.90) | <0.001 | 1.68 (1.50, 1.89) | <0.001 | |||
| Registry Site | <0.001 | <0.001 | |||||
| Pacific | 1.00 | 1.00 | |||||
| East | 0.49 (0.44, 0.54) | <0.001 | 0.52 (0.45, 0.59) | <0.001 | |||
| Central | 0.71 (0.63, 0.81) | <0.001 | 0.61 (0.52, 0.71) | <0.001 | |||
| Mountain | 0.70 (0.57, 0.87) | 0.001 | 0.67 (0.53, 0.86) | 0.002 | |||
| Residency | 0.443 | 0.007 | |||||
| Metro/Urban | 1.00 | 1.00 | |||||
| Less urban/Rural | 0.93 (0.78, 1.11) | 0.443 | 1.34 (1.08, 1.66) | 0.007 | |||
| II. Clinical Factors | |||||||
| All Charlson Index 2 Year Prior | 0.002 | 0.005 | |||||
| 0 | 1.00 | 1.00 | |||||
| 1 | 1.11 (0.99, 1.24) | 0.082 | 1.21 (1.06, 1.39) | 0.006 | |||
| 2+ | 1.28 (1.11, 1.48) | 0.001 | 1.21 (1.03, 1.42) | 0.024 | |||
| Cancer Sequence | <0.001 | 0.335 | |||||
| PCa as primary cancer | 1.00 | 1.00 | |||||
| Other cancer before PCa | 1.29 (1.13, 1.48) | <0.001 | 1.09 (0.92, 1.28) | 0.335 | |||
| III. Physician Characteristics | |||||||
| Medical School Training in U.S. | 0.137 | 0.434 | |||||
| Yes | 1.00 | 1.00 | |||||
| No | 1.11 (0.97, 1.27) | 0.137 | 1.07 (0.91, 1.26) | 0.434 | |||
| Years in Practice Since Graduated from Medical School | 0.202 | 0.497 | |||||
| 31+ | 1.00 | 1.00 | |||||
| 21–30 | 1.03 (0.91, 1.16) | 0.647 | 1.09 (0.96, 1.25) | 0.187 | |||
| 11–20 | 1.19 (0.97, 1.46) | 0.095 | 1.10 (0.95, 1.28) | 0.193 | |||
| <=10 | 0.96 (0.86, 1.07) | 0.464 | 1.04 (0.81, 1.34) | 0.759 | |||
: p-value for pair-wise test that compared each level of a covariate with the reference level
: p-value that corresponded to an overall test (comparing all levels among themselves)
Footnotes
Publisher's Disclaimer: This is a PDF file of an unedited manuscript that has been accepted for publication. As a service to our customers we are providing this early version of the manuscript. The manuscript will undergo copyediting, typesetting, and review of the resulting proof before it is published in its final citable form. Please note that during the production process errors may be discovered which could affect the content, and all legal disclaimers that apply to the journal pertain.
Conflict of interest: none.
Reference List
- 1.American Cancer Society. Cancer Facts & Figures 2016. Updated 2016. Accessed 2016 Feb 18. http://www.cancer.org/acs/groups/content/@research/documents/document/acspc047079.pdf.
- 2.National Cancer Institute. SEER Cancer Statistics Review, 1975–2006. Updated 2009. Accessed 2013 Dec 5. http://seer.cancer.gov/csr/1975_2006.
- 3.Popiolek M, Rider JR, Andren O, et al. Natural history of early, localized prostate cancer: a final report from three decades of follow-up. Eur Urol. 2013 Mar;63(3):428–35. doi: 10.1016/j.eururo.2012.10.002. [DOI] [PubMed] [Google Scholar]
- 4.Punnen S, Cowan JE, Chan JM, et al. Long-term Health-related Quality of Life After Primary Treatment for Localized Prostate Cancer: Results from the CaPSURE Registry. Eur Urol. 2015 Oct;68(4):600–8. doi: 10.1016/j.eururo.2014.08.074. [DOI] [PubMed] [Google Scholar]
- 5.Jarosek SL, Virnig BA, Chu H, et al. Propensity-weighted long-term risk of urinary adverse events after prostate cancer surgery, radiation, or both. Eur Urol. 2015 Feb;67(2):273–80. doi: 10.1016/j.eururo.2014.08.061. [DOI] [PubMed] [Google Scholar]
- 6.National Comprehensive Cancer Network. NCCN Clinical Practice Guidelines in Oncology (NCCN Guidelines®) Prostate Cancer. Version 2.2016. Updated 2016 Feb 8. Accessed 2016 Feb 19. http://www.nccn.org/professionals/physician_gls/pdf/prostate.pdf.
- 7.Dall’Era MA, Konety BR. Active surveillance for low-risk prostate cancer: selection of patients and predictors of progression. Nat Clin Pract Urol. 2008 May;5(5):277–83. doi: 10.1038/ncpuro1058. [DOI] [PubMed] [Google Scholar]
- 8.Parker C. Active surveillance of early prostate cancer: rationale, initial results and future developments. Prostate Cancer Prostatic Dis. 2004;7(3):184–7. doi: 10.1038/sj.pcan.4500720. [DOI] [PubMed] [Google Scholar]
- 9.Hayes JH, Ollendorf DA, Pearson SD, et al. Observation versus initial treatment for men with localized, low-risk prostate cancer: a cost-effectiveness analysis. Ann Intern Med. 2013 Jun 18;158(12):853–60. doi: 10.7326/0003-4819-158-12-201306180-00002. [DOI] [PMC free article] [PubMed] [Google Scholar]
- 10.Tosoian JJ, Mamawala M, Epstein JI, et al. Intermediate and Longer-Term Outcomes From a Prospective Active-Surveillance Program for Favorable-Risk Prostate Cancer. J Clin Oncol. 2015 Oct 20;33(30):3379–85. doi: 10.1200/JCO.2015.62.5764. [DOI] [PMC free article] [PubMed] [Google Scholar]
- 11.Lu-Yao GL, Albertsen PC, Moore DF, et al. Fifteen-year Outcomes Following Conservative Management Among Men Aged 65 Years or Older with Localized Prostate Cancer. Eur Urol. 2015 Nov;68(5):805–11. doi: 10.1016/j.eururo.2015.03.021. [DOI] [PMC free article] [PubMed] [Google Scholar]
- 12.Bul M, van den Bergh RC, Zhu X, et al. Outcomes of initially expectantly managed patients with low or intermediate risk screen-detected localized prostate cancer. BJU Int. 2012 Dec;110(11):1672–7. doi: 10.1111/j.1464-410X.2012.11434.x. [DOI] [PubMed] [Google Scholar]
- 13.Cooperberg MR, Cowan JE, Hilton JF, et al. Outcomes of active surveillance for men with intermediate-risk prostate cancer. J Clin Oncol. 2011 Jan 10;29(2):228–34. doi: 10.1200/JCO.2010.31.4252. [DOI] [PMC free article] [PubMed] [Google Scholar]
- 14.Bill-Axelson A, Holmberg L, Garmo H, et al. Radical prostatectomy or watchful waiting in early prostate cancer. N Engl J Med. 2014 Mar 6;370(10):932–42. doi: 10.1056/NEJMoa1311593. [DOI] [PMC free article] [PubMed] [Google Scholar]
- 15.Abern MR, Aronson WJ, Terris MK, et al. Delayed radical prostatectomy for intermediate-risk prostate cancer is associated with biochemical recurrence: possible implications for active surveillance from the SEARCH database. Prostate. 2013 Mar;73(4):409–17. doi: 10.1002/pros.22582. [DOI] [PubMed] [Google Scholar]
- 16.Abdollah F, Sun M, Schmitges J, et al. Competing-risks mortality after radiotherapy vs. observation for localized prostate cancer: a population-based study. Int J Radiat Oncol Biol Phys. 2012 Sep 1;84(1):95–103. doi: 10.1016/j.ijrobp.2011.11.034. [DOI] [PubMed] [Google Scholar]
- 17.Mottet N, Bellmunt J, Briers E, et al. Guidelines on Prostate Cancer. Updated 2015 Mar. Accessed 2016 Feb 19. http://uroweb.org/wp-content/uploads/EAU-Guidelines-Prostate-Cancer-2015-v2.pdf.
- 18.American Urological Association Education and Research I. Guideline for the Management of Clinically Localized Prostate Cancer: 2007 Update. Updated 2012. Accessed 2014 Apr 22. http://www.auanet.org/common/pdf/education/clinical-guidance/Prostate-Cancer.pdf.
- 19.Weiner AB, Patel SG, Etzioni R, et al. National trends in the management of low and intermediate risk prostate cancer in the United States. J Urol. 2015 Jan;193(1):95–102. doi: 10.1016/j.juro.2014.07.111. [DOI] [PubMed] [Google Scholar]
- 20.Warren JL, Klabunde CN, Schrag D, et al. Overview of the SEER-Medicare data: content, research applications, and generalizability to the United States elderly population. Med Care. 2002 Aug;40(8 Suppl):IV-18. doi: 10.1097/01.MLR.0000020942.47004.03. [DOI] [PubMed] [Google Scholar]
- 21.Thompson I, Thrasher JB, Aus G, et al. Guideline for the management of clinically localized prostate cancer: 2007 update. J Urol. 2007 Jun;177(6):2106–31. doi: 10.1016/j.juro.2007.03.003. [DOI] [PubMed] [Google Scholar]
- 22.Muller CJ, Maclehose RF. Estimating predicted probabilities from logistic regression: different methods correspond to different target populations. Int J Epidemiol. 2014 Jun;43(3):962–70. doi: 10.1093/ije/dyu029. [DOI] [PMC free article] [PubMed] [Google Scholar]
- 23.Ganz PA, Barry JM, Burke W, et al. NIH State-of-the-Science Conference Statement on Role of Active Surveillance in the Management of Men With Localized Prostate Cancer. NIH Consens State Sci Statements. 2011 Dec;28(1):1–27. [PubMed] [Google Scholar]
- 24.van den Bergh RC, Ahmed HU, Bangma CH, et al. Novel tools to improve patient selection and monitoring on active surveillance for low-risk prostate cancer: a systematic review. Eur Urol. 2014 Jun;65(6):1023–31. doi: 10.1016/j.eururo.2014.01.027. [DOI] [PubMed] [Google Scholar]
- 25.Nguyen HG, Welty CJ, Cooperberg MR. Diagnostic associations of gene expression signatures in prostate cancer tissue. Curr Opin Urol. 2015 Jan;25(1):65–70. doi: 10.1097/MOU.0000000000000131. [DOI] [PubMed] [Google Scholar]
- 26.Mahal BA, Cooperberg MR, Aizer AA, et al. Who bears the greatest burden of aggressive treatment of indolent prostate cancer? Am J Med. 2015 Jun;128(6):609–16. doi: 10.1016/j.amjmed.2014.12.030. [DOI] [PubMed] [Google Scholar]
- 27.Schymura MJ, Kahn AR, German RR, et al. Factors associated with initial treatment and survival for clinically localized prostate cancer: results from the CDC-NPCR Patterns of Care Study (PoC1) BMC Cancer. 2010;10:152. doi: 10.1186/1471-2407-10-152. [DOI] [PMC free article] [PubMed] [Google Scholar]
- 28.Birkmeyer JD, Reames BN, McCulloch P, et al. Understanding of regional variation in the use of surgery. Lancet. 2013 Sep 28;382(9898):1121–9. doi: 10.1016/S0140-6736(13)61215-5. [DOI] [PMC free article] [PubMed] [Google Scholar]
- 29.Hoffman KE, Niu J, Shen Y, et al. Physician variation in management of low-risk prostate cancer: a population-based cohort study. JAMA Intern Med. 2014 Sep;174(9):1450–9. doi: 10.1001/jamainternmed.2014.3021. [DOI] [PMC free article] [PubMed] [Google Scholar]
- 30.National Cancer Institute. PSA Values and SEER Data. Updated 2015 Apr 29. Accessed 2016 Feb 22. http://seer.cancer.gov/data/psa-values.html.