Abstract
Despite the success of monotherapies based on blockade of programmed cell death 1 (PD-1) in human melanoma, most patients do not experience durable clinical benefit. Pre-existing T-cell infiltration and/or the presence of PD-L1 in tumours may be used as indicators of clinical response; however, blood-based profiling to understand the mechanisms of PD-1 blockade has not been widely explored. Here we use immune profiling of peripheral blood from patients with stage IV melanoma before and after treatment with the PD-1-targeting antibody pembrolizumab and identify pharmacodynamic changes in circulating exhausted-phenotype CD8 T cells (Tex cells). Most of the patients demonstrated an immunological response to pembrolizumab. Clinical failure in many patients was not solely due to an inability to induce immune reinvigoration, but rather resulted from an imbalance between T-cell reinvigoration and tumour burden. The magnitude of reinvigoration of circulating Tex cells determined in relation to pretreatment tumour burden correlated with clinical response. By focused profiling of a mechanistically relevant circulating T-cell subpopulation calibrated to pretreatment disease burden, we identify a clinically accessible potential on-treatment predictor of response to PD-1 blockade.
CD8 T cells can mount responses against many human cancer types, especially those with higher mutational burden1. Indeed, pre-existing T-cell infiltration can be a positive prognostic indicator in a variety of cancers2. Moreover, PD-L1 expression in tumours is, in some cases, associated with T-cell responses3,4. However, these CD8 T-cell responses often fail to eradicate tumours, and cells can become dysfunctional or exhausted5. Tex cells have weak (though not absent) effector function and undergo an altered pattern of differentiation compared to effector (Teff) and memory (Tmem) CD8 T cells. Tex cells are also actively restrained by inhibitory receptors, including PD-1 (ref. 5). Blocking the PD-1 pathway can partially reinvigorate Tex cells in pre-clinical models6 and has led to positive clinical responses in a number of human cancers, including melanoma7. However, despite the success of PD-1-based monotherapies in human melanoma, the majority of patients do not have durable clinical benefit7. A major remaining challenge is identifying which patients will respond to anti-PD-1 therapy and defining the reasons for success versus failure of the treatment. Some pretreatment predictors of response to PD-1 blockade have been reported, such as the presence of T cells in the tumour and/or PD-L1 expression in biopsies3,4, but these predictors remain suboptimal. In addition, it has been unclear whether peripheral blood profiling can be used to detect responses to checkpoint blockade, identify the relevant responding cell types and allow insights into the underlying immunological mechanisms of on-going clinical response.
Healthy donor versus melanoma patients
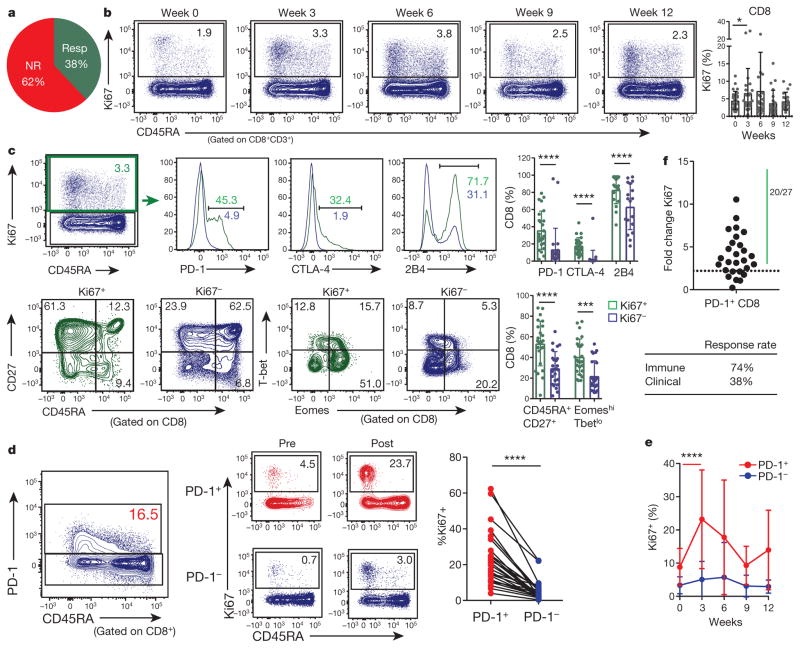
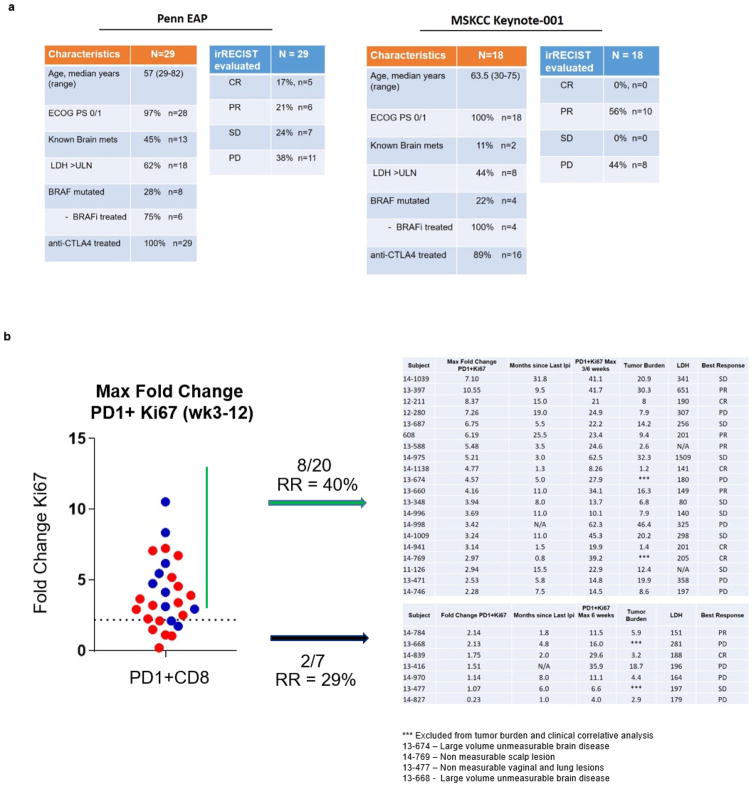
We enrolled 29 patients with stage IV melanoma treated with the anti-PD-1 antibody pembrolizumab (pembro). All patients had previously received anti-CTLA-4 therapy (Extended Data Fig. 1). Patients were treated with pembro, and blood was obtained before therapy and every 3 weeks during therapy for a total of 12 weeks. 62% of patients did not have an objective clinical response, determined on the basis of immune RECIST (response evaluation criteria in solid tumours) criteria, consistent with published trials8,9 (Fig. 1a, Extended Data Fig. 1).
Figure 1. CD8 T cells responding to anti-PD-1 therapy display an exhausted phenotype.
a, Clinical responder (resp, complete response + partial response). NR, non-responder (stable disease + progressive disease). b, Ki67 expression in CD8 T cells at indicated times (n = 29). c, Expression of the indicated markers in Ki67+ (green) and Ki67− (blue) CD8 T cells at 3 weeks (n =27). d, Ki67 expression in PD-1+ (red) and PD-1− (blue) CD8 T cells at 3 weeks (n =27). e, Ki67 expression in PD-1+ (red) and PD-1− (blue) CD8 T cells at indicated times (n =29). f, Fold change of Ki67 expression at peak of immunologic response versus pretreatment. Dotted line denotes fold change of 2.21, which is the mean plus 3 s.d. in healthy donors (see Extended Data Fig. 3d). *P <0.05, ***P <0.001, ****P < 0.0001, Wilcoxon matched-pairs test. Error bars, s.d. Flow cytometry data in all panels are representative of 1–4 independent technical replicates of the stain indicated.
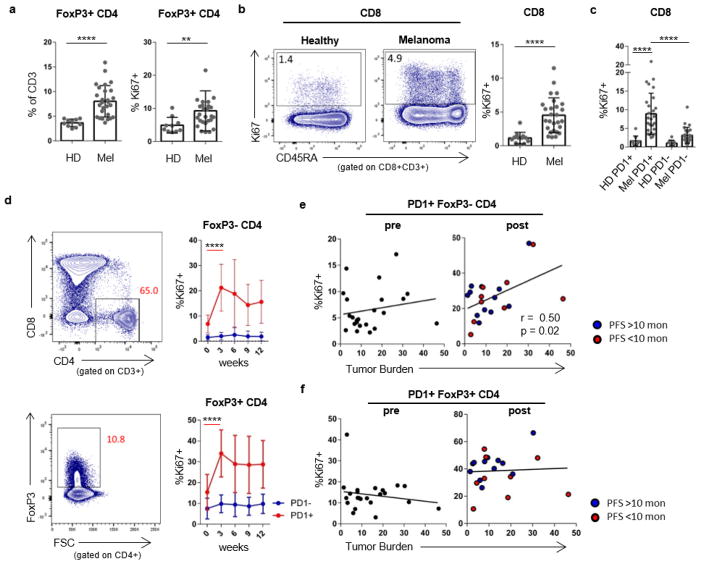
Peripheral blood T cells from patients with melanoma were first compared to those from age-matched healthy donors using high-dimensional flow cytometry. The frequencies of CD4 and CD8 T cells, memory T-cell subsets, and CD4 and CD8 T-cell co-expression of inhibitory receptors (PD-1, CTLA-4, 2B4, and TIM-3) were similar (data not shown). However, patients with melanoma had a higher frequency of CD4+FOXP3+ T cells and Ki67 expression by FOXP3+ cells (Extended Data Fig. 2a). Ki67 expression was also increased in CD8 T cells from patients with melanoma (P < 0.0001, Extended Data Fig. 2b), predominantly in the PD-1+ CD8 T-cell subset (P < 0.0001, Extended Data Fig. 2c), suggesting a pre-existing immune response.
Pharmacodynamic immune response to anti-PD-1
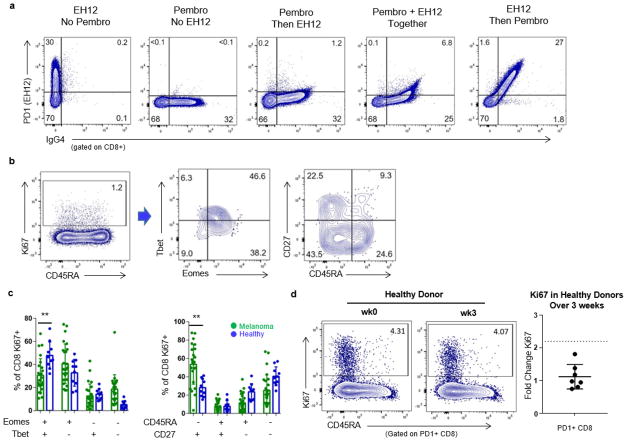
Ki67 is a marker of cellular proliferation and T-cell reinvigoration in mouse models upon checkpoint blockade10, as well as in humans receiving anti-CTLA-4 treatment plus radiation11. Thus, we examined changes in Ki67 expression in more detail. Indeed, the frequency of Ki67+ CD8 T cells was increased at 3 weeks after pembro treatment and then declined in most patients (Fig. 1b). The responding Ki67+ CD8 T-cell population was largely CD45RAloCD27hi and contained cells with high expression of CTLA-4, 2B4, and PD-1 (Fig. 1c) (using an anti-IgG4 detection approach12, see Methods and Extended Data Fig. 3a). Moreover, the responding Ki67+ cells were Eomeshi and T-betlo (P <0.0001, Fig. 1c), consistent with the phenotype of Tex cells10,13. In contrast, the Ki67+ population in healthy donors was largely EomeshiT-bethi and CD27lo, consistent with an effector phenotype (Extended Data Fig. 3b, c). In addition to CD8 T cells, Ki67 increased in FOXP3− CD4 T cells and FOXP3+ CD4 T cells following pembro treatment, mainly in the PD-1+ subset of each population (Extended Data Fig. 2d). Neither FOXP3− nor FOXP3+ CD4 T-cell responses correlated with clinical outcome (Extended Data Fig. 2e, f).
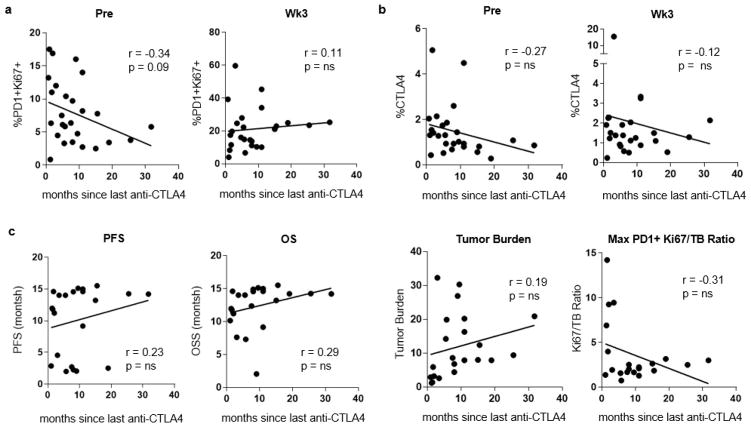
The increase in Ki67 expression was most prominent in the PD-1+ versus PD-1− CD8 T cells (P < 0.0001; Fig. 1d). Moreover, this Ki67 response in the PD-1+ subset peaked at 3 weeks after treatment compared to the PD-1− subset (P < 0.0001, Fig. 1e). The time since last dose of anti-CTLA-4 therapy did not correlate with subsequent post-pembro Ki67 levels or treatment response (Extended Data Fig. 4a–c), suggesting that the immunologic response observed in this instance was mainly due to anti-PD-1 therapy. In healthy donors, Ki67 expression by PD-1+ CD8 T cells varied little over 3 weeks, changing 1.1-fold ±0.37 (Extended Data Fig. 3d). In contrast, the majority of patients with melanoma (20 out of 27) had a biologically meaningful increase in Ki67 in their PD-1+ CD8 T cells after treatment (Fig. 1f, Extended Data Fig. 1). Despite this 74% immunologic response rate, only 38% achieved a clinical response, indicating that not all patients with an immunologic response to pembro have clinical benefit.
Reinvigorated Tex cells detected in peripheral blood
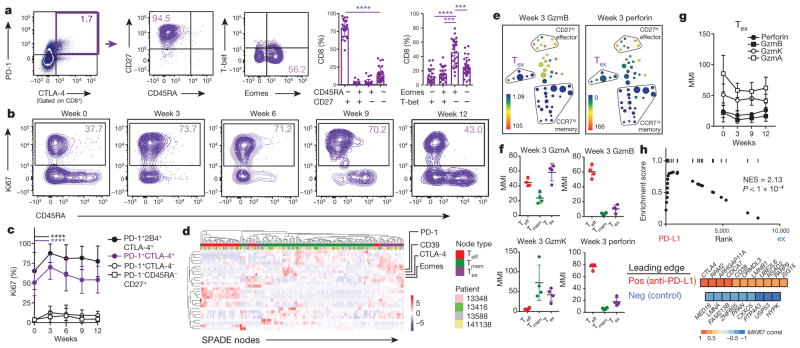
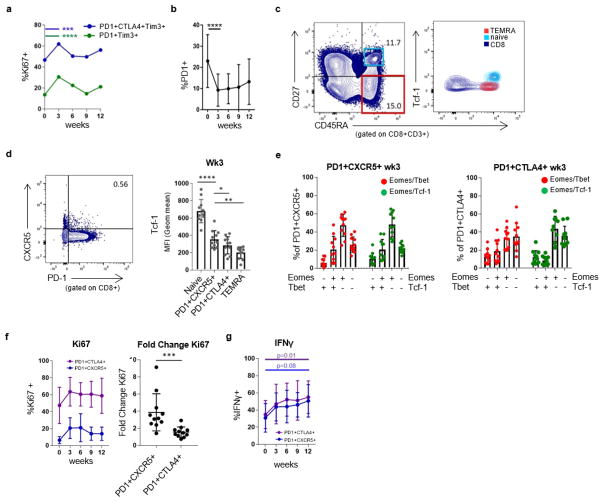
We next assessed whether CD8 T cells that co-expressed PD-1 and other inhibitory receptors provided greater precision in tracking the pharmacodynamic effects of PD-1 blockade. Circulating populations of PD-1+CTLA-4+ CD8 T cells were largely EomeshiT-betlo and CD45RAloCD27hi (Fig. 2a). Furthermore, around 50% of PD-1+CTLA-4+ cells expressed Ki67 before treatment, consistent with data on Tex cells in mice13, and this increased to around 75% after treatment (Fig. 2b, c). There was substantially lower Ki67 expression in the PD-1+CTLA-4− T cells (Fig. 2c). Addition of a third inhibitory receptor (for example, 2B4) or focusing on the recently described PD-1+CXCR5+TCF-1+ subset14,15 further enriched for cells responding to anti-PD-1 therapy (Fig. 2c, Extended Data Fig. 5). Moreover, IFNγ-producing PD-1+CTLA-4+ and PD-1+CXCR5+ subsets increased after anti-PD-1 therapy, consistent with reinvigoration of Tex cells (Extended Data Fig. 5g).
Figure 2. Exhausted-phenotype CD8 T cells are preferentially reinvigorated by anti-PD-1 therapy.
a, Marker expression in PD-1+CTLA-4+ CD8 T cells at 3 weeks (paired t-test; n = 27). b, Representative plots. c, Ki67 expression in CD8 T cells expressing inhibitory receptors. Bars indicate differences (paired t-test and Wilcoxon matched-pairs test; n =27). d, Heat map shows effector, memory, and exhausted nodes from SPADE, hierarchically clustered. e, SPADE for median mass intensities (MMI) of granzyme B (left) and perforin (right) at week 3 (n =4). f, MMI of cytolytic markers in Teff, Tmem, and Tex cells at 3 weeks (gated on PD-1+CD8+). g, MMI of cytolytic markers in Tex cells over time. GzmA, GzmB and GzmK indicate granzymes A, B and K, respectively. h, RNA-seq of total CD8 T cells (n = 3; see Methods). Gene set enrichment analysis of top 50 positive correlates of Ki67, and leading edge of positive (top) or negative (bottom) correlates of Ki67 that were enriched in anti-PD-L1-treated versus control Tex-cell signatures from ref. 19 (bottom). NES, normalized enrichment score. ***P <0.001, ****P < 0.0001. Error bars, s.d. Flow cytometry data (a–c) are representative of 1–4 independent technical replicates of the stain indicated. Mass cytometry data and RNA-seq data (d–h) are representative of one technical replicate.
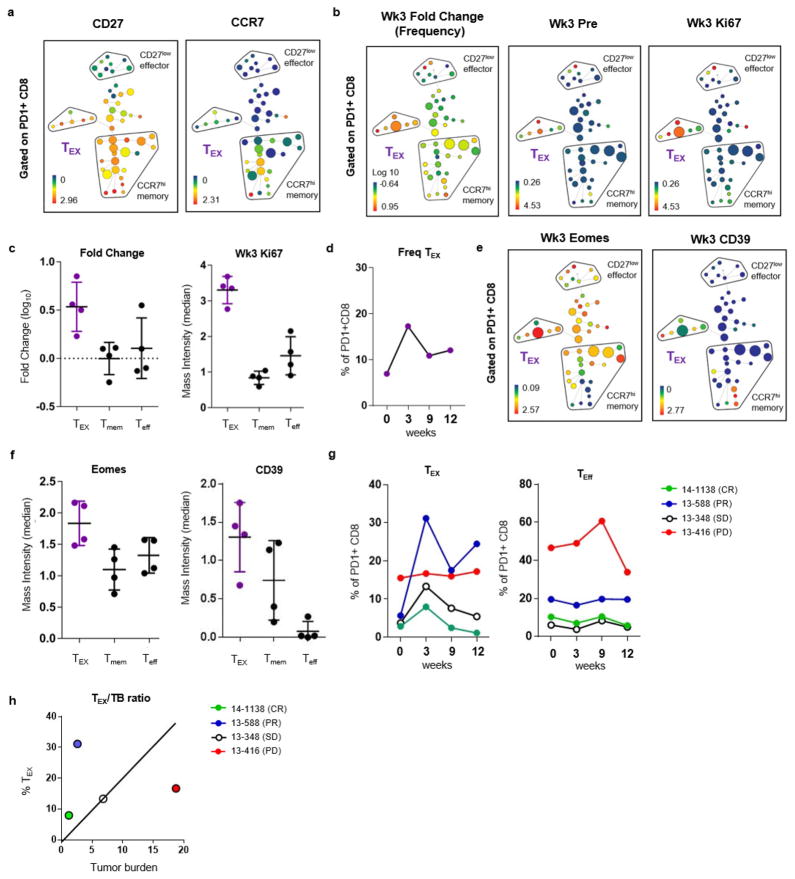
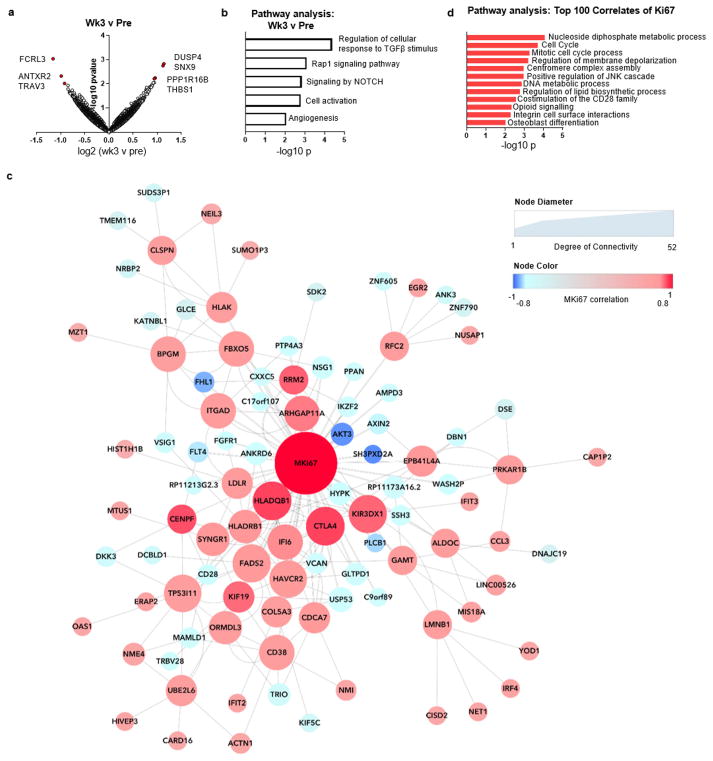
To characterize further the pembro-reactive T cells, we used mass cytometry (CyTOF) and RNA sequencing (RNA-seq). For CyTOF, we used high-dimensional visualization and unsupervised clustering. PD-1 is known to be expressed not only by Tex cells, but also effector, effector memory and central memory CD8 T cells16,17. Indeed, memory (CCR7hi) and effector (CD27lo) populations were among PD-1-expressing CD8 T cells (Extended Data Fig. 6a). However, a third population, expressing markers of exhaustion (for example, Eomes, CD39 (ref. 18); Fig. 2d, Extended Data Fig. 6e, f) was also identified that increased in frequency and Ki67 expression after anti-PD-1 therapy (Extended Data Fig. 6b–d). This population of circulating Tex cells had low expression of granzyme B and perforin but high granzyme A and K, before and after anti-PD-1 therapy (Fig. 2e–g). RNA-seq from total CD8 T cells identified few transcripts that robustly changed following treatment (Extended Data Fig. 7a, b). However, focusing on genes with altered expression following the same pattern as Ki67 in bulk CD8 T cells revealed transcriptional changes consistent with Tex cells (Extended Data Fig. 7c, d, Supplementary Table 1). These analyses identified increased expression of CTLA4, HAVCR2 (encoding TIM-3), HLA-DRB1 and CD38, and changes in pathways including proliferation, metabolism, CD28 co-stimulation, and JNK signalling. Moreover, the set of top 50 positive gene correlates of Ki67 was highly enriched for a signature of Tex cells reinvigorated by PD-1 blockade previously obtained in the LCMV system in mice19 (Fig. 2h). Together, these data identified a circulating population with a Tex-cell phenotype in the blood and revealed changes in this population following anti-PD-1 therapy, consistent with reinvigoration of Tex cells.
Responding T-cell clones from blood found in tumour
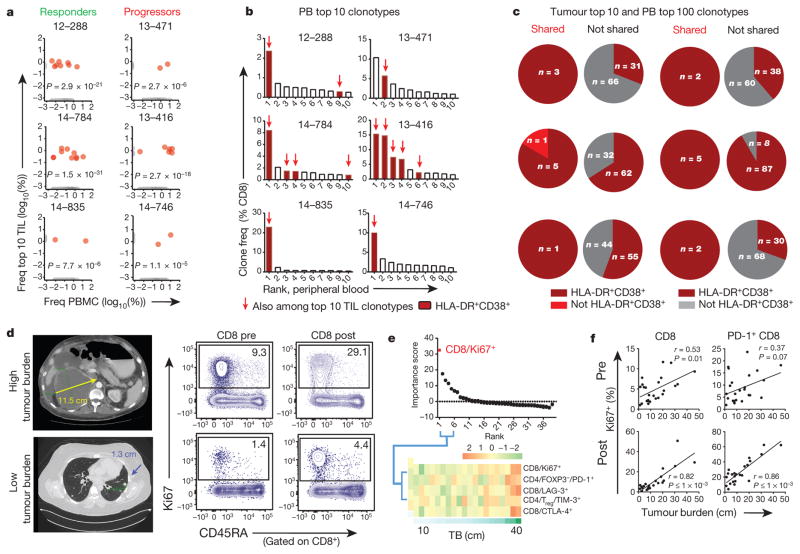
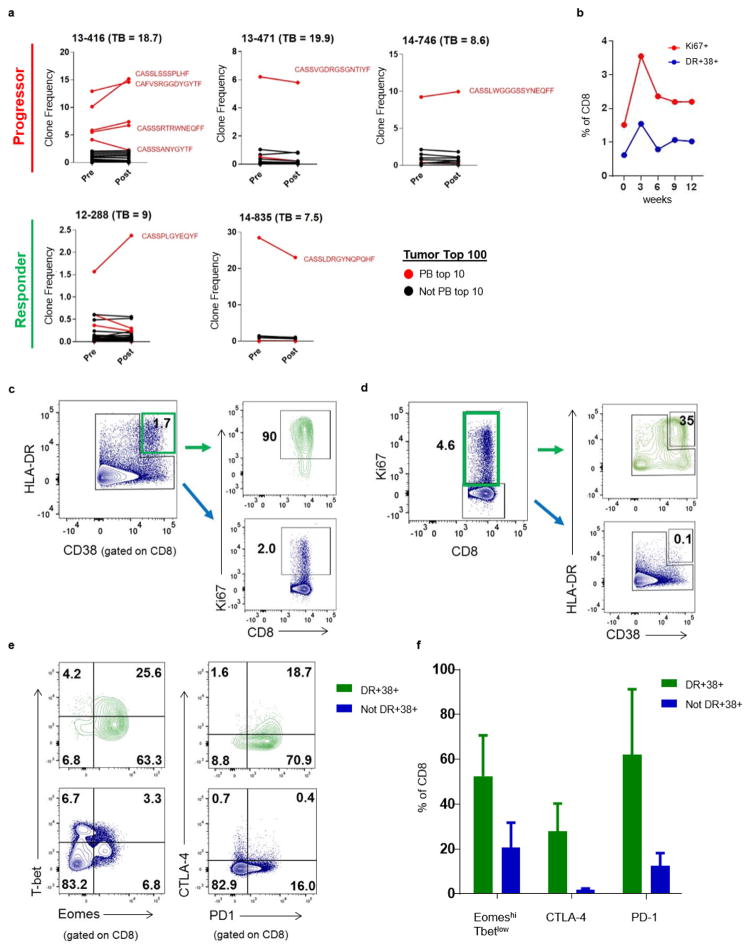
Both neoantigen- and shared-antigen-specific T cells have been identified in the circulating PD-1+ CD8 T-cell population20. Moreover, there is clonal overlap between these cells in the blood and tumour-infiltrating T cells20. To explore these relationships following anti-PD-1 therapy, CD8 T cells from the blood were sorted at the peak of Ki67 expression after treatment from three responders and three non-responders, and the T-cell receptor (TCR) repertoire was compared to pretreatment tumour-infiltrating T cells. Many of the top 10 tumour-infiltrating T-cell clones were readily identifiable in the blood and after therapy, including the two most abundant clones by frequency in all cases, regardless of clinical response (Fig. 3a, b, Extended Data Fig. 8a, Supplementary Table 2).
Figure 3. Tumour-infiltrating T-cell clones in responding peripheral blood CD8 T-cell population and blood Ki67+ CD8 T-cell response correlates with tumour burden.
a–c, TCR sequencing on CD8 T cells (see Methods). a, Frequency of clones in blood and among top 10 clones in tumour (red). Clones only in blood or tumour in grey (P value; Fisher’s exact test). PBMCs, peripheral blood mononuclear cells. b, Frequencies of top 10 blood clones and those shared with top 10 tumour-infiltrating T-cell clones (red arrows). All shared clones were HLA-DR+CD38+ (maroon). c, Proportion of HLA-DR+CD38+ clones among top 100 clones in blood shared versus not shared with top 10 TIL clones. d, Example CT scans of high (top) or low (bottom) tumour burden, and Ki67 expression in blood CD8 T cells. e, Top 39 immune parameters correlated with tumour burden by random forest analysis at week 3 (top). Heat map of top five parameters (bottom). f, Pearson correlation of tumour burden to Ki67 expression pretreatment and maximum post-treatment in indicated cells (n = 25 pretreatment, 23 post-treatment). TCR sequencing data (a–c) are representative of one technical replicate. r and P values, Pearson’s correlations.
We then determined whether these shared clones were present in the population responding to anti-PD-1 therapy. To avoid permeabilization, responding cells were sorted using expression of HLA-DR and CD38 (ref. 21), rather than Ki67. Approximately 80% (mean, 80.1%) of the HLA-DR+CD38+ CD8 T cells expressed Ki67, and these HLA-DR+CD38+ cells responded with similar kinetics as Ki67+ CD8 T cells (Extended Data Fig. 8b–d). RNA-seq identified HLA-DRB1 and CD38 among the top 50 correlates of Ki67 (Supplementary Table 1) and these HLA-DR+CD38+ cells were enriched for markers of Tex cells (Extended Data Fig. 8e, f). Across six patients, 14 clones were present among the top 10 clones in both the tumour and blood (Fig. 3b). All of these (14 out of 14) were HLA-DR+CD38+ in the blood (Fig. 3b). Extending to the top 100 clones, 18 out of 19 clones shared between blood and tumour were HLA-DR+CD38+, whereas a mixture of activated and resting phenotype was found for clones that were only found in the blood and not tumour (Fig. 3c). These observations support the notion that Ki67+ (HLA-DR+CD38+) Tex cells in the blood are reinvigorated by anti-PD-1 therapy and contain T-cell clones that are also present in the tumour.
T-cell reinvigoration correlates with tumour burden
Antigen burden is a key determinant of the severity of exhaustion and reinvigoration of Tex cells by PD-1 therapy in preclinical models10,22. To test this idea in patients with melanoma, we developed a practical approach to estimate antigen burden using all measurable tumour lesions on the pretreatment imaging scan (tumour burden, see Methods). Indeed, higher tumour burden was associated with more Ki67+ CD8 T cells both before and after therapy (Fig. 3d). Random forest modelling of 39 immune parameters at 3 weeks showed that Ki67+ CD8 T cells were the strongest correlate of tumour burden (Fig. 3e, Supplementary Table 3). This correlation was also detectable before treatment, but became stronger after treatment (Fig. 3f), suggesting a pre-existing CD8 T-cell response related to tumour burden, augmented by anti-PD-1 therapy.
Reinvigoration/tumour ratio affects clinical outcome
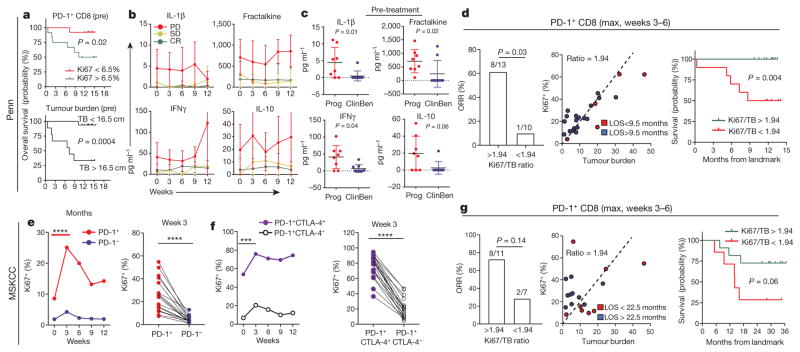
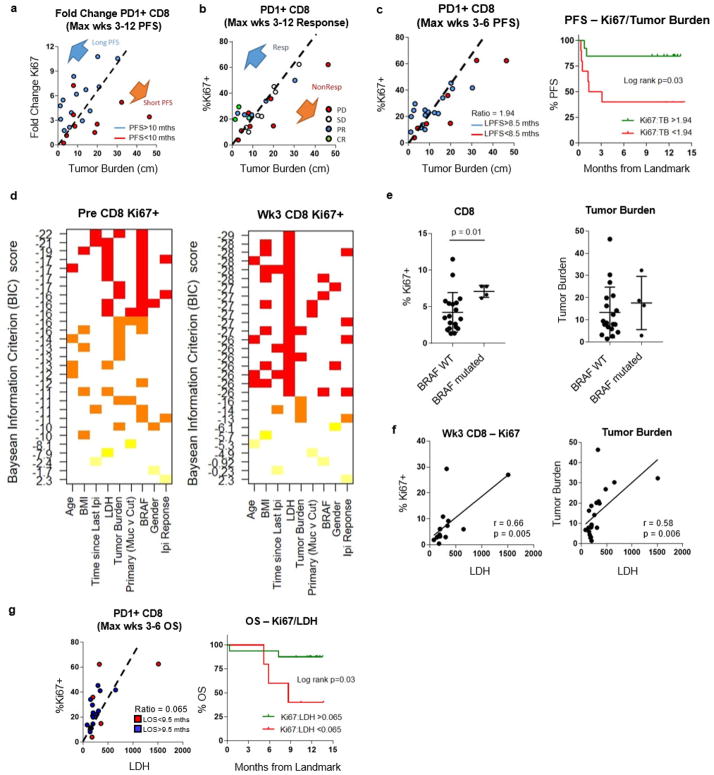
It was possible that larger baseline immune responses would correlate with clinical response. However, higher pretreatment Ki67 levels in PD-1+ CD8 T cells were in fact an indicator of poor prognosis (Fig. 4a, top). A larger immune response before treatment may reflect higher tumour burden that itself is a poor prognostic indicator (Fig. 4a, bottom). Indeed patients who progressed on anti-PD-1 therapy had evidence of systemic inflammation at baseline (Fig. 4b, c). Random forest analysis showed that Ki67 alone did not correlate with clinical outcome (data not shown). We therefore hypothesized that it was not the absolute magnitude of reinvigoration that mattered, but rather that the ratio of Tex-cell reinvigoration to tumour burden might better predict clinical response. To test this, we examined clinical responses in relation to the fold change of PD-1+Ki67+ CD8 T cells after anti-PD-1 therapy, adjusted for baseline tumour burden. Patients with longer progression-free survival (PFS) generally had a low tumour burden and clustered above the fold change of PD-1+Ki67+ CD8 T cells to tumour-burden regression line, suggesting that the ratio of Tex-cell reinvigoration to tumour burden may be associated with clinical outcome (Extended Data Fig. 9a). Moreover, instead of fold change that required measurements both before and after treatment, a higher ratio of Ki67+ CD8 T cells to tumour burden at the post-treatment peak T-cell-response time point was associated with better clinical outcomes. Responders clustered above the PD-1+Ki67+ cell to tumour-burden regression line, whereas non-responders largely fell below (Extended Data Fig. 9b). Classification and regression tree (CART) analysis identified a Ki67 to tumour burden ratio of 1.94 that segregated patients by clinical outcomes as early as 6 weeks into therapy. A Ki67 to tumour burden ratio greater than 1.94 at 6 weeks was associated with better outcome by objective response rate, PFS and overall survival (Fig. 4d, Extended Data Fig. 9c). Moreover, by CyTOF, the three patients with clinical benefit (complete response, partial response, and stable disease) showed expansion of Tex cells, whereas the patient who progressed showed an expansion of Teff cells (Extended Data Fig. 6g, h), supporting the idea that reinvigoration of Tex cells is important.
Figure 4. Tracking CD8 T-cell reinvigoration in context of tumour burden predicts response to anti-PD-1 therapy.
a, Overall survival of patients with high (n = 11) and low (n = 14) expression of Ki67 (top), or high (n = 9) and low (n = 16) tumour burden (bottom). Cut-points by CART analysis (see Methods). b, c, Plasma cytokines by response and clinical benefit (Mann–Whitney U-test; progression n = 8, clinical benefit n = 9). CR, complete response; PD, progressive disease; SD, stable disease. d, Objective response rate for high and low ratio of Ki67 to tumour burden (left), tumour burden versus Ki67 by LOS (landmark overall survival) (centre), and Kaplan–Meier overall survival stratified by post-treatment Ki67 to tumour burden ratio (right). Objective response by Fischer’s exact test (Ki67 to tumour burden ratio: high, n =13; low, n = 10). Kaplan–Meier data (Ki67 to tumour burden ratio: high, n =13; low, n =12). e–g, Independent Keynote 001 trial. e, f, Ki67 in indicated subsets (n =18; paired t-test (left), Wilcoxon matched-pairs test (right)). g, Objective response rate for high and low Ki67 to tumour burden ratio (left), Ki67 versus tumour burden by LOS (centre) (n = 18), and Kaplan–Meier overall survival for high versus low post-treatment Ki67 expression to tumour burden (right). Objective response by Fischer’s exact test (Ki67 to tumour burden ratio: high, n =11; low, n =7). Kaplan–Meier overall survival (Ki67 to tumour burden ratio: high, n =11; low, n =7). ***P <0.001, ****P < 0.0001. Error bars, s.d. Cytokine data (b, c) are representative of two technical replicates. MSKCC flow data (e–g) are representative of two technical replicates.
Other variables were examined by multivariate regression modelling (Extended Data Fig. 9d), implicating additional roles for BRAF status that may be related to tumour-infiltrating lymphocytes upon BRAF inhibition23,24 and lactate dehydrogenase, a potential circulating proxy for tumour burden (Extended Data Fig. 9e–g) and known negative-prognostic indicator in stage IV melanoma25. Moreover, data from a subset of patients also suggested a role for PD-L1 expression in the tumour and mutational burden, consistent with published observations3,4,26 (data not shown). Thus, extending this modelling to include other variables will be important in the future.
A second independent cohort of patients with advanced melanoma that was treated with pembro was analysed. Flow cytometry was performed on the CD8 T cells from a subset of patients involved in clinical trial NCT01295827 (Extended Data Fig. 1). Data from this cohort confirmed preferential reinvigoration of PD-1+ and PD-1+CTLA-4+ CD8 T cells after pembro treatment (Fig. 4e, f). These analyses also demonstrated that a Ki67 to tumour burden ratio of 1.94 was associated with overall survival by 6 weeks after treatment (Fig. 4g). These key observations in an independently recruited and analysed cohort support the idea that the relationship between reinvigorated CD8 T cells in the blood and overall tumour burden correlates with clinical outcome.
Discussion
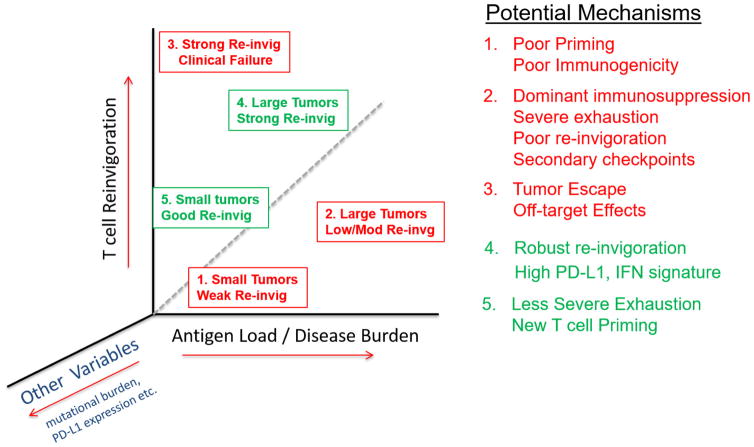
Here we report several findings relevant to the understanding of response to PD-1 blockade in patients with advanced melanoma. First, most patients have an on-target immunological effect of PD-1 blockade on CD8 T cells and this effect can be detected, longitudinally monitored and mechanistically interrogated in the peripheral blood. Second, we identified Tex cells as a major target of PD-1 blockade in most patients with melanoma, allowing us to develop a ‘reinvigoration score’ by relating changes in circulating Tex cells to tumour burden. Third, most patients have a single peak of PD-1-blockade-induced immune reinvigoration, despite on-going treatment. Fourth, these responding Tex cells in the blood contain TCR clonotypes shared with tumour-infiltrating T cells. Finally, we identify that the ratio of Tex-cell reinvigoration to tumour burden can distinguish clinical outcomes and predict response. The relationship between Tex-cell reinvigoration and tumour burden suggests a ‘calibration’ of immune responses to antigen burden and raises the possibility that even robust reinvigoration by anti-PD-1 therapy may be clinically ineffective if the tumour burden is high. On the basis of these observations, it may be possible to delineate classes of predicted therapeutic failures (Extended Data Fig. 10). Tumour burden alone is not a perfect predictor of response to anti-PD-1 therapy and it has been challenging to define on-treatment predictive markers. An on-treatment biomarker is not only valuable in helping to define clinical responses as early as possible, but also in informing the type of immunological failure and tailor subsequent therapies. It is likely that other parameters such as anatomical location of metastases, PD-L1 expression and mutational phenotype will add further resolution to this relationship between T-cell reinvigoration and tumour burden. Recognizing, on the basis of tumour burden, that the amount of reinvigoration induced by PD-1 blockade in a given patient may be inadequate allows for early clinical intervention, for example with additional immune or targeted therapies27,28. It will be important to test if the approaches reported here can be extended to other, especially less immunogenic, tumour types. However, the current study not only illustrates the on-target pharmacodynamic immune effect of PD-1 blockade and utility of blood-based immune monitoring, but also identifies a potential novel predictive biomarker and a framework for future mechanistic dissection by revealing the relationship between overall tumour burden and magnitude of immune reinvigoration by PD-1 blockade.
Online Content Methods, along with any additional Extended Data display items and Source Data, are available in the online version of the paper; references unique to these sections appear only in the online paper.
METHODS
Data reporting
No statistical methods were used to predetermine sample size. The experiments were not randomized and the investigators were not blinded to allocation during experiments and outcome assessment.
Patients and specimen collection
Patients with stage IV melanoma were enrolled for treatment with pembrolizumab (2 mg kg−1 by infusion every 3 weeks) under an Expanded Access Program at Penn (http://clinicaltrials.gov identifier NCT02083484) or on NCT01295827 at Memorial Sloan Kettering Cancer Center (‘MSKCC’). Patients consented for blood collection under the University of Pennsylvania Abramson Cancer Center’s (‘Penn’) melanoma research program tissue collection protocol UPCC 08607 and under protocol 00-144 at MSKCC, in accordance with the Institutional Review Boards of both institutions. Peripheral blood was obtained in sodium heparin tubes before treatment and before each pembro infusion every 3 weeks for 12 weeks. Peripheral blood mononuclear cells (PBMCs) were isolated using ficoll gradient and stored using standard protocols.
Assessment of response and tumour burden
Tumour burden
Total measurable tumour burden was defined as the sum of the long axis of all measurable lesions reported on the pre-therapy imaging reports. Patients with only non-measurable lesions or active brain metastasis were excluded from analysis involving clinical response and tumour burden. Assessment of clinical response and tumour burden was performed independently in a blinded fashion.
Clinical response, Penn cohort
Clinical response to anti-PD-1 therapy for the Penn cohort was determined as best response based on immune related RECIST (irRECIST) using unidimensional measurements29. In addition, the following modifications were used. (1) Lymph node lesions with a short axis between 10 and 15 mm with a standard uptake value (SUV) of greater than 5 on PET scan were included as measurable lesions. (2) Lesions greater than 5 mm confirmed to be melanoma by biopsy were included as measurable lesions.
Clinical response, MSKCC cohort
Clinical response for the MSKCC cohort was assessed based on immune-related response criteria30 using bidimensional measurements at the 12 week time point.
Flow cytometry
Penn cohort
Cryopreserved PBMC samples from pretreatment, cycles 1–4 (weeks 3–12) were thawed and stained with master mix of antibodies for surface stains including CD4 (Biolegend, OKT4), CD8 (ebioscience, RPA-T8), 2B4 (Beckman Coulter, IM2658), CD45RA (Biolegend, HI100), TIM-3 (F38-2E2), LAG-3 (Enzo, ALX-804-806B-C100), CXCR5-BV421 (BD, RF8B2) and CD27 (BD, L128) and intracellular stains for FOXP3 (BD, 259D/C7), CTLA-4 (BD, BNI3), Eomes (ebioscience, WD1928), T-bet (Biolegend, 4B10), GzmB (Life Tech, GB11), TCF-1-AlexaFluor647 (Biolegend, 7F11A10) and Ki67 (BD, B56). Permeabilization was performed using the FOXP3 Fixation/Permeabilization Concentrate and Diluent kit (eBioscience). PD-1 on post pembro specimens was detected using anti-human IgG4 PE (Southern Biotec). Pretreatment samples were pretreated with 25 μg ml−1 pembro in vitro for 30 min at 37 °C, washed twice and stained with standard antibody mix. Cells were resuspended in 1% paraformaldehyde until acquisition on a BD Biosciences LSR II cytometer and analysed using FlowJo (Tree Star).
MSKCC cohort
PBMC samples at the indicated visits pre- and post-pembrolizumab treatment were thawed and stained with a fixable Aqua viability dye (Invitrogen) and a cocktail of antibodies to the following surface markers: CD8–Qdot605 (Invitrogen, 3B5), CD4–Qdot655 (Invitrogen, S3.5), PD-1–PE (BD, MIH4), LAG-3–FITC (Enzo, 17B4), ICOS–PE-Cy7 (eBioscience, ISA-3), TIM-3–APC (R&D Systems, 344823). Cells were next fixed and permeabilized with the FOXP3/Ki67 Fixation/Permeabilization Concentrate and Diluent (eBioscience), and subsequently stained intracellularly with CD3–BV570 (Biolegend, UCHT1), Ki67–AlexaFluor700 (BD), FOXP3-eFluor450 (eBioscience), and CTLA-4–PerCP–eFluor710 (eBioscience). Stained cells were acquired on a BD Biosciences LSRFortessa and analysed using FlowJo software (FlowJo, LLC).
Cell sorting
Cryopreserved PBMC samples were thawed and stained as per flow cytometry protocol (above). For RNA sequencing experiments, total CD8 T cells were sorted, using a dump/dead-CD3+CD8+ gating strategy. For TCR sequencing experiments, CD8 T cells were gated as above, and CD38+HLA-DR+ and cells that were not CD38+HLA-DR+ (that is, CD38−HLA-DR−, CD38+HLA-DR−, and CD38−HLA-DR+) were sorted. Cell sorting was performed on BD Aria Sorter.
Cytokine analysis
Concentration of circulating plasma cytokines was analysed using Luminex technology (EMD Millipore).
Stimulation with PMA and ionomycin
Thawed cells were stimulated with phorbol 12-myristate 13-acetate (PMA) (Sigma) at 0.25 μg ml−1 and ionomycin (Sigma) at 2.5 μg ml−1 for 2–5 h in 37 °C and stained. Cytokine production was analysed with intracellular staining using antibodies to IFNγ (Biolegend, B27) and TNF-α (Biolegend, Mab11).
Random forest for classification and regression
Random forest regression and classification (RF–RC) is a multivariable non-parametric ensemble partitioning tree method that can be used to model the effect of all interactions between genes and proteins as predictors on a response variable31. Each model is constructed using approximately two-thirds of randomly selected samples and cross-validated on the one-third of the samples left out of the model building process (‘out-of-bag’ samples). After many iterations, results of all models are averaged to provide unbiased estimates of predicted values, error rates, and measures of variable importance. Performance of an RF–RC model is measured by the mean square error for regression and by misclassification error rate for classification. Flow cytometry subsets were used as possible predictors of clinical response variables. For each predictor, an importance score is determined, that measures the contribution of the variable to the error rate (higher scores are more predictive). We used the ‘randomForest’ R package version 4.6–12 implementation and the following parameters: 5,000 trees, node size of 1, mtry value (that is, number of variables available for splitting at each node) equal to the square root of the number of variables in the model, and the Breiman–Cutler permutation method for importance score determination. The mean decrease in accuracy is used as the importance score measure.
Mass cytometry and CyTOF analysis
Mass cytometry reagents were obtained from Fluidigm or generated by conjugation of unlabelled mAbs to isotope-loaded polymers per the MAXPAR kit instruction (Fluidigm). Single-cell suspensions were pelleted, and incubated with 20 μM Lanthanum-139 (Trace Sciences)-loaded maleimido-mono-amine-DOTA (Macrocyclics) in PBS and incubated for 10 min at room temperature for live/dead discrimination. Cells were washed in staining buffer and resuspended in surface antibody cocktail, incubated for 30 min at room temperature, washed twice in staining buffer, fixed, and permeabilized using FOXP3 staining buffer set (eBioscience), and stained intracellularly for 60 min at room temperature. Cells were further washed twice before fixation in 1.6% PFA (Electron Microscopy Sciences) solution containing 125 nM iridium overnight at 4 °C. Before data acquisition on CyTOF2 (Fluidigm), cells were washed twice in PBS and once in dH2O. Data analysis was performed with FlowJo v10 (TreeStar) and SPADE (Cytobank) as outlined previously32. Analysis of fold change frequency was performed using the ‘percenttotalratiolog’ parameter for SPADE that performs the calculation log10[percentage of total (week 3)/(percentage of total (pretreatment)]. Summary statistics for Tex, Tmem, and Teff cells were calculated as the median fold change or mass intensity of each cluster by taking into account the proportion contributed by each node. R package ‘pheatmap’ was used for creating heat maps.
T-cell receptor sequencing
Manual macrodissection was performed on FFPE slides, if necessary, using a scalpel and a slide stained with haematoxylin and eosin (H&E) as a guide. Tissue deparaffinization and DNA extraction were performed using standard methods. DNA was quantified using Qubit dsDNA BR Assay (Invitrogen). Peripheral blood CD8 T cells were purified and isolated from PBMCs using BD Aria Sorter. DNA extraction, amplification, library preparation, sequencing, and preliminary bioinformatics analysis was performed by Adaptive Biotechnologies. Amplification and sequencing of TCRB CDR3 was performed at a survey level resolution using the immunoSEQ Platform (Adaptive Biotechnologies).
Immunohistochemistry for PD-L1 and CD8, and analysis
Formalin-fixed, paraffin-embedded tumours were collected at the time of surgical resection or from a biopsy. For anti-PD-L1 staining, after heat-induced antigen retrieval (Bond ER2, 20 min), the tumour slides were stained with an anti-PD-L1 antibody (E1L3N, Cell Signaling) at 1:50 dilution. To confirm specificity, the anti-PD-L1 antibody was validated by staining Hodgkin’s lymphoma cells and placenta. For anti-CD8 staining, after heat-induced antigen retrieval (Bond ER1, 20 min), the tumour slides were stained with an anti-CD8 antibody (M7103, Dako) at 1:40 dilution. Tumour infiltrating CD8-positive T cells was scored as absent, minimal, mild, moderate and brisk by a blinded expert melanoma pathologist. Tumour-infiltrating CD8 T cells were also analysed by image recognition analysis using ImageJ2. Digital slides were acquired by a Leica microscope. RGB stack images of CD8 staining were converted to greyscale, and particles (positive stain) counted using a threshold value of 100 with a size between 10 and 625 μm2. Total area of the tumour was calculated using a tumour mask.
RNA sequencing and analysis
After sorting, the cells were resuspended and frozen in RLT buffer (Qiagen). RNA was isolated using the Qiagen RNeasy micro kit (74034) according to the manufacturer’s protocol. RNA-seq libraries were prepared using the SMARTer Stranded Total RNA-Seq Kit for Pico Input Mammalian from Clonetech according to the manufacturer’s protocol (635007). The libraries were sequenced on an Illumina NextSeq machine using a 300-cycle high-output flow cell (15057929), with a read depth between 9 million and 20.6 million paired mapped reads. The Fastq files were aligned using STAR 2.5.2a and hg19. The aligned files were processed using PORT gene-based normalization (https://github.com/itmat/Normalization). The differential gene expression was performed with Limma. Limma-voom was used to identify significantly different transcripts between groups using P value <0.05. For patients with a Ki67 peak at cycle 1 (three patients), the top 40 genes highly correlated with MKI67 were taken to create a correlative network including the top 5 genes correlating with the MKI67-correlated genes. The final network had nodes with highly correlated (absolutely value of the correlation coefficient >0.7 (abs(corr) > 0.7)) values with MKI67. Cytoscape 3.4.0 was used for creation of correlation network, and metascape.org was used to enrich genes for GO biological processes. The data discussed in this publication have been deposited in NCBI Gene Expression Omnibus and are accessible through GEO Series accession number GSE96578 (https://www.ncbi.nlm.nih.gov/geo/query/acc.cgi?acc=GSE96578).
Whole-exome sequencing, mutational burden analysis and neoepitope prediction
Manual macrodissection was performed on FFPE slides, if necessary, using a scalpel and H&E-stained slide as a guide. Tissue deparaffinization and DNA extraction were performed using standard methods. DNA was quantified using Qubit dsDNA BR Assay (Invitrogen). DNA libraries were created using NEBNext Ultra DNA Library Prep Kit for Illumina (New England BioLabs) and targets were captured with SureSelect Human All Exon V6 + COSMIC (Agilent). HLA type was determined with OptiType and neoepitope predictions were made using NetMHCcons 1.1 Server.
Statistical methods and classification and regression tree (CART) analysis
For group comparisons and correlation analyses, testing was performed using PRISM 6.0. Normality of distributions was assessed using D’Agostino–Pearson omnibus normality test and variance between groups of data was assessed using the F-test. For normally distributed data, significance of mean differences was determined using two-sided paired or unpaired Student’s t-tests, and for groups that differed in variance, unpaired t-test with Welch’s correction was used. For non-normal data, non-parametric Mann–Whitney U-tests or Wilcoxon matched-pairs signed rank tests were used for unpaired and paired analyses, respectively. Descriptive statistics included mean, median, standard deviation and range for continuous variables and frequency and proportion for categorical variables. Correlations between continuous variables were determined by Pearson’s r coefficient, whereas correlations between ordinal-scaled categorical variables were determined by Spearman’s r coefficient. Overall survival was defined from the initiation of treatment to date of death or last patient contact alive and estimated by the Kaplan–Meier method. Landmark overall survival and PFS analysis was defined as overall survival and PFS starting from 6 weeks after therapy. To visually inspect the relationships between Ki67 (week 6 maximum), baseline tumour burden and clinical outcomes, we constructed simple scatter plots of Ki67 by baseline tumour burden and employed colour-coded symbols for clinical outcome such as overall survival, PFS, and clinical response. In general, the mean was used for dichotomization of clinical outcomes. This included PFS and landmark PFS in the Penn dataset (Extended Data Fig. 4, Extended Data Fig. 9) and landmark overall survival for MSKCC dataset (Fig. 4g). In the Penn dataset, landmark overall survival was dichotomized using a cutoff of 9.5 months, as it represented the longest complete survival time (that is, no patient with LOS <9.5 months was alive and censored for survival) (Fig. 4d, Extended Data Fig. 9). The log rank test was employed to compare overall survival between patient subgroups. The ratio of Ki67 to tumour burden was associated with overall survival and was further examined by CART analysis. CART identified the optimal cut point to split this continuous variable into two homogenous subgroups according to overall survival. By this method, the optimal cut point is selected from all possible cut points. Survival and CART statistical analyses were performed using either IBM SPSS v23 or STATA v14. Similar analysis was performed for landmark PFS.
Model selection, principal component analysis and Fisher’s exact calculation
Model selection is a method of selecting models among a set of candidate models. The R package ‘leaps’ version 2.9 with parameters ‘nvmax = 3’, and ‘nbest =10’ was used to select the ten best models on the basis of linear regression for predicting CD8 and Ki67 expression.
Clinical parameters were used as predictor variables and Ki67 as the dependent variable. This method evaluates all one-variable, two-variable, and three-variable models and ranks best-fitting models using the Bayesian information criterion (BIC), penalized by number of variables. Lower BIC score signals a better model.
Principle component analysis was used to visualize three variables: tumour burden, Ki67, and mutational burden in two-dimensional space. R package factoMiner was used to calculate and extract the percentage of variance explained by principal components and the variables contained in each PCA variable.
Fisher’s exact test was used to test the hypothesis that the probability of finding shared TCR CDR3 clonotypes (between top 10 tumour-infiltrating T-cell clones and peripheral blood, Fig. 3a) among all unique sequenced peripheral blood clones was different than the probability of finding a clone in the tumour by random chance, with an theoretical estimate of 107 possible peripheral blood clonotypes. P value was calculated using the R function ‘fisher.test()’.
Data availability
RNA sequencing data that support the findings have been deposited in NCBI Gene Expression Omnibus and are accessible through GEO Series accession number GSE96578 (https://www.ncbi.nlm.nih.gov/geo/query/acc.cgi?acc=GSE96578). Flow cytometry, TCR sequencing, and clinical data are included in this published article and its Extended Data and Supplementary Information. All other relevant data are available from the corresponding author upon reasonable request.
Extended Data
Extended Data Figure 1. Clinical characteristics, response data, and immune data for cohorts analysed.
a, Penn pembro Expanded Access Program (left) and MSKCC Keynote-001 trial (right) that were included in analysis. b, Immune and clinical data from analysed patients in Penn cohort stratified by fold change Ki67 greater or less than 2.2 (blue, responder; red, non-responder).
Extended Data Figure 2. CD4+FOXP3−, CD4+FOXP3+ and CD8 T cells from patients with melanoma have increased Ki67 expression compared to healthy donors.
a, Frequency and Ki67 expression in FOXP3+ CD4 T cells in healthy donors and melanoma patients. Student’s t-test. b, Ki67 expression in CD8 T cells between healthy donors and melanoma patients. Mann–Whitney U-test. c, Ki67 expression in PD-1+ and PD-1− CD8 T cells in healthy donors and patients with melanoma. Healthy donors versus patients, Mann–Whitney U-test; PD-1+ versus PD-1− CD8 T cells in patients with melanoma, Wilcoxon matched-pairs test. d, Ki67 expression in FOXP3− CD4 T cells and FOXP3+ CD4 cells over time. Wilcoxon matched-pairs test. e, Scatter plot of Ki67 expression in PD-1+CD4+FOXP3− T cells versus tumour burden by PFS. f, Ki67 expression in PD-1+CD4+FOXP3+ cells versus tumour burden by PFS (pretreatment, n =29; post-treatment, n =27 (e, f)). For all panels, **P <0.01, ****P < 0.0001. Error bars denote s.d. Flow cytometry data in all panels are representative of 1–4 independent technical replicates of the stain indicated.
Extended Data Figure 3. PD-1 detected after therapy using anti-human IgG4 and proliferating CD8 T cells in healthy donors.
a, Healthy donor PBMCs were incubated with anti-PD-1 clone EH12 BV421 and/or pembro—alone, together or sequentially followed by anti-human IgG4–phycoerythrin. b, Plots of Eomes, T-bet, CD45RA, and CD27 expression in Ki67+ CD8 T cells from a representative healthy donor. c, Comparison of Eomes versus T-bet and CD45RA versus CD27 phenotypes in patients n =10). **P <0.01, Student’s t-test. d, Mean fold change of Ki67 on PD-1+ CD8 T cells over 3 weeks in healthy donors (n = 7). Error bars denote s.d.; centre line denotes mean; dotted line denotes fold change of 2.21, which is equal to the mean + 3 s.d. Flow cytometry data in all panels are representative of 1–2 independent technical replicates of the stain indicated.
Extended Data Figure 4. Effect of anti-CTLA-4 therapy on Ki67 expression is restricted to the pretreatment time point.
a, Correlation of the percentage of PD-1+ CD8 T cells expressing Ki67 to months since last dose of anti-CTLA-4 (pretreatment, n = 26; week 3, n =25). b, Correlation of the percentage of CTLA-4 in CD8 T cells and months since last dose of anti-CTLA-4 (pretreatment, n = 26; week 3, n =25). c, Correlation of clinical parameters such as PFS, overall survival (OS), tumour burden, and Ki67 to tumour burden ratio with months since last dose of anti-CTLA-4 (pretreatment, n = 23; week 3, n =22). r and P values, Pearson’s correlations.
Extended Data Figure 5. CD8 T cells with multiple inhibitory receptors and PD-1+CXCR5+ CD8 T cells are reinvigorated by anti-PD-1 therapy.
a, Ki67 expression in CD8 T cells with multiple inhibitory receptors over time. Week 0 versus week 3 (n = 27). Wilcoxon matched-pairs test. b, Percentage of CD8 T cells positive for PD-1 during pembro treatment (n = 27), Wilcoxon matched-pairs test. c, Back-gating of TEMRA and naive CD8 T-cell populations onto CD45RA versus TCF-1 (right). d, TCF-1 expression in PD-1+CXCR5+ CD8 T cells in blood at week 3 (n =11). Paired t-test. e, Eomes/T-bet (red) and Eomes/TCF-1 (green) expression in PD-1+CXCR5+ (left) and PD-1+CTLA-4+ (right) subsets. f, Ki67 expression in PD-1+CTLA-4+ and PD-1+CXCR5+ CD8 T cells over time (left) and fold change of Ki67 in PD-1+CXCR5+ and PD-1+CTLA-4+ subsets (right) (n = 11). Wilcoxon matched-pairs test. g, IFNγ production by PD-1+CXCR5+ and PD-1+CTLA-4+ subsets over time; paired t-test. For all panels, *P <0.05, **P <0.01, ***P <0.001, ****P < 0.0001. Error bars denote s.d. CXCR5 and TCF-1 stain is representative of one technical replicate. All other flow cytometry data are representative of 1–4 independent technical replicates of the stain indicated.
Extended Data Figure 6. Conventional differentiation state and clusters of Tex cells can be identified using CyTOF and high-dimensional visualization.
a–c, SPADE analysis applied to blood samples from patients with melanoma and analysed by CyTOF. a, SPADE tree showing MMI of CD27 (left) and CCR7 (right) (representative of 4 patients). b, SPADE tree coloured by median intensities of fold change frequency (left), and Ki67 expression (middle and right) before treatment and at 3 weeks. c, Fold change frequency (left) and MMI of Ki67 (right) of Tex, Tmem, and Teff subsets. d, Frequency of Tex cluster in PD-1+ CD8 T cells over time. e, SPADE tree coloured by MMI of Eomes (left) and CD39 (right) expression at 3 weeks (n =4). f, MMI of Eomes (left) and CD39 (right) of Tex, Tmem, and Teff subsets. g, Percentage of cells in Tex cluster (left) and Teff cluster (right) in PD-1+ CD8 T cells over time based on CyTOF and SPADE analysis. h, Frequency of Tex versus tumour burden coloured by response. Mass cytometry data in all panels are representative of one technical replicate. MMI shown in this figure represents arcsinh transformed data.
Extended Data Figure 7. RNA-seq of CD8 T cells reveals molecular pathways correlating with reinvigoration.
a–d, RNA-seq was performed on total purified CD8 T cells from three patients at weeks 0, 3, 9, 12. a, Volcano plot of genes altered at 3 weeks compared to pretreatment. Volcano plot constructed using log2 fold changes and their P values of all genes. b, Pathways identified by gene ontology analysis that were altered at week 3 compared to pretreatment using top 50 differentially expressed genes (all genes with fold change >1.5 and P <0.05). c, Correlation coefficients to Ki67 were used to generate a correlation network. Nodes coloured by strength of correlation to Ki67 (Pearson r = 1 (red), −1 (blue)); node size indicates degree of connectivity. d, Pathways identified by gene ontology analysis using top 100 correlated genes with Ki67 (positive and negatively correlated genes with correlation coefficients >0.67 and <−0.67). RNA sequencing data in all panels are representative of one technical replicate.
Extended Data Figure 8. HLA-DR and CD38 expression enriches for responding Ki67+ cells and TCR clones found in top 100 clones in tumour identified in blood.
a, TCR clones present at pretreatment and post-treatment that are also in the top 100 clones in the tumour. Clones that are among the top 10 in the peripheral blood post treatment highlighted in red. Patient 14–784 did not have an available pretreatment sample and was not included. b, Percentage of CD8 T cells that are Ki67+ (red) and HLA-DR+CD38+ (blue) over time. c, Representative plot of Ki67 expression in HLA-DR+CD38+ CD8 T cells and CD8 T cells that were not CD38+HLA-DR+ (that is, CD38−HLA-DR−, CD38+HLA-DR−, and CD38−HLA-DR+). d, Representative plot of HLA-DR and CD38 expression on Ki67+ and Ki67− CD8 T cells. e, Representative plot of Eomes versus T-bet and PD-1 versus CTLA-4 in HLA-DR+CD38+ (‘DR+38+’) CD8 T-cell subsets and cells that were not CD38+HLA-DR+. f, Percentage of EomeshiT-betlo, PD-1, CTLA-4 and expression on CD8 T cells (n = 5). TCR sequencing and flow cytometry data in all panels are representative of one technical replicate.
Extended Data Figure 9. High Ki67 to tumour burden ratio correlates with improved clinical outcomes and model selection identifies BRAF and lactate dehydrogenase as correlates to Ki67.
a, Scatter plot of maximum fold change of Ki67 expression after treatment versus tumour burden stratified by PFS (n =23). b, Maximum post-treatment Ki67 expression versus tumour burden by response (n =23). c, Ki67 expression to tumour burden ratio stratified by landmark PFS (PFS starting from 6 weeks into therapy) (left; n = 23). Kaplan–Meier analysis stratified by a Ki67 to tumour burden ratio of 1.94 (right; Ki67 to tumour burden ratio: high, n =13; low, n = 10); log-rank test. d, Baysean Information Criteria (BIC), used as a criterion for selection of multiple regression models that best predicted Ki67 (low BIC score produces a stronger model). e, Percentage of Ki67 expression in CD8 T cells (left) and tumour burden (right) stratified by BRAF status. All BRAF+ patients had been treated with BRAF-targeted therapy (n = 4, after removal of patients with unmeasurable tumour burden); Mann–Whitney U-test. f, Correlation of percentage Ki67+ versus lactate dehydrogenase (LDH) (left) and tumour burden versus LDH (right); Pearson’s correlation. g, Ki67 to LDH ratio stratified by landmark overall survival (overall survival starting from 6 weeks into therapy) (left; n = 23). Kaplan–Meier analysis stratified by a Ki67 to LDH ratio of 0.065 (right; Ki67 to LDH ratio: high, n =18; low, n = 5); log-rank test.
Extended Data Figure 10. T-cell reinvigoration in the context of tumour burden may more accurately reflect the immunobiology of anti-PD-1 patterns of resistance (red) and response (green).
Supplementary Material
Acknowledgments
We thank all the patients who contributed to this study. We thank all of the members of the Wherry laboratory for their contributions. This study was funded in part by NIH Grants R01 AI105343, P01 AI108545, U19 AI082630, and U19 AI117950 (E.J.W.); T32 2T32CA009615-26 (A.C.H.), P30-CA016520 (R.M.), P50-CA174523 (L.M.S., T.C.G, R.K.A., G.C.K., X.X., K.L.N., R.M., R.H.V.), P01CA114046 (X.X., R.K.A.), P30 CA008748 (K.S.P., D.K., J.D.W.), P01 CA114046 (K.L.N.), K08 AI114852 (R.S.H.), T32CA009140 (J.R.G.), Tara Miller Foundation (L.M.S., R.K.A., G.C.K., T.C.G., R.H.V., X.X.), German Research Foundation fellowship BE5496/1-1 (B.B.), Penn Department of Medicine Measey Research Fellowship Award (A.C.H.), NCATS KL2TR001879 (R.J.O.), Melanoma Research Alliance (K.L.N.), Robertson Foundation/Cancer Research Institute Irvington Fellowship (K.E.P.), Ludwig Center for Cancer Immunotherapy (P.W., M.A., J.D.W.), Swim Across America (J.D.W.), Conquer Cancer Foundation (M.A.P.), and funding from the Parker Institute for Cancer Immunotherapy (R.M., J.D.W., R.H.V., E.J.W.).
Footnotes
Supplementary Information is available in the online version of the paper.
Author Contributions A.C.H. and E.J.W. conceived and designed the overall studies. A.C.H. and T.C.G. designed and implemented the clinical trial at Penn and T.C.G. was principal investigator of this clinical trial. M.A.P., M.A., D.K., C.C., P.W. and J.D.W. designed, executed and performed immune assessment on the MSKCC trial and M.A.P. was principal investigator of this clinical trial. A.C.H. performed immune assessment assays with R.J.O., B.B., J.R.G., F.Q., K.E.P., R.S.H., R.P.S., S.K., J.M.S., and S.M.G. R.M. and K.S.P. performed biostatistical analyses. S.M. and J.R.G. performed computational analyses of immune profiling and RNA-seq. B. We., B. Wu., K.D’A. and K.L.N. performed mutational analysis and neoepitope prediction. W.X., S.H., and S.M. assisted in the Penn clinical trial. R.K.A., G.C.K. and L.M.S. were investigators on the trial. X.X. evaluated pathological biomarkers. A.C.H., R.H.V., T.C.G. and E.J.W. interpreted the data. A.C.H. and E.J.W. wrote the manuscript, and M.A.P., R.M., T.C.G. edited the manuscript. E.J.W. designed, interpreted, and oversaw the study.
The authors declare competing financial interests: details are available in the online version of the paper.
Readers are welcome to comment on the online version of the paper.
Publisher’s note: Springer Nature remains neutral with regard to jurisdictional claims in published maps and institutional affiliations.
Reviewer Information Nature thanks A. Alizadeh, V. Boussiotis and T. Tueting for their contribution to the peer review of this work.
References
- 1.Topalian SL, Taube JM, Anders RA, Pardoll DM. Mechanism-driven biomarkers to guide immune checkpoint blockade in cancer therapy. Nat Rev Cancer. 2016;16:275–287. doi: 10.1038/nrc.2016.36. [DOI] [PMC free article] [PubMed] [Google Scholar]
- 2.Fridman WH, Pagès F, Sautès-Fridman C, Galon J. The immune contexture in human tumours: impact on clinical outcome. Nat Rev Cancer. 2012;12:298–306. doi: 10.1038/nrc3245. [DOI] [PubMed] [Google Scholar]
- 3.Herbst RS, et al. Predictive correlates of response to the anti-PD-L1 antibody MPDL3280A in cancer patients. Nature. 2014;515:563–567. doi: 10.1038/nature14011. [DOI] [PMC free article] [PubMed] [Google Scholar]
- 4.Tumeh PC, et al. PD-1 blockade induces responses by inhibiting adaptive immune resistance. Nature. 2014;515:568–571. doi: 10.1038/nature13954. [DOI] [PMC free article] [PubMed] [Google Scholar]
- 5.Pauken KE, Wherry EJ. Overcoming T cell exhaustion in infection and cancer. Trends Immunol. 2015;36:265–276. doi: 10.1016/j.it.2015.02.008. [DOI] [PMC free article] [PubMed] [Google Scholar]
- 6.Barber DL, et al. Restoring function in exhausted CD8 T cells during chronic viral infection. Nature. 2006;439:682–687. doi: 10.1038/nature04444. [DOI] [PubMed] [Google Scholar]
- 7.Topalian SL, Drake CG, Pardoll DM. Immune checkpoint blockade: a common denominator approach to cancer therapy. Cancer Cell. 2015;27:450–461. doi: 10.1016/j.ccell.2015.03.001. [DOI] [PMC free article] [PubMed] [Google Scholar]
- 8.Robert C, et al. Pembrolizumab versus ipilimumab in advanced melanoma. N Engl J Med. 2015;372:2521–2532. doi: 10.1056/NEJMoa1503093. [DOI] [PubMed] [Google Scholar]
- 9.Ribas A, et al. Pembrolizumab versus investigator-choice chemotherapy for ipilimumab-refractory melanoma (KEYNOTE-002): a randomised, controlled, phase 2 trial. Lancet Oncol. 2015;16:908–918. doi: 10.1016/S1470-2045(15)00083-2. [DOI] [PMC free article] [PubMed] [Google Scholar]
- 10.Blackburn SD, et al. Coregulation of CD8+ T cell exhaustion by multiple inhibitory receptors during chronic viral infection. Nat Immunol. 2009;10:29–37. doi: 10.1038/ni.1679. [DOI] [PMC free article] [PubMed] [Google Scholar]
- 11.Twyman-Saint Victor C, et al. Radiation and dual checkpoint blockade activate non-redundant immune mechanisms in cancer. Nature. 2015;520:373–377. doi: 10.1038/nature14292. [DOI] [PMC free article] [PubMed] [Google Scholar]
- 12.Brahmer JR, et al. Phase I study of single-agent anti-programmed death-1 (MDX-1106) in refractory solid tumors: safety, clinical activity, pharmacodynamics, and immunologic correlates. J Clin Oncol. 2010;28:3167–3175. doi: 10.1200/JCO.2009.26.7609. [DOI] [PMC free article] [PubMed] [Google Scholar]
- 13.Paley MA, et al. Progenitor and terminal subsets of CD8+ T cells cooperate to contain chronic viral infection. Science. 2012;338:1220–1225. doi: 10.1126/science.1229620. [DOI] [PMC free article] [PubMed] [Google Scholar]
- 14.Im SJ, et al. Defining CD8+ T cells that provide the proliferative burst after PD-1 therapy. Nature. 2016;537:417–421. doi: 10.1038/nature19330. [DOI] [PMC free article] [PubMed] [Google Scholar]
- 15.He R, et al. Follicular CXCR5-expressing CD8+ T cells curtail chronic viral infection. Nature. 2016;537:412–416. doi: 10.1038/nature19317. [DOI] [PubMed] [Google Scholar]
- 16.Bengsch B, et al. Coexpression of PD-1, 2B4, CD160 and KLRG1 on exhausted HCV-specific CD8+ T cells is linked to antigen recognition and T cell differentiation. PLoS Pathog. 2010;6:e1000947. doi: 10.1371/journal.ppat.1000947. [DOI] [PMC free article] [PubMed] [Google Scholar]
- 17.Duraiswamy J, et al. Phenotype, function, and gene expression profiles of programmed death-1hi CD8 T cells in healthy human adults. J Immunol. 2011;186:4200–4212. doi: 10.4049/jimmunol.1001783. [DOI] [PMC free article] [PubMed] [Google Scholar]
- 18.Gupta PK, et al. CD39 expression identifies terminally exhausted CD8+ T cells. PLoS Pathog. 2015;11:e1005177. doi: 10.1371/journal.ppat.1005177. [DOI] [PMC free article] [PubMed] [Google Scholar]
- 19.Pauken KE, et al. Epigenetic stability of exhausted T cells limits durability of reinvigoration by PD-1 blockade. Science. 2016;354:1160–1165. doi: 10.1126/science.aaf2807. [DOI] [PMC free article] [PubMed] [Google Scholar]
- 20.Gros A, et al. Prospective identification of neoantigen-specific lymphocytes in the peripheral blood of melanoma patients. Nat Med. 2016;22:433–438. doi: 10.1038/nm.4051. [DOI] [PMC free article] [PubMed] [Google Scholar]
- 21.Miller JD, et al. Human effector and memory CD8+ T cell responses to smallpox and yellow fever vaccines. Immunity. 2008;28:710–722. doi: 10.1016/j.immuni.2008.02.020. [DOI] [PubMed] [Google Scholar]
- 22.Wherry EJ, Blattman JN, Murali-Krishna K, van der Most R, Ahmed R. Viral persistence alters CD8 T-cell immunodominance and tissue distribution and results in distinct stages of functional impairment. J Virol. 2003;77:4911–4927. doi: 10.1128/JVI.77.8.4911-4927.2003. [DOI] [PMC free article] [PubMed] [Google Scholar]
- 23.Wilmott JS, et al. Selective BRAF inhibitors induce marked T-cell infiltration into human metastatic melanoma. Clin Cancer Res. 2012;18:1386–1394. doi: 10.1158/1078-0432.CCR-11-2479. [DOI] [PubMed] [Google Scholar]
- 24.Knight DA, et al. Host immunity contributes to the anti-melanoma activity of BRAF inhibitors. J Clin Invest. 2013;123:1371–1381. doi: 10.1172/JCI66236. [DOI] [PMC free article] [PubMed] [Google Scholar] [Retracted]
- 25.Balch CM, et al. Final version of 2009 AJCC melanoma staging and classification. J Clin Oncol. 2009;27:6199–6206. doi: 10.1200/JCO.2009.23.4799. [DOI] [PMC free article] [PubMed] [Google Scholar]
- 26.Rizvi NA, et al. Cancer immunology. Mutational landscape determines sensitivity to PD-1 blockade in non-small cell lung cancer. Science. 2015;348:124–128. doi: 10.1126/science.aaa1348. [DOI] [PMC free article] [PubMed] [Google Scholar]
- 27.Sharma P, Allison JP. Immune checkpoint targeting in cancer therapy: toward combination strategies with curative potential. Cell. 2015;161:205–214. doi: 10.1016/j.cell.2015.03.030. [DOI] [PMC free article] [PubMed] [Google Scholar]
- 28.Smyth MJ, Ngiow SF, Ribas A, Teng MW. Combination cancer immunotherapies tailored to the tumour microenvironment. Nat Rev Clin Oncol. 2016;13:143–158. doi: 10.1038/nrclinonc.2015.209. [DOI] [PubMed] [Google Scholar]
- 29.Nishino M, et al. Developing a common language for tumor response to immunotherapy: immune-related response criteria using unidimensional measurements. Clin Cancer Res. 2013;19:3936–3943. doi: 10.1158/1078-0432.CCR-13-0895. [DOI] [PMC free article] [PubMed] [Google Scholar]
- 30.Wolchok JD, et al. Guidelines for the evaluation of immune therapy activity in solid tumors: immune-related response criteria. Clin Cancer Res. 2009;15:7412–7420. doi: 10.1158/1078-0432.CCR-09-1624. [DOI] [PubMed] [Google Scholar]
- 31.Breiman L. Random Forests. Mach Learn. 2001;45:5–32. [Google Scholar]
- 32.Qiu P, et al. Extracting a cellular hierarchy from high-dimensional cytometry data with SPADE. Nat Biotechnol. 2011;29:886–891. doi: 10.1038/nbt.1991. [DOI] [PMC free article] [PubMed] [Google Scholar]
Associated Data
This section collects any data citations, data availability statements, or supplementary materials included in this article.
Supplementary Materials
Data Availability Statement
RNA sequencing data that support the findings have been deposited in NCBI Gene Expression Omnibus and are accessible through GEO Series accession number GSE96578 (https://www.ncbi.nlm.nih.gov/geo/query/acc.cgi?acc=GSE96578). Flow cytometry, TCR sequencing, and clinical data are included in this published article and its Extended Data and Supplementary Information. All other relevant data are available from the corresponding author upon reasonable request.


