

Abstract
Objective. This study aimed to compare the accuracy of rectal cancer restaging after neoadjuvant therapy with 3D CUBE sequence with 2D T2-weighted fast spin-echo (FSE) sequence.
Methods. This retrospective study comprised 72 patients with rectal cancer confirmed by colonoscopy and biopsy. After neoadjuvant therapy, all patients underwent pelvic magnetic resonance imaging (MRI) examination at 1.5T MRI sequences including a single coronal 3D CUBE T2-weighted FSE sequence with 1.4 mm thickness and a 2D T2-weighted FSE sequence in the sagittal, coronal and axial planes with 5 mm thickness. The total acquisition time of the two sequences was recorded. Results were compared with postsurgical pathology (gold standard). The diagnostic accuracy was evaluated; and receiver operating characteristic (ROC) curves and the area under the curves (AUC) were calculated.
Results. The T category staging accuracy of 3D T2WI and 2D T2WI was 81.9% and 72.2%, respectively, for reviewer 1 and 86.1% and 75.0% for reviewer 2. The AUC of 3D was higher than that of 2D (0.878 vs. 0.783 for reader 1 and 0.905 vs. 0.796 for reader 2; both P < 0.05) when judging whether the tumor broke through the muscle layer. There was no significant difference between 3D and 2D in judging whether lymph nodes were malignant (AUC 0.719 vs. 0.698 for reader 1 and 0.740 vs. 0.698 for reader 2; both P > 0.05). There were no significant differences in the visibility of the rectal wall layer, tumor lesion and the overall image quality (all P > 0.05). Compared with 2D sequences, the 3D sequence had shorter acquisition time and higher signal intensity ratio (both P < 0.05).
Conclusion. 3D CUBE T2-weighted sequences offer better diagnostic accuracy in rectal cancer restaging after neoadjuvant therapy when compared with 2D T2-weighted FSE sequences; it has a shorter scanning time and more versatility of orientation reconstruction.
Keywords: rectal cancer, magnetic resonance imaging, 3D CUBE, neoadjuvant therapy, restaging, image quality
Introduction
Rectal cancer has recently become one of the leading causes of mortality, especially in developed countries [1]. Over last two decades, neoadjuvant chemoradiotherapy (CRT) before surgical operation combined with radical surgery has become the main treatment for local advanced rectal cancer (LARC) [2]. Careful staging of rectal tumor before surgery is very important for determining preoperative treatment aimed at reducing local failure and distant failure in high-risk patients. In rectal cancer staging, magnetic resonance imaging (MRI) has played a crucial role due to its superior soft-tissue contrast, high spatial resolution and multiplanar capability. MRI can also eliminate the risks of ionizing radiation and nephrotoxicity from iodinated contrast material [3]. MRI is often used to determine accurate staging before surgery after the end of a chemotherapy course. Accurate information about the invasion and degree of involvement of the tumor lesions and lymph nodes is crucial for optimal patient management [3]. As a basic sequence for rectal cancer MRI, high-spatial-resolution two-dimensional (2D) fast spin-echo (FSE) T2-weighted imaging (T2WI) has been used in most studies of rectal cancer MRI [4,5]. T2WI is one of the conventional programs of MRI that uses repeated 2D FSE sequences. This is commonly used to assess rectal cancer and includes the thin layer of high-resolution imaging of axial, sagittal and coronal images. Staging of rectal cancer after CRT often affects the termination of treatment [3,6]. The 2D FSE T2-weighted sequence performed in multiple planes traditionally plays a crucial role in clinical protocols for rectal cancer MRI [3, 7–10].
Three-dimensional (3D) FSE T2WI has traditionally been limited by usable echo train length, specific absorption rate (SAR) and long acquisition times. Fortunately, with the constant updating of equipment, new systems with faster imaging capabilities and fewer technical restraints are able to provide images with improved spatial resolution. Furthermore, the signal-to-noise ratio can support MRI 3D protocols. A 3D-based sequence can be used to collect data in an isotropic voxel format, which facilitates high-quality multiplanar reconstruction and display. This technique is beneficial for image analysis and may reduce image scanning time. 3D acquisitions also simplify the examination by removing the need for acquisition of additional 2D image planes in different directions [9].
Our hypothesis is that 3D T2WI will replace 2D T2WI when MRI technology has achieved improved in-plane resolution, higher T2 contrast and more sophisticated parameters. A relatively rapid 3D T2WI has been described previously and validated recently for specific pelvic applications such as endometriosis, cervical carcinoma [9], anorectal fistulas [10], prostate cancer [11] and rectal cancer [3, 12]. However, very few studies have reported rectal cancer staging, especially restaging after CRT.
The purpose of this study was to compare the accuracy of local-regional restaging using the 3D T2WI protocol and the conventional 2D T2WI protocol for the restaging of rectal cancer patients after CRT.
Materials and Methods
Patients
This retrospective study was approved by an institutional review board, and informed consent was waived. We reviewed 1.5T rectal MRIs taken between 1 June 2013 and 25 June 2014 in the six affiliated hospitals of Sun Yat-sen University (China), the pathology database and the medical records of 129 consecutive patients who underwent prospective MRIs including both 2D and 3D T2WI protocols. Patients with primary rectal cancer who had previously been treated with neoadjuvant therapy and underwent elective primary resection within one week of their staging MRI examination were eligible for the study. Patients were excluded if they did not undergo concurrent chemotherapy and radiation therapy before surgery (n = 30), did not undergo surgery (n = 24) or had pathologic findings during surgery indicating lesions other than adenocarcinoma (n = 3). Finally, there were 72 cases included in this study.
MRI protocols
MRIs were performed using a 1.5T imaging unit (Optima MR360, GE Medical Systems). Signal reception was obtained with a dedicated eight-channel phased-array surface coil wrapped around the posterior aspect of the patient to cover the entire pelvis. Rectal distention was performed prior to MRI. All patients underwent T2WI using both routine 2D and 3D protocols. First, sagittal 2D FSE T2WIs (TR/TE: 3807/120; field of view: 30; section thickness: 5 mm; gap: 0 mm; echo train length: 20; matrix: 288 × 224 and approximate time: 3 minutes and 11 seconds) were acquired and used to plan the axis of the oblique axial and oblique coronal images so that the images were oriented perpendicular or parallel to the long axis of the rectum bearing the cancer lesion. Then, multisection oblique axial 2D FSE T2WIs (TR/TE: 4320/120; field of view: 28; section thickness: 5 mm; gap: 1 mm; echo train length: 19; matrix: 320 × 224; approximate time: 4’11) and oblique coronal 2D FSE images (TR/TE: 3496/120; field of view: 28; section thickness: 5 mm; gap: 0 mm; echo train length: 18; matrix: 256 × 192; approximate time: 3’02) were obtained, respectively. Secondly, we utilized single-slab 3D CUBE FSE T2WI by using very long echo trains with variable refocusing flip angles (TR/TE: 2000/119.5; field of view: 30; section thickness: 1.4 mm; echo train length: 90; matrix: 256 × 512; approximate time: 6’33) to acquire an image dataset in the coronal orientation of the rectum. The datasets of the 3D CUBE were reconstructed using a GE workstation (Advantage Workstation 4.5, GE Healthcare) to generate 5 mm reformatted images in the axial, coronal and sagittal planes for the purpose of supporting real-time interactive multiplanar reconstruction by two imaging reviewers (respectively).
After acquisition of the T2WIs, axial FSE T1WIs (TR/TE: 341/min full; field of view: 28; section thickness: 5 mm; echo train length: 3; matrix: 320 × 224; approximate time: 2’50) were obtained for all patients. Contrast agent-enhanced LAVA Flex (TR/TE: 6.3/2.1; field of view: 36; section thickness: 4 mm; matrix: 320 × 224; approximate time: 1’35). T1WIs were also obtained for all of the patients, but these images were not used in our study. The total acquisition time was no more than 35 minutes in our MRI protocol.
Image analysis
Two gastrointestinal radiologists (with 3 and 5 years of experience in rectal MRI, respectively) reviewed the datasets (retrospectively) from the 2D T2WI and 3D T2WI. The reviewers were aware that the MRIs were from primary rectal cancer patients who had previously been treated with neoadjuvant therapy and later underwent elective resection of rectal cancer, but they were blinded to any further clinical or histopathologic information.
The 3D and 2D T2WI datasets were analyzed separately with at least a 4-week interval between analyses. For analysis of the 2D T2WI dataset, we reviewed the image series obtained in the sagittal, axial, oblique axial and oblique coronal planes displayed on our picture archiving and communication system (HINet PACS 5.0). The reconstructed 3D datasets were also assessed by each reviewer. The reviewers independently assessed the radiologic T categories of each rectal tumor. The T category staging criteria were as follows: T1(the tumor had higher signal intensity than the muscle layer and lower signal intensity than the surrounding submucosa on the T2WIs, and the tumor lesion was estimated to be confined to the submucosal layer); T2 (the tumor signal intensity extended to the muscularis propria, causing irregularity and/or thickening of the muscle layer, but there was no evidence of perirectal infiltration); T3 (the tumor extended through the muscular layer into the perirectal fat, or angiolymphatic tumor invasion was observed in the mesorectum) and T4 (the tumor extended beyond the rectal wall and invaded the adjacent organs and mesorectal fascia [13]. Rather than tumor size, we defined the criteria for lymph node metastasis as a node of any size with an indistinct border, irregular margin or mixed signal intensity as follows: N− (absence of suspected malignant nodal disease) and N + (presence of ≥ 1 lymph nodes suspected of being malignant. 2D T2 FSE and 3D CUBE images of typical cases are shown in Figures 1 and 2.
Figure 1.
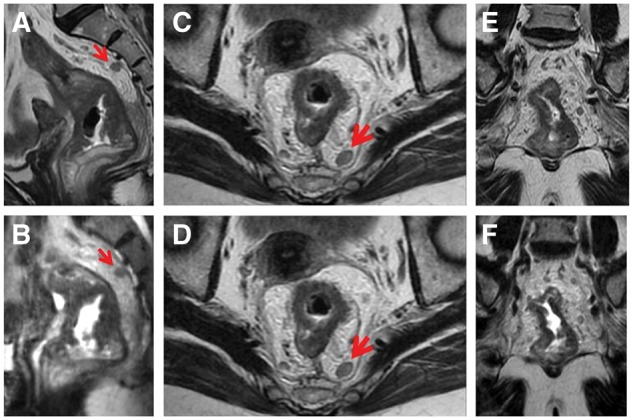
Oblique axial, oblique coronal and sagittal section of 2D T2-weighted FSE (A, C, E) and 3D CUBE (B, D, F) in a 61-year-old woman with rectal cancer after neoadjuvant therapy. The tumor of rectal wall and the lymph node in the mesorectum were well shown on multiple planes of 3D CUBE and 2D (the lymph node being represented by arrow). The mild invasion into mesorectal fat implied T3 stage, which was confirmed pathologically.
Figure 2.
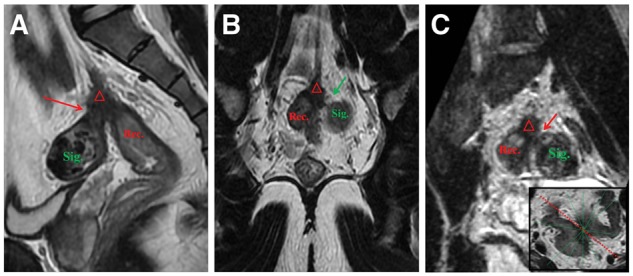
2D T2-weighted FSE and 3D CUBE in a 56-year-old man with rectal cancer after neoadjuvant therapy. (A) Sagittal 2D FSE image showed the boundary between the fibrosis lesion (△) including cancer tissue and the sigmoid colon (Sig.) was not clear. (B) The boundary between the rectum lesion and sigmoid colon were clear in coronal 2D image. (C) Multiple angles can be reconstructed in 3D images to make up the false appearance of figure A. 3D CUBE image after certain angle reconstruction showed the relationship of the fibrosis lesion (△) with the sigmoid colon (Sig.), which was still a special gap (arrow) that was confirmed pathologically.
The readers scored the quality characteristics for both 2D and 3D datasets from 20 cases’ images, which were selected randomly. The following parameters were assessed on a 5-point scale: visibility of rectal wall layer, visibility of tumor lesion, visibility of lymph node, visibility of mesorectal fat, and overall image quality and presence of artifacts. The 5-point scale was defined as: 1 (very poor), 2 (poor), 3 (adequate), 4 (good) and 5 (excellent). No specific criteria were used for each point on the scale. Tissue contrast analysis was performed using the ratio between the tumor and the adjacent normal muscle tissue (signal ratio intensity, SI) in operator-defined regions of interest (ROIs) in the tumor and the adjacent normal muscle tissue.
Histopathologic T and N staging
The extent of the local tumor staging was assessed according to tumor component of the TNM system: T1 (tumor invades submucosa), T2 (tumor invades muscularis propria), T3 (tumor invades through muscularis propria into subserosa or nonperitonealized pericolic or perirectal tissues) and T4 (tumor directly invades other organs or structures and/or perforates visceral peritoneum). Lymph node metastasis was judged to be tumor cells or tissue in the lymph nodes.
Statistical analysis
All statistical analyses were performed with SPSS 19.0 (SPSS Inc., Chicago, IL, USA). Interobserver agreement was analyzed by calculating the weighted κ value, which was classified as follows: κ value < 0.20 (poor agreement); 0.21–0.40 (fair agreement); 0.41–0.60 (moderate agreement); 0.61–0.80 (good agreement) and 0.81–1.00 (excellent agreement). A Wilcoxon signed-rank test was performed to compare the overall image quality between 2D and 3D MRI data. A paired t test was used to compare the results for ratio equals signal intensity and imaging acquisition time.
The T staging was reclassified as T0–2 and T3–4 to determine whether the tumor penetrated through the muscular rectal wall. We calculated the sensitivity, specificity, accuracy, positive predictive value and negative predictive value. Receiver operating characteristic (ROC) curves were used and the area under the curve (AUC) was calculated to show diagnostic performance between 3D and 2D protocols. The statistically significant differences in the AUC were calculated using the DeLong test.
Results
The final study population comprised 72 patients (mean age:56.4 years, range: 21–80 years; 42 males and 30 females). The tumor location was categorized according to the distance from the anal verge to the distal tumor mass surface measured by a preoperative colonoscopy, as within 7 cm (n = 46), and between 7.1 and 15 cm (n = 26).
T category staging
In 72 patients, the T category staging accuracy of 3D T2WI and 2D T2WI was 81.9% (59/72) and 72.2% (52/72), respectively, for reviewer 1 and 86.1% (62/72) and 75.0% (54/72) for reviewer 2. Reclassification of the T category stage was used to differentiate between T0–2 and T3–4 (Table 1). The ROC curves are presented in Figure 3 and indicate the results of MRI restaging using 3D and 2D T2-weighted datasets. The AUC of 3D was higher than that of 2D (0.878 vs. 0.783 for reader 1 (P = 0.005) and 0.905 vs. 0.796 for reader 2 (P = 0.008)) in judging whether the tumor broke through the muscle layer. The interobserver agreements of the MRI T category stage between the two reviewers were 0.739 for 3D and 0.671 for 2D.
Table 1.
The sensitivity, specificity and accuracy of 3D vs. 2D MRI in restaging T0–2 and T3–4 of rectal cancer
| Sequences | Reader 1 |
Reader 2 |
||
|---|---|---|---|---|
| pT0–2 | pT3–4 | pT0–2 | pT3–4 | |
| 3D T2-weighted FSE | ||||
| T0–2 | 28 | 0 | 30 | 0 |
| T3–4 | 9 | 35 | 7 | 35 |
| Sensitivity | 100% | 100% | ||
| Specificity | 75.7% | 81.1% | ||
| PPV | 79.5% | 83.3% | ||
| NPV | 100% | 100% | ||
| Accuracy | 87.5% | 90.3% | ||
| 2D T2-weighted FSE | ||||
| T0–2 | 22 | 1 | 24 | 2 |
| T3–4 | 15 | 34 | 13 | 33 |
| Sensitivity | 97.1% | 94.3% | ||
| Specificity | 59.5% | 64.9% | ||
| PPV | 69.4% | 71.7% | ||
| NPV | 95.7% | 92.3% | ||
| Accuracy | 77.8% | 79.2% | ||
FSE: fast spin-echo; PPV: positive predictive value; NPV: negative predictive value
Figure 3.
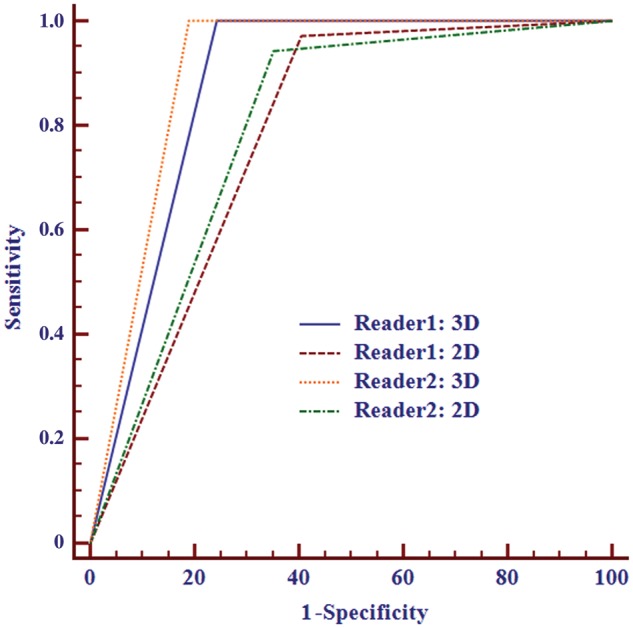
ROC curves of rectal cancer T restaging (T0–2/T3–4) using 3D and 2D datasets. The AUC of 3D was higher than that of 2D for both readers.
N category staging
The N category staging accuracy of 3D T2-weighted imaging and 2D T2-weighted imaging was 69.4% (50/72) and 68.1% (49/72), respectively, for reviewer 1 and 70.8% (51/72) and 68.1% (49/72) for reviewer 2 (Table 2). There was no significant difference between 3D and 2D in the AUC (0.719 vs. 0.698 for reader 1 (P = 0.569) and 0.740 vs. 0.698 for reader 2 (P = 0.148)) in judging whether lymph nodes were malignant (Figure 4). The interobserver agreements of the MRI N category stage between the two reviewers were 0.972 for 3D and 0.944 for 2D.
Table 2.
The sensitivity, specificity, and accuracy of MR 3D vs. 2D MRI in restaging N− and N+ of rectal cancer
| Sequences | Reader 1 |
Reader 2 |
||
|---|---|---|---|---|
| pN− | pN+ | pN− | pN+ | |
| 3D T2-weighted FSE | ||||
| N− | 31 | 5 | 31 | 4 |
| N+ | 17 | 19 | 17 | 20 |
| Sensitivity | 79.2% | 83.3% | ||
| Specificity | 64.6% | 64.6% | ||
| PPV | 52.8% | 54.1% | ||
| NPV | 86.1% | 88.6% | ||
| Accuracy | 69.4% | 70.8% | ||
| 2D T2-weighted FSE | ||||
| N− | 31 | 6 | 31 | 6 |
| N+ | 17 | 18 | 17 | 18 |
| Sensitivity | 75.0% | 75.0% | ||
| Specificity | 64.6% | 64.6% | ||
| PPV | 51.4% | 51.4% | ||
| NPV | 83.8% | 83.8% | ||
| Accuracy | 68.1% | 68.1% | ||
FSE: fast spin-echo; PPV: positive predictive value; NPV: negative predictive value
Figure 4.
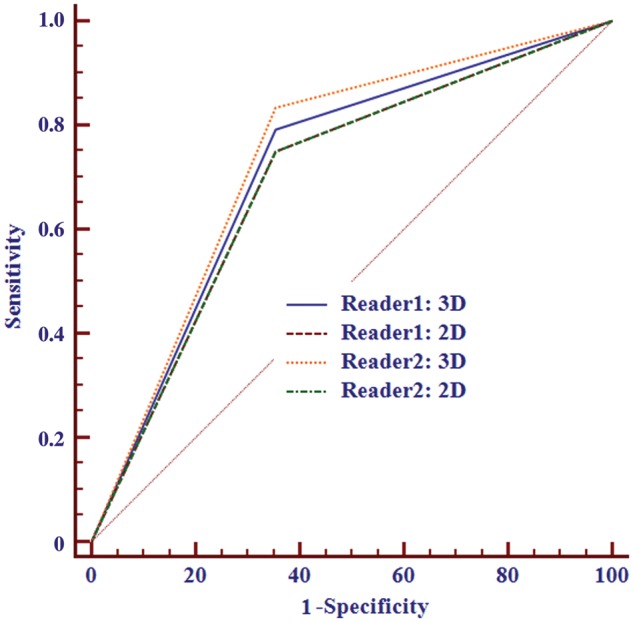
ROC curves of rectal cancer N restaging (N−/N+) using 3D and 2D datasets. No significant differences were found between the methods for both readers. The 2D line of both readers overlapped for the same AUC value.
Image quality
There were no significant differences in visibility of the rectal wall layer, tumor lesion and overall image quality between 3D CUBE and 2D protocol (all P > 0.05). However, the visibility of the lymph node from the 3D CUBE was not as good as the 2D imaging, and the 3D had more artifacts than the 2D imaging (all P < 0.05) (Table 3). The mean acquisition time of the 3D sequence was significantly shorter than that of the 2D sequences for three planes (384 ± 12.5 vs. 718 ± 10.6 seconds, P < 0.05). There was also significant difference in the signal intensity ratio between 3D CUBE and 2D protocol (reader 1: 2.277 ± 0.698 vs. 1.895 ± 0.585, P = 0.004; reader 2: 2.931 ± 0.919 vs. 2.144 ± 0.754, P <0.001).
Table 3.
Comparison of image quality between 3D and 2D MRI datasets as scored by two readers
| Characteristics | Reader 1 |
Reader 2 |
||||
|---|---|---|---|---|---|---|
| 3D | 2D | P value | 3D | 2D | P value | |
| Visibility of rectal wall layer | 3.6 | 3.6 | >0.99 | 3.6 | 3.6 | 0.763 |
| Visibility of tumor lesion | 3.8 | 3.9 | 0.705 | 4.0 | 4.0 | >0.99 |
| Visibility of lymph node | 2.7 | 3.7 | 0.001 | 2.7 | 3.6 | 0.001 |
| Visibility of mesorectal fat | 3.6 | 4.3 | 0.004 | 3.6 | 4.4 | 0.004 |
| Overall image quality | 3.5 | 3.5 | >0.99 | 3.5 | 3.5 | >0.99 |
| Presence of artifacts | 3.1 | 3.6 | 0.038 | 3.1 | 3.6 | 0.038 |
Discussion
In this current research, the 2D T2WI performed routinely for the three different planes and required approximately 13 minutes of total imaging time for each patient, whereas the single-slab 3D T2WI required < 7 minutes. The mean time of 3D sequence was significantly shorter than that of 2D. Users have reported saving up to 50–60% of time by using 3D T2WI. For example, a prostate cancer staging MRI performed by Rosenkrantz et al. demonstrated significant time savings with an acquisition time of 4 minutes in contrast to approximately 11 minutes for 3-plane 2D T2WI [11]. Similar time savings have been documented in rectal and endometrial cancer assessments [12,14]. In this current study, 3D CUBE also has advantages over 2D in terms of any orientation reconstruction, especially when positioning higher rectal cancer. 3D T2WI allows interactive reconstruction in any orientation with isotropic resolution—which can be obtained offline after the examination—improving examination efficiency and offering a useful tool [15]. In contrast, 2D T2WI does not allow retrospective postprocessing if coverage or imaging planes have been incorrectly prescribed.
In terms of the rectal wall layer, tumor lesion and overall image quality, there were no significant differences between 3D and 2D, although the 3D images revealed significantly more motion-related artifacts compared with the conventional 2D sequence. However, Kim et al. showed that tumor conspicuity was significantly higher for 2D TSE; there was no significant difference in overall image quality for artifacts [12]. There may be some reasons for the opposing results. Different equipment and sequencing may lead to different results. First, the longer acquisition time of FSE by 1.5T MR could be a contributing factor for these artifacts in our research compared with the 3.0T MR in the past report. B1 inhomogeneity causes substantial variations of the flip angle across the field of view with the 3D T2 FSE, particularly at 3.0T, which can lead to significant variations in signal-to-noise ratio and degrade image contrast and diagnostic quality as reported for the sequence applied to the noncontrast MR angiography [16]. A technique for minimizing artifacts from B1 heterogeneity is to use a radiofrequency cushion [17]. Ongoing technological improvements may eventually further reduce negative effects of this artifact on 3D T2 MRI by radiofrequency pulse optimization including parallel transmission [18]. SAR limits/radiofrequency deposition 3D T2WI has a potential benefit at 3.0T because it imparts lower radiofrequency deposition for lower SAR. Secondly, more motion-related artifacts were also reported for 3D T2WI, which were likely related to longer acquisition time and bowel movement [12].
In our study, the diagnostic accuracy in T restaging after CRT of 3D CUBE was higher than that of 2D, which was not consistent with the literature. Kim et al. showed that there were no significant differences in T staging (64.5% for 2D vs. 62% for 3D) [12]. The tumors shrank and were downgraded after CRT. Diagnosis was based on the presence of tumor extending into the perirectal fat with broad-based bulging configuration and in continuity with the intramural portion of the tumor. In this paper, it may be more favorable to identify subtle signs of intestinal wall protrusion of tumor due to 3D CUBE multiorientation reconstruction. There was, however, low accuracy of staging after long-course CRT before surgery as we were unable to reliably differentiate an active tumor from posttreatment fibrosis [19]. This assertion was supported by Shia et al., who in a pathologic study showed that the morphologic patterns of the rectum after long-course CRT were quite distinct from the patterns after short-course CRT [20]. Reports showed considerable difficulty reliably differentiating an active tumor from posttreatment fibrosis after long-course CRT; tumor staging accuracy was only 47–52% [21,22]. Differentiating fibrosis and mucinous degeneration from active disease is difficult with morphologic imaging. It may be possible to use functional techniques such as dynamic MRI and DWI to differentiate fibrosis from an active tumor during imaging at a high spatial resolution [23,24].
As detailed in N staging, there were no significant differences between 3D and 2D. There was no difference in the judgment with and without lymph node metastases after CRT. According to previous reports in the literature, fewer nodes were found after CRT, and the morphology of lymph-node staging accuracy after CRT was not high [19,25]. An MRI identifying the number and location of the lymph nodes is the most helpful tool and may also be used to provide a road map for showing surgeons areas where lymphadenectomy is likely to be carried out. Only T2 sequences were included in the study, and MR lymphography with ultra-small paramagnetic iron oxide (OSPIO) may likely be helpful for judging benign and malignant lymph nodes [26].
The study had a few limitations. Firstly, the study reveals that T staging had only been reported by T2WI sequence without any others such as T1WI, enhanced sequence and DWI. Some studies reported that DWI combined with a conventional T2WI sequence may increase the accuracy of judgment in patients with compete response. As a new technology of magnetic resonance, DWI can provide the motion information of macromolecules, especially tumor tissue, which usually present a higher signal than that of fibrotic tissue. Secondly, the reviewers in past reports were aware of whether they were assessing the 2D or 3D data because the latter require interactive multiplanar reconstruction. This factor might have caused some bias, especially with respect to perception of the degree of tumor conspicuity and image artifact. In our research, the third worker implemented reconstruction by 3D data according to the conventional 2D sequence. However, it may lead to a reduction in the multidimensional freedom of judgment of staging by 3D CUBE. Thirdly, the main limitation was that 3D CUBE of this study was performed using 1.5T MR, the 3D technology of which may bring more artifacts than that of 3.0T MR. In future studies, we will gradually try to apply 3D CUBE in 3.0T magnetic resonance.
To conclude, 3D CUBE T2-weighted FSE offers higher diagnostic accuracy in rectal cancer restaging after CRT compared with 2D T2-weighted FSE sequences. Additionally, 3D CUBE has advantages over 2D in terms of quicker scanning time and versatility of orientation reconstruction.
Funding
This study was supported by grants from the Guangdong Science and Technology Department of China (No.2015A030313109).
Conflict of interest statement: none declared.
References
- 1. Kapiteijn E, Putter H, van de Velde CJ.. Impact of the introduction and training of total mesorectal excision on recurrence and survival in rectal cancer in The Netherlands. Br J Surg 2002;89:1142–9. [DOI] [PubMed] [Google Scholar]
- 2. Sauer R, Liersch T, Merkel S, et al. Preoperative versus postoperative chemoradiotherapy for locally advanced rectal cancer: results of the German CAO/ARO/AIO-94 randomized phase III trial after a median follow-up of 11 years. J Clin Oncol 2012;30:1926–33. [DOI] [PubMed] [Google Scholar]
- 3. Futterer JJ, Yakar D, Strijk SP, et al. Preoperative 3T MR imaging of rectal cancer: local staging accuracy using a two-dimensional and three-dimensional T2-weighted turbo spin echo sequence. Eur J Radiol 2008;65:66–71. [DOI] [PubMed] [Google Scholar]
- 4. Zhang XM, Zhang HL, Yu D, et al. 3-T MRI of rectal carcinoma: preoperative diagnosis, staging, and planning of sphincter-sparing surgery. AJR Am J Roentgenol 2008;190:1271–8. [DOI] [PubMed] [Google Scholar]
- 5. Wallengren NO, Holtas S, Andren-Sandberg A, et al. Rectal carcinoma: double-contrast MR imaging for preoperative staging. Radiology 2000;215:108–14. [DOI] [PubMed] [Google Scholar]
- 6. Kim SH, Lee JM, Lee MW, et al. Diagnostic accuracy of 3.0-Tesla rectal magnetic resonance imaging in preoperative local staging of primary rectal cancer. Invest Radiol 2008;43:587–93. [DOI] [PubMed] [Google Scholar]
- 7. Battersby NJ, Moran B, Yu S, et al. MR imaging for rectal cancer: the role in staging the primary and response to neoadjuvant therapy. Expert Rev Gastroenterol Hepatol 2014;8:703–19. [DOI] [PubMed] [Google Scholar]
- 8. Shihab OC, Moran BJ, Heald RJ, et al. MRI staging of low rectal cancer. Eur Radiol 2009;19:643–50. [DOI] [PubMed] [Google Scholar]
- 9. Shin YR, Rha SE, Choi BG, et al. Uterine cervical carcinoma: a comparison of two- and three-dimensional T2-weighted turbo spin-echo MR imaging at 3.0 T for image quality and local-regional staging. Eur Radiol 2013;23:1150–7. [DOI] [PubMed] [Google Scholar]
- 10. de Miguel CJ, Del SL, Rivas PF, et al. MR imaging evaluation of perianal fistulas: spectrum of imaging features. Radiographics 2012;32:175–94. [DOI] [PubMed] [Google Scholar]
- 11. Rosenkrantz AB, Neil J, Kong X, et al. Prostate cancer: Comparison of 3D T2-weighted with conventional 2D T2-weighted imaging for image quality and tumor detection. AJR Am J Roentgenol 2010;194:446–52. [DOI] [PubMed] [Google Scholar]
- 12. Kim H, Lim JS, Choi JY, et al. Rectal cancer: comparison of accuracy of local-regional staging with two- and three-dimensional preoperative 3-T MR imaging. Radiology 2010;254:485–92. [DOI] [PubMed] [Google Scholar]
- 13. Beets-Tan RG, Beets GL.. Rectal cancer: review with emphasis on MR imaging. Radiology 2004;232:335–46. [DOI] [PubMed] [Google Scholar]
- 14. Hori M, Kim T, Onishi H, et al. Uterine tumors: comparison of 3D versus 2D T2-weighted turbo spin-echo MR imaging at 3.0 T--initial experience. Radiology 2011;258:154–63. [DOI] [PubMed] [Google Scholar]
- 15. Proscia N, Jaffe TA, Neville AM, et al. MRI of the pelvis in women: 3D versus 2D T2-weighted technique. AJR Am J Roentgenol 2010;195:254–9. [DOI] [PubMed] [Google Scholar]
- 16. Lim KK, Noe G, Hornsey E, et al. Clinical applications of 3D T2-weighted MRI in pelvic imaging. Abdom Imaging 2014;39:1052–62. [DOI] [PubMed] [Google Scholar]
- 17. Franklin KM, Dale BM, Merkle EM.. Improvement in B1-inhomogeneity artifacts in the abdomen at 3T MR imaging using a radiofrequency cushion. J Magn Reson Imaging 2008;27:1443–7. [DOI] [PubMed] [Google Scholar]
- 18. Park J, Mugler JR, Hughes T.. Reduction of B1 sensitivity in selective single-slab 3D turbo spin echo imaging with very long echo trains. Magn Reson Med 2009;62:1060–6. [DOI] [PubMed] [Google Scholar]
- 19. Allen SD, Padhani AR, Dzik-Jurasz AS, et al. Rectal carcinoma: MRI with histologic correlation before and after chemoradiation therapy. AJR Am J Roentgenol 2007;188:442–51. [DOI] [PubMed] [Google Scholar]
- 20. Shia J, Guillem JG, Moore HG, et al. Patterns of morphologic alteration in residual rectal carcinoma following preoperative chemoradiation and their association with long-term outcome. Am J Surg Pathol 2004;28:215–23. [DOI] [PubMed] [Google Scholar]
- 21. Chen CC, Lee RC, Lin JK, et al. How accurate is magnetic resonance imaging in restaging rectal cancer in patients receiving preoperative combined chemoradiotherapy? Dis Colon Rectum 2005;48:722–8. [DOI] [PubMed] [Google Scholar]
- 22. Kuo LJ, Chern MC, Tsou MH, et al. Interpretation of magnetic resonance imaging for locally advanced rectal carcinoma after preoperative chemoradiation therapy. Dis Colon Rectum 2005;48:23–8. [DOI] [PubMed] [Google Scholar]
- 23. Sun YS, Zhang XP, Tang L, et al. Locally advanced rectal carcinoma treated with preoperative chemotherapy and radiation therapy: preliminary analysis of diffusion-weighted MR imaging for early detection of tumor histopathologic downstaging. Radiology 2010;254:170–8. [DOI] [PubMed] [Google Scholar]
- 24. Kim SH, Lee JY, Lee JM, et al. Apparent diffusion coefficient for evaluating tumour response to neoadjuvant chemoradiation therapy for locally advanced rectal cancer. Eur Radiol 2011;21:987–95. [DOI] [PubMed] [Google Scholar]
- 25. Brown G, Richards CJ, Bourne MW, et al. Morphologic predictors of lymph node status in rectal cancer with use of high-spatial-resolution MR imaging with histopathologic comparison. Radiology 2003;227:371–7. [DOI] [PubMed] [Google Scholar]
- 26. Koh DM, Brown G, Temple L, et al. Rectal cancer: mesorectal lymph nodes at MR imaging with USPIO versus histopathologic findings--initial observations. Radiology 2004;231:91–9. [DOI] [PubMed] [Google Scholar]