

Abstract
Retinoid X receptor (RXR) has been targeted for the chemoprevention and treatment of cancer. To discover potential agents acting through RXRs, we utilized an RXR response element-luciferase reporter gene assay. Following extensive screening, 3-amino-6-(3-aminopropyl)-5,6-dihydro-5,11-dioxo-11H-indeno[1,2-c]isoquinoline dihydrochloride (AM6-36) was found to induce RXRE-luciferase activities. AM6-36 inhibited cyclooxygenase-2 expression and anchorage-independent growth with 12-O-tetradecanoylphorbol 13-acetate-stimulated JB6 Cl41 cells, induced the expression of CD38 in HL-60 cells, and attenuated the growth of N-methyl-N-nitrosourea-induced mammary tumors in rats. Consistent with other reports describing the anti-proliferative effects of RXR agonists in breast cancers, AM6-36 showed growth inhibition with cultured MCF7 breast cancer cells, accompanied by G2/M phase arrest at lower concentrations and enhanced S phase arrest at higher concentrations. Based on DNA microarray analysis, AM6-36 up-regulated the expression of CDKN1A, a target gene of RXR, by 35-fold. In accord with this response, the expression of the corresponding protein, p21WAF1/CIP1, was increased in the presence of AM6-36. Induction of p21 by AM6-36 was abrogated following transient knock-down of RXRα, demonstrating the effect of AM6-36 on the expression of p21 is closely related to modulation of RXRα transcriptional activity. Intestinal permeability was suggested with Caco-2 cells, and limited metabolism resulted when AM6-36 was incubated with human liver microsomes. Oral administration with rats resulted in 0.8 μg/ml, 4.3 μg/g, and 0.3 μg/g in serum, liver, and mammary gland, respectively. In sum, these data suggest AM6-36 is a promising lead for the treatment or prevention of breast cancer and provide a strong rationale for testing in more advanced anti-tumor systems.
Keywords: Retinoid X receptor, indenoisoquinoline, p21WAF1/CIP1, MCF7 breast cancer cells
Introduction
Retinoid X receptor (RXR), a member of the nuclear receptor superfamilies, was identified as an orphan receptor with a high sequence homology to retinoic acid receptor (RAR), and a specific responsiveness to vitamin A metabolites (1). Three subtypes of RXRs, RXRα, RXRβ and RXRγ, have been identified, and essential roles of RXRs have been reported in various physiological processes including embryonic development, metabolic processes, differentiation and apoptosis. Similar to other nuclear receptors, RXRs require specific ligands to be functionally activated. While ligand-free RXRs are sequestered by specific nuclear receptor co-repressors, on ligand binding, RXRs undergo conformational changes, leading to the dissociation of co-repressors and the association of co-activators (2). Consequently, ligand-activated RXR dimers recognize the corresponding cis-acting element in the promoter region of target genes, called hormone response elements (HREs), and are capable of triggering transcription. HREs consist of two direct repeats (DRs) of the consensus hexamers (AGGTCA) in tandem, separated by one to five nucleotides, which are designated as DR1 to DR5, respectively. In particular, RXR homodimers are known to interact with DR1, RXR response element (RXRE) (3).
As mentioned above, specific ligands for RXRs generally play key roles in the activation of RXR signaling, and several substances are known to function as endogenous ligands, including 9-cis-retinoic acid (9-cis-RA), docosahexaenoic acid, and other unsaturated fatty acids (4). Besides putative endogenous ligands of RXRs, additional compounds have been reported as RXR agonists, so-called rexinoids, including AGN194204, CD3254, LG100268, LGD1069, and SR11237. Although the mechanisms underlying their suppressive and inhibitory actions against cancerous processes have not been fully clarified, both naturally occurring and synthetic rexinoids have shown promise in the prevention and treatment of cancer (5). For example, 9-cis-RA, LG100268, and LGD1069 have shown efficacy in N-methyl-N-nitrosourea (MNU)-induced breast cancer animal models (6–8). Further, 9-cis-RA and LGD1069 have been approved by FDA for the treatment of Kaposi’s sarcoma and cutaneous T cell lymphoma, respectively (9,10).
In searching for novel cancer chemopreventive and therapeutic agents capable of functioning as RXR agonists, we utilized a RXRE-luciferase reporter gene assay. This assay assesses RXR transcriptional activity as well as binding to RXR, since trans-activation occurs only after ligand binding. During the course of testing over 5,000 natural product extracts and compounds, only a single active lead was identified: 3-amino-6-(3-aminopropyl)-5,6-dihydro-5,11-dioxo-11H-indeno[1,2-c]isoquinoline dihydrochloride (AM6-36; Fig. 1). Based on the unexpected yet unique ability of AM6-36 to serve as an RXR agonist, 18 structural relatives were tested, but AM6-36 still demonstrated the greatest activity.
Figure 1.
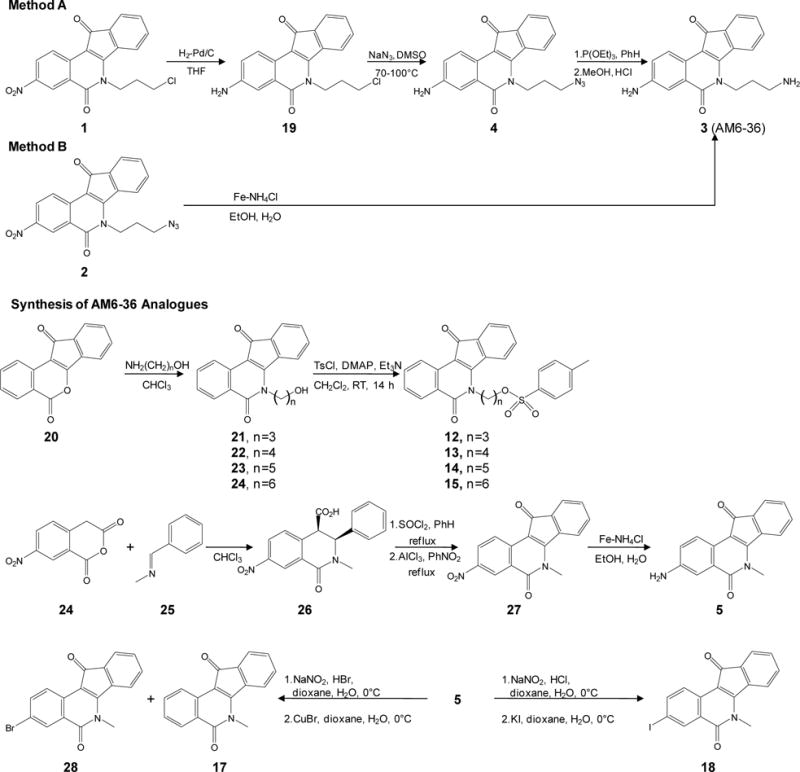
Synthesis of AM6-36 and structurally-related indenoisoquinolines.
Using MCF7 breast cancer cells as a model, AM6-36 was found to suppress proliferation and this was accompanied with cell cycle arrest. RXRα transcriptional activity was up-regulated with subsequent expression of RXR target gene CDKN1A. Moderate absorption and slow metabolism was demonstrated. Strong indications of cancer chemopreventive potential were observed with HL-60 cells, 12-O-tetradecanoylphorbol 13-acetate (TPA)-treated JB6 Cl41 cells, and rats bearing mammary tumors. Finally, a synthetic procedure for large-scale production is reported that will enable additional anti-tumor evaluations.
Materials and Methods
Reagents
9-cis-Retinoic acid (9-cis-RA), 12-O-tetradecanoylphorbol 13-acetate (TPA), trichloroacetic acid (TCA), sulforhodamine B (SRB), paraformaldehyde, IgG1-FITC isotype control from murine myeloma, and 7-hydroxystaurosporine (UCN-01) were purchased from Sigma-Aldrich, Inc. (St. Louis, MO). Bexarotene was purchased from LC Laboratories (Woburn, MA). The translucent reporter vector carrying firefly luciferase under the control of RXRE (5′-AGGTCACAGGTCACAGGTCACAGGTCACAGGTCA-3′) (pRXRE) was purchased from Panomics (Fremont, CA). pBABE-puro vector encoding the cDNA for human RXRα (phRXRα) was purchased from Addgene Inc. (Cambridge, MA). Renilla reniformis luciferase vector (pRL) and Dual-Luciferase® Reporter Assay System were purchased from Promega (Madison, WI). Dulbecco’s modified Eagle’s medium (DMEM), Eagle’s minimal essential medium (MEM), fetal bovine serum (FBS), and antibiotics-antimycotics solution (100×), Lipofectamine™ 2000, and Trizol® reagent were purchased from Invitrogen™ (Carlsbad, CA). Fluorescein isothiocyanate (FITC)-conjugated CD38 antibody (anti-CD38-FITC), and nuclear isolation medium-4′,6-diamidino-2-phenylindole (NIM-DAPI) was purchased from Beckman Coulter, Inc. (Fullerton, CA). Rabbit polyclonal anti-RXRα antibody, mouse monoclonal anti-p21WAF1/CIP1 (p21) antibody, mouse monoclonal anti-p53 antibody, human RXRα siRNA, human p53 siRNA, human p21 siRNA, and control siRNA-A were purchased from Santa Cruz Biotechnology (Santa Cruz, CA). Rabbit polyclonal anti-β-actin, rabbit polyclonal anti-cyclooxygenase-2 (COX-2), Cell Lysis Buffer (10×), and LumiGLO® chemiluminescent detection kit were from Cell Signaling Biotechnology (Danvers, MA). RT2 First Strand Kit (C-03), and RT2 Profiler™ PCR Array related to human cell cycle were purchased from SABiosciences™ (Frederick, MD). Cell transformation detection assay kit was purchased from Millipore (Billerica, MA).
Synthesis of indenoisoquinolines
As outlined in Fig. 1, scalable conditions were developed for the preparation of AM6-36 (compound 3) and related indenoisoquinolines. Azidopropyl indenoisoquinoline 2 was obtained following previously described procedures (11,12). We have previously prepared AM6-36 on small scale from compound 1 according to Method A. However, this method was found impractical for the preparation of multi-gram quantities of the target compound. Therefore, an alternative approach for the reduction compound 2 or conversion of compound 1 to the desired amount of AM6-36 was necessary. After a series of attempts to reduce compound 2 to 3 stepwise or both functional groups simultaneously using various conditions, the reduction with iron powder in the presence of ammonium chloride solution was found to be the best method (Method B). Tosylated analogs of AM6-36 12–15 were prepared by treatment of the corresponding alkoxy derivatives with 4-toluenesulfonyl chloride in dichloromethane in the presence of 4-dimethylaminopyridine and triethylamine. Compound 5 was prepared by condensation of 7-nitrohomophthalic anhydride with N-benzylidenemethylamine, followed by treatment of the product with thionyl chloride, intramolecular Friedel-Crafts reaction, and reduction of the nitro group (11). Compounds 17 and 18 were obtained as the products of Sandmeyer reaction of 5. Compounds 6–11 and 21 were prepared as previously described (11–13,14,15). Melting points were determined using capillary tubes with a Mel-Temp apparatus and are uncorrected. Proton nuclear magnetic resonance (1H NMR) spectra were recorded using ARX300 300 MHz and DRX500 500 MHz Bruker NMR spectrometers. IR spectra were recorded using a Perkin-Elmer 1600 series FTIR spectrometer. Combustion microanalyses were performed at the Purdue University Microanalysis Laboratory and the reported values were within 0.4% of the calculated values. HPLC analyses were performed on a Waters 1525 binary HPLC pump/Waters 2487 dual λ absorbance detector system. Analytical thin-layer chromatography was carried out on Baker-flex silica gel IB2-F plates and compounds were visualized with short-wavelength UV light. Silica gel flash chromatography was performed using 230–400 mesh silica gel. Physical and spectral data are reported as Supplementary Method S1.
Cell culture
All cell lines were grown in media supplemented with penicillin G (100 units/ml), streptomycin (100 mg/ml), and heat inactivated FBS at 37°C in 5% CO2 in a humidified incubator. COS-1 African green monkey kidney fibroblast cells and MCF7 human breast cancer cells were maintained in DMEM containing 10% FBS. JB6 Cl41 mouse epidermal cells were grown in MEM containing 5% FBS. HL-60 human promyelocytic leukemia cells were grown in RPMI 1640 supplemented with 10% FBS. These cell lines were obtained from the ATCC (Manassas, Virginia). Stock cultures were prepared and aliquots were stored in liquid nitrogen. During the course of the study, cells were used below a passage number of 20, and no significant changes were noted in morphology or growth characteristics. The cell lines were not authenticated by the authors.
RXRE-luciferase reporter gene assay (RXRE assay)
COS-1 cells (1 × 10⁴ cells/well) were plated in a 96-well culture plate and incubated for 24 h. Then, 100 ng of pRXRE, 50 ng of phRXRα and 3 ng of pRL were transiently co-transfected into COS-1 cells in each well by using Lipofectamine™ 2000 according to the manufacturer’s protocol. After 24 h of transfection, cells were treated with compounds and further incubated for 24 h. Cells were then lysed and the RXRE transcriptional activities were determined by measuring the reporter luciferase activities using Dual-Luciferase® Reporter Assay System.
Evaluation of anti-proliferative potential
MCF7 cells (1 × 10⁴ cells/well) were seeded in 96-well plates and incubated with compounds at 37°C in a humidified atmosphere with 5% CO2 for 24, 48, and 72 h. After the incubation, cell viability was estimated by the SRB cellular protein-staining method as previously described (16).
Analysis of cell cycle distribution
Cell cycle distribution was assessed by staining DNA content with NIM-DAPI solution according to the manufacturer’s instructions. Briefly, the media was discarded from MCF7 cells after 24, 48, and 72 h of incubation with various concentrations of AM6-36. Cells were harvested and stained with NIM-DAPI solution just before the measurement using Cell Lab Quanta™ SC flow cytometer (Beckman Coulter) (17).
Evaluation of protein expression
Cells were lysed by using 1× cell lysis buffer diluted from 10× cell lysis buffer according to the manufacturer’s protocol. Cell lysates were centrifuged at 14,000 xg for 10 min at 4°C and the resultant supernatants were collected and stored at −80°C until use. After quantification of protein by the Bradford method (18), equal amounts of total protein in each cell lysate were resolved using 12% SDS-PAGE, and electrotransferred to PVDF membranes. The membranes were incubated with 5% skimmed milk in 0.1% Tween 20 containing TBS (TBST) for 1 h at room temperature to block non-specific protein binding. Then, membranes were incubated overnight at 4°C with corresponding primary antibodies in 3% skimmed milk in TBS followed by the incubation with horse radish peroxidase (HRP)-conjugated secondary antibodies, and visualization using LumiGLO® chemiluminescent detection kit under Geliance 1000 imager (Perkin Elmer, Inc., Waltham, MA).
Profile of altered gene expression
Total RNA was extracted from cells using Trizol® reagent according to the method of Chomczynski and Sacchi (19). Isolated RNA was dissolved in RNase-free water and the quality and quantity were measured using a NanoDrop ND-1000 spectrophotometer (Thermo Fisher Scientific Inc., Wilmington, DE). Total RNA (1 μg) was incubated with genomic DNA elimination mixture at 42°C for 5 min followed by reverse transcription to cDNA under the condition of 42°C for 15 min and 95°C for 5 min using RT2 First Strand Kit (C-03) on a ABI 7300 thermocycler (Applied Biosystems Inc., Foster City, CA). cDNA was applied to RT2 Profiler™ PCR Array related to human cell cycle according to a manufacturer’s instructions. Samples were run in quadruplicate to ensure amplification integrity. The expression levels of 84 cell cycle-related genes in cDNA of each sample were analyzed (20).
Small interfering RNA (siRNA) transient transfection
MCF7 cells were plated at 10 × 104 cells per well in 6-well culture plates and incubated for 24 h. Cells in each well were transfected with 50 pmol of human RXRα siRNA, human p53 siRNA, human p21 siRNA, or control siRNA-A using Lipofectamine™ 2000 for 24 h followed by sample treatment for additional 24 h. To examine the expression of RXRα and p21, Western blot analysis was performed as described above.
Expression of cyclooxygenase-2 (COX-2) in TPA-treated JB6 Cl41 cells
JB6 Cl41 cells were seeded in 6-well plates (2 × 10⁵ cells/well) and incubated at 37°C in a humidified atmosphere with 5% CO2 for 24 h. After incubation, cells were exposed to TPA (10 ng/mL) with vehicle (0.1% DMSO) alone or various concentrations of AM6-36. After 15 h of further incubation, protein of each well was extracted and subjected to Western blot analysis as described above (Evaluation of protein expression).
Anchorage-independent cell transformation
The effect of AM6-36 on TPA-induced neoplastic transformation was investigated with JB6 Cl41 cells cultivated in soft agar according to the manufacturer’s protocol. Briefly, 500 exponentially growing cells were suspended in 50 μl 0.4% agar complete MEM medium over 100 μl 0.8% agar complete MEM medium in a 96-well plate. Cells were exposed to 5 nM TPA, with or without AM6-36, at 37°C in a humidified atmosphere with 5% CO2 for 28 days. After incubation, cell quantification solution was added to each well and further incubated at 37°C for 4 h. TPA-treated control wells turned to burgundy-brown. The absorbance was measured at 490 nm and data were expressed as % transformation activity relative to TPA-treated control.
Expression of cell surface marker, CD38
HL-60 cells (2 × 10⁵ cells/well) were seeded in 12-well plates and incubated with samples at 37°C in a humidified atmosphere with 5% CO2 for 24 h. Following the manufacturer’s instructions, cells were harvested and centrifuged at 300 xg for 5 min, then washed with PBS once. Cells were incubated with anti-CD38-FITC for 30 min in the dark. Similarly, autofluorescence control (cells only) and negative staining control (cells + FITC-conjugated, isotype-matched non-specific mouse immunoglobulin) were prepared. After the incubation, cells were washed with diluents and centrifuge at 500 xg for 10 min. Precipitated cells were fixed with 2% cold paraformaldehyde solution and analyzed by flow cytometry.
Metabolism of AM-6-36 by human liver microsomes
The metabolic stability of AM6-36 was determined using human liver microsomes. Incubations were performed with pooled human liver microsomes containing 0.5 mg/ml of microsomal protein, 10 or 50 μM AM6-36, and 1 mM NADPH in 50 mM phosphate buffer (pH 7.4), in a total volume of 0.4 ml. The reactions were initiated by addition of NADPH and, after a 5 min preincubation, were performed at 37°C for 40 min. The incubations were terminated by adding 1.6 ml of an ice-cold mixture of acetonitrile-ethanol (1:1, v/v) and processed high resolution LC-MS and LC-MS-MS analysis as described previously (21).
Determination of intestinal epithelial monolayer permeability
To evaluate the absorption of AM6-36 in intestinal epithelial cells, a Caco-2 cell monolayer assay was performed. In preparation for the Caco-2 cell monolayer assays, the cell culture medium was removed from both the apical (AP) and basolateral (BL) chambers. The cells were washed three-times and pre-incubated with HBSS containing 25 mM HEPES, pH 7.4, for 30 min at 37°C on a shaker bath at 50 rpm. A 20 mM stock solution of AM6-36 in dimethylsulfoxide (DMSO) was diluted to different concentrations in HBSS/HEPES buffer (the final concentration of DMSO was less than 1%). These test solutions containing AM6-36 were added to either the apical chambers (for AP→BL measurement) or the basolateral chambers (for BL→AP assay), and blank HBSS/HEPES buffer was added to the other side. As a test of the integrity of the monolayer and as a marker of low permeability, sucrose (50 μM final concentration) was added to the apical chambers. Propranolol (10 μM final concentration) was also added as a marker for compounds that are highly permeable. The total volumes of solution in the apical and basolateral chambers were 1.5 and 2.6 ml, respectively. The solutions in the recipient compartments were removed and replaced with fresh medium. The samples were stored at −20°C until analysis of AM6-36 by LC-MS-MS as described below for the analysis of extracts of serum and tissue. At the end of each experiment, basolateral samples were also analyzed by LC-MS for sucrose and propranolol. The apparent permeability coefficients (Papp, ×10−6 cm/sec ± S.D.) were then calculated. The Papp of sucrose from the apical to the basolateral side of each well was also measured and remained acceptably low at 0.16×10⁻⁶ cm/sec (22).
Evaluation of absorption and distribution in rats
A preliminary evaluation was performed to assess the absorption and distribution of AM6-36. Female Sprague-Dawley rats were obtained at 4-weeks-of-age (Harlan, Inc.; virus-free colony 202A) and placed on Teklad diet. At 77 days-of-age, the rates were treated with AM6-36 (40 mg/kg; 0.5 ml; ethanol:polyethylene glycol 400; 10/90, v/v) by gavage, and the treatment was continued on a daily basis for three days. Blood samples were collected (jugular vein) 3 h after the first treatment. Three hours after the final treatment, the animals were sacrificed, and blood, mammary tissue, liver, and perirenal fat were collected. After clotting, the blood samples were centrifuged at 100 ×g for 20 min. Serum and tissue samples were stored at -80°C until analysis. Rat liver was homogenized in 0.05M phosphate buffer (pH 7.4), and mammary gland and perirenal fat tissues were homogenized in a mixture (50:50; v/v) of phosphate buffer and methanol to give homogenates containing 0.2 g tissue/ml. As an internal standard for quantitative analysis, UCN-01 at 1 ng/ml was added to each homogenate and serum sample. Proteins in the homogenized tissue and serum samples were precipitated with four volumes of ice-cold acetonitrile. After centrifugation at 10,000 ×g for 5 min, each supernatant was removed, evaporated to dryness, and reconstituted in 100 μl of methanol/water (50:50; v/v) for analysis using liquid chromatography-tandem mass spectrometry (LC-MS-MS) (23). The injection volume was 10 μl. Briefly, LC-MS-MS analyses were carried out using a Shimadzu (Columbia, MD, USA) LC-20AD prominence UFLC pump and SIL-20AC HT prominence autosampler interfaced to an Applied Biosystems (Foster City, CA) API 4000 triple quadruple mass spectrometer. A Waters (Milford, MA) XTerra MS C18 column (2.1 mm × 100 mm, 3.5 μm) was used for HPLC separation with a 13-min linear gradient from10-80% acetonitrile in 0/1% aqueous formic acid at a flow rate of 0.25 ml/min. Positive ion electrospray was used for ionization, and product ion mass spectra were recorded using collision-induced dissociation and selected reaction monitoring (SRM) of the transition of m/z 320.4 to 303.2 and m/z 483.2 to 130.0 (300 ms per transition) for measurement of AM6-36 and internal standard, respectively. Calibration curves (linear from 0.5 ng/ml to 500 ng/ml AM6-36; R2 = 0.996) were prepared using blank serum or homogenized tissue from control rats.
Effect of AM6-36 on MNU-induced mammary tumors
A preliminary study was performed as described previously (24). Female Sprague–Dawley rats at 28 days of age were obtained from Harlan Sprague Dawley (Indianapolis, IN, USA) and acclimated under the controlled animal quarters maintained at a 12-h light/12-h dark cycle and 22 ± 2°C. MNU (National Cancer Institute Chemical Carcinogen Repository) was dissolved in sterile acidified saline (pH 5.0) and injected via the jugular vein of rats at 50 days of age with a dosage of 75 mg/kg body weight. When an animal developed a palpable mammary tumor (approximately 150-200 mm2), treatment with AM6-36 (10 mg/kg BW/day; ethanol:PEG400, 10/90, v/v) or vehicle was initiated (10 rats/group). Over a period of six weeks, the largest diameter of the cancer was measured and this value was multiplied by the perpendicular diameter (size expressed as mm2). Measurements were performed twice a week during the period of the study, the average tumor size in the control and treatment groups were plotted as a function of time, and data were analyzed using the Mann-Whitney test.
Statistical analyses
Results are presented as means ± standard error (SE). Unless otherwise indicated, statistical comparisons were performed by the use of Student’s t-test and the level of P < 0.05 was considered as significantly different.
Results
AM6-36 induced the RXRE transcriptional activity in COS-1 cells and MCF7 cells
To investigate the effect of samples on the functional role of RXRα protein as a transcriptional activator on RXRE cis-acting element in the promoter region of target gene, an RXRE assay was performed. As described above, ligand-bound RXR homodimer interacts with DR1, and initiates the transcription of target genes. To discover RXR modulators, COS-1 cells were transiently transfected with pRXRE. At the same time, due to the poor expression of endogenous RXRs in COS-1 cells, phRXRα was co-transfected (Fig. 2A). pRL was used as an internal control for normalization. As shown in Fig. 2B, 9-cis-RA induced the relative luciferase activity up to ~20-fold in cells co-transfected including phRXRα, while there was no marked increase in cells without phRXRα transfection. Therefore, the expression of RXRα is necessary for the RXRE-mediated transcriptional activation by rexinoids, and it is required to enhance the expression of RXRα in COS-1 cell line-based assay.
Figure 2.
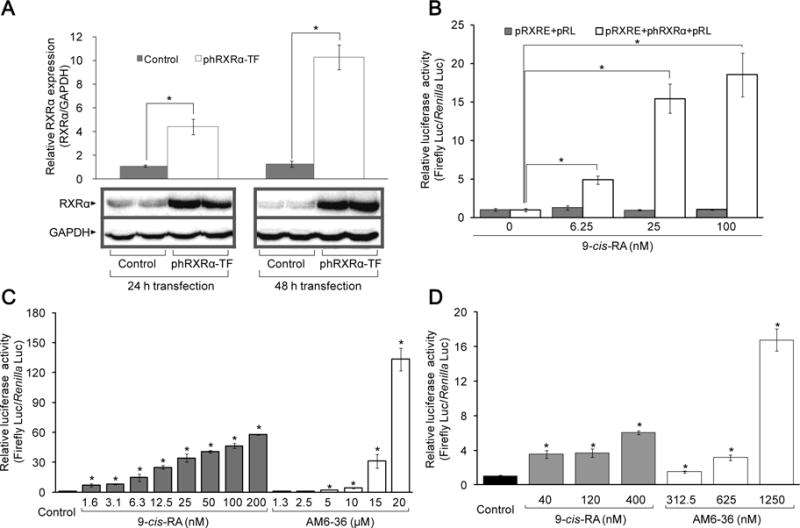
Effect of 9-cis-RA and AM6-36 on RXR transcriptional activity. A, MCF7 cells were transfected with empty vector (control) or phRXRα (phRXRα-TF) for 24 and 48 h. Total protein lysate (35 μg) of each sample was separated on 12% SDS-PAGE and immuneblotted with anti-RXRα antibody or anti-GAPDH antibody. The mean ± standard deviation (SD) of the band density of RXRα relative to internal control GAPDH of each group (n=3) is shown as a bar graph. Representative Western blot data are presented under the graph. B–D, Cells were transiently transfected with plasmids for 24 h, then, further incubated with 9-cis-RA or AM6-36 for 24 h. Cells were lysed and dual luciferase activity was measured. Results were expressed as mean ± SD (n=4). Each mean value was calculated by fold change over control after normalizing ratios of relative light units (RLU) produced by firefly luciferase to RLU produced by Renilla luciferase (Firefly Luc/Renilla Luc). B, COS-1 cells co-transfected with pRXRE (100 ng/well) and pRL (5 ng/well), or pRXRE (100 ng/well), phRXRα (50 ng/well), and pRL (7.5 ng/well) were treated with various concentrations of 9-cis-RA. C, COS-1 cells co-transfected with pRXRE (100 ng/well), phRXRα (50 ng/well) and pRL (7.5 ng/well) were treated with various concentrations of 9-cis-RA or AM6-36. D, MCF7 cells co-transfected with pRXRE (100 ng/well) and pRL (5 ng/well) were incubated with the indicated concentrations of 9-cis-RA or AM6-36. *P value less than 0.05 was considered statistically significant.
Next, we tested several thousand natural products and synthetic compounds. Through the process, only one active lead was found: AM6-36. As illustrated in Fig. 2C, AM6-36 greatly induced relative luciferase activities in a dose-dependent manner. Although the compound was less potent than 9-cis-RA, prominent induction was observed at higher concentrations (10 μM, 4.1-fold; 15 μM, 31.1-fold; 20 μM, 133.2-fold). In comparison, bexarotene, a RXR specific agonist, increased relative luciferase activities by 13.2±2.8, 16.8±2.9, 25.7±3.5, and 48.9±17.6-fold at concentrations of 12.5, 25, 50 and 100 μM, respectively.
Based on these data, further studies were performed with MCF7 cells, since RXRα has been shown to have a role in the inhibition of cell proliferation and induction of apoptosis in breast cancer cells (25). We further determined the effect of AM6-36 on RXR-RXRE transcriptional regulation. In MCF7 cells, it is not necessary to co-transfect phRXRα, owing to the expression of RXRs (25). As shown in Fig. 2D, treatment of transiently transfected MCF7 cells with 9-cis-RA increased the relative luciferase activity, in a dose-dependent manner, with 3.5-, 3.7-, 6.1-fold induction at 40, 120, and 400 nM, respectively. Likewise, AM6-36 induced relative luciferase activities by 1.5-, 3.2-, 16.8-fold at 312.5, 625, and 1250 nM, respectively. Therefore, with MCF7 cells, AM6-36 clearly increased RXR transcriptional activity. Nonetheless, to confirm the effect of AM6-36 on RXR protein-RXRE DNA sequence binding, an electrophoretic mobility shift assay was performed, similar to 9-cis-RA, AM6-36 enhanced the binding of RXRs to RXRE in MCF7 cells (Supplementary Fig. S2).
Induction of RXRE transcriptional activity and inhibition of MCF7 cell proliferation by AM6-36 derivatives
Based on the response observed with AM6-36, additional indenoisoquinolines were assessed to determine if a superior lead could be easily generated, and to learn something about structure-activity relationships. As summarized in Table 1, a small collection of structural derivatives were evaluated in the RXRE assay with COS-1 cells, and the SRB assay with MCF7 cells. AM6-36 mediated the strongest induction of RXRE transcriptional activity, as well as the strongest growth inhibitory effect with MCF7 cells. The only other test compounds showing enhanced transcriptional activity were 5 and 6, and these responses correlated with growth inhibition. In detail, compound 5 substituted with methyl group at the R2 position and compound 6 substituted with a nitro group at R1 and a dimethylaminopropyl group at R2, exhibited 3.0- and 3.3-fold induction, respectively. Even though compounds 5 and 6 were less active than AM6-36, they were capable of exerting inductive effects on RXRE activity in a dose-dependent manner (data not shown). Along with RXRE activity, compounds 5 and 6 showed significant anti-proliferative effects with MCF7 cells, yielding IC50 values of 0.47 and 0.34 μM, respectively.
Table 1.
Effects of indenoisoquinolines in RXRE assay and cell survival.

| ||||||
|---|---|---|---|---|---|---|
|
| ||||||
| Compound | R1 | R2 | R3 | R4 | Biological activities | |
| RXREassay* | SRB assay† | |||||
| Control | 1.00±0.20 | |||||
| 1 | NO2 |
|
H | H | 0.85±0.04 | >40 |
| 2 | NO2 |
|
H | H | 0.72±0.05 | >40 |
| 3 | NH2 |
|
H | H | 5.49±0.34 | 0.20 |
| 4 | NH2 |
|
H | H | 0.88±0.15 | 5.09 |
| 5 | NH2 | CH3 | H | H | 3.04±1.52 | 0.47 |
| 6 | NO2 |
|
H | H | 3.27±1.08 | 0.34 |
| 7 | NO2 |
|
H | OCH3 | 0.85±0.24 | 1.54 |
| 8 | NO2 |
|
OCH3 | H | 1.12±0.13 | >40 |
| 9 | NO2 |
|
H | F | 0.58±0.04 | 1.45 |
| 10 | NO2 |
|
F | H | 1.26±0.77 | 6.09 |
| 11 | NO2 |
|
H | H | 0.77±0.04 | >40 |
| 12 | H |

|
H | H | 0.68±0.21 | >40 |
| 13 | H |
|
H | H | 1.43±0.95 | >40 |
| 14 | H |
|
H | H | 0.69±0.03 | >40 |
| 15 | H |
|
H | H | 1.62±0.81 | >40 |
| 16 | H |
|
H | H | 1.09±0.13 | 15.74 |
| 17 | H | CH3 | H | H | 0.93±0.54 | 4.11 |
| 18 | I | CH3 | H | H | 0.59±0.47 | >40 |
|
| ||||||
| 9-cis-RA‡ | 14.61±2.10 | |||||
| Bexarotene‡ | 48.91±17.55 | |||||
| Camptothecin§ | 1.41 (nM) | |||||
COS-1 cells were transiently transfected with pRXRE, phRXRα, and pRL for 24 h. Then cells were treated with 40 μM indenoisoquinolines (compounds 1–18) for 24 h and subjected to the dual luciferase assay. Results were expressed as relative values calculated by fold increase over vehicle (0.5% DMSO)-treated controls after normalizing ratios of relative light units (RLU) produced by firefly luciferase activity to RLU produced by Renilla reniformis luciferase activity (Firefly Luc/Renilla Luc).
MCF7 breast cancer cells were diluted at a density of 5 × 10⁴ cells/ml and 190 μl of cell suspension were plated into each well of 96-well cell culture plates which contained 10 μl of diluted compounds and incubated for 72 h. Cell proliferation was assessed by the SRB assay and the percentage of survival of sample-treated cells relative to vehicle (0.5% DMSO)-treated control cells was calculated. Results were presented as IC50 values.
9-cis-RA (100 nM) and bexarotene (100 μM) were used as positive controls in the RXRE assay.
Camptothecin was used as a positive control in the SRB assay.
AM6-36 inhibited proliferation in MCF7 cells by cell cycle arrest in the G2/M phase at lower concentrations and S phase at higher concentrations concomitant with increased expression of CDKN1A
The potential of AM6-36 to inhibit the proliferation of MCF7 cells was examined. As shown in Fig. 3A, vehicle (DMSO 0.1%)-treated control cells exhibited over a 4-fold increase in cell proliferation, compared to that of starting time point (0 h). However, in the presence of AM6-36, MCF7 cell proliferation was reduced in a concentration-dependent manner, yielding IC50 values of 1.09, 0.85, and 0.42 μM at 24, 48, and 72 h, respectively. At these respective incubation times, bexarotene inhibited the cell proliferation with IC50 values of 82.3, 55.2, and 43.4 μM.
Figure 3.
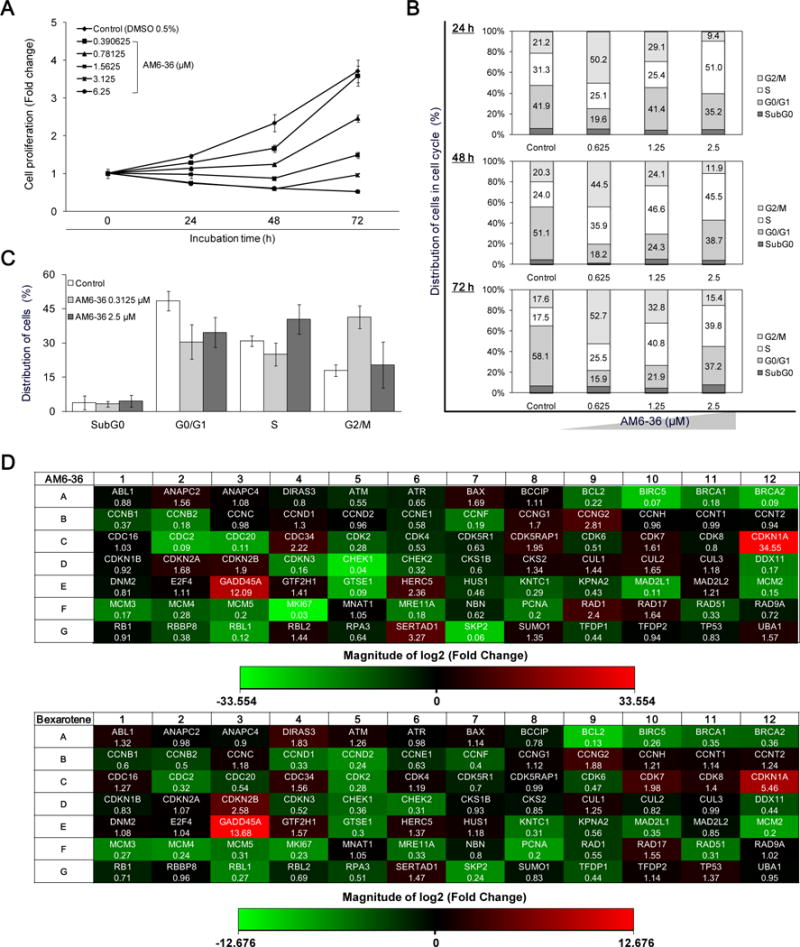
Induction of RXRE-luciferase activity and inhibition of cell proliferation accompanied with cell cycle arrest by indenoisoquinolines accompanied by significant changes in cell cycle regulatory genes by AM6-36 treatment in MCF7 breast cancer cells. A, The proliferative state of cells was evaluated with the SRB assay. Cells were incubated for 24 h, 48 h, and 72 h. Results are presented as fold increases of absorbance at 515 nm over control at a starting point (0 h). B and C, MCF7 cells were seeded at a density of 50 × 104 cells in a 10 cm cell culture dish and incubated for 48 h. After incubation with AM6-36 for each time period, 10,000 of cells were analyzed for DNA content and the distribution of cells in each phase was estimated by using ModFit LT™ (Verity Software House, Topsham, ME). D, MCF7 cells were seeded at a density of 50 × 104 cells in a 10 cm cell culture dish and incubated for 48 h. Cells were treated with vehicle (DMSO) or serially diluted AM6-36 for 24 h. RNA was extracted from cells and reverse transcribed to cDNA. Then, cDNA was mixed with RT2 qPCR Master Mix and 25 μl were placed in each well of the array plate. Real-time quantitative PCR was performed using SyBR Green detection system. The thermal cycling condition was at 95°C for 10 min and then 40 cycles at 95°C for 15 sec followed by 60°C for 1 min. Based on the ΔΔCt method, the fold-changes between the control group and sample-treated groups were analyzed using the web-based software provided by SABiosciences (RT2 Profiler PCR Array Data Analysis). Fold changes of 84 genes induced by AM6-36 or bexarotene were determined and presented as heat maps (Red: up-regulation, Green: down-regulation).
To better understand the anti-proliferative effect of AM6-36, DNA content and cell cycle distribution were analyzed by flow cytometric analysis. As shown in Fig. 3B, treatment with 0.625 μM AM6-36 caused cells to accumulate in the G2/M phase, while treatment with higher concentrations, such as 2.5 μM, induced S phase arrest. This was confirmed by treatment with 0.3125 μM or 2.5 μM AM6-36 for 24 h, as shown in Fig. 3C. To further elucidate the mechanism underlying the anti-proliferation and cell cycle arrest induced by AM6-36, a cDNA microarray was employed. For this analysis, MCF7 cells were incubated in the presence or absence of AM6-36 (1 μM; IC50 value after 24 h treatment), then RNA was isolated and reverse-transcribed to cDNA. The same amount of cDNA was subjected to the microarray plate for real-time PCR reaction. The results were analyzed and genes which were up-regulated or down-regulated with a P value of <0.05 in comparison with control were considered as significantly altered by the treatment (Supplementary Table S1). As shown in Fig. 3D, the expression of 26 out of 84 genes was altered by treatment of 1 μM AM6-36. Specifically, the expression of 7 genes, including CCNG2, CDC34, CDK5RAP1, CDKNIA, GADD45A, RAD1, and SERTAD1, were significantly increased, while those of 19 genes, including BIRC5, BRCA2, CCNB2, CCNF, CDC2, CDC20, CDK2, CDKN3, CHEK1, DDX11, GTSE1, MAD2L1, MCM2, MCM3, MCM5, MKI67, PCNA, RBL1, and SKP2, were significantly down-regulated. Among these, CDKN1A and MKI67 were most highly up- and down-regulated, respectively.
Bexarotene (100 μM; approximate IC50 value after 24 h treatment) was tested in parallel experiments. Consequently, the expression of 9 out of 84 genes was altered significantly (up-regulated genes: CDKN1A, CDKN2B, and GADD45A; down-regulated genes: BCL2, BIRC5, CDK2, GTSE1, MCM2, and PCNA). In particular, BIRC5, CDK4, CDKN1A, GADD45A, GTSE1, MCM2, and PCNA were altered by both AM6-36 and bexarotene. Of the two genes significantly altered by bexarotene but not AM6-36 (BCL2, down-regulated; CDKN2B, up-regulated), there was clearly a similar trend of modulation by both compounds. Of the 14 genes significantly down-regulated by AM6-36 but not bexarotene, nine were also down-regulated by bexarotene at the p ≤ 0.083 level.
Supplementary Fig. S1 illustrates the connectivity of the main genes used in this array that were affected by AM6-36 or bexarotene. Notably, expression levels of several genes which are transcriptionally activated by p53 (the protein of the TP53 gene), were significantly up-regulated by AM6-36 and bexarotene. Prominent examples are CDKN1A (P = 0.00029 AM6-36; P = 0.00014 bexarotene) and GADD45A (P = 0.00031 AM6-36; P = 0.00011 bexarotene).
p53 and p21 were increased after AM6-36 treatment and RXRα protein knock-down by RXRα siRNA abrogated the effect of AM6-36 on the induction of p21 expression
Although the expression of TP53 was not modulated by AM6-36 with MCF7 cells, the potential effect on protein level was examined by Western blot analyses. As shown in Fig. 4A, treatment with AM6-36 caused an increase of p53 at 8 h, followed by decreases at 24 and 48 h. Even though the protein level of p53 was diminished at later time points, it still remained at higher levels than the control. Also, since CDKN1A levels were most highly elevated by treatment with AM6-36, its protein (p21CIP1/WAF1) levels were determined. Expression of p21 in control cells was low at all time points, while treatment of AM6-36 caused the moderate increase at 8 h, and incremental expression was observed at 24 and 48 h. To establish a direct correlation between the transcriptional activity of RXRα and the induction of p21 expression, the expression of RXRα protein was transiently depleted in MCF7 cells by introducing RXRα siRNA into the cells. As shown in Fig. 4B, siRNA targeted to RXRα markedly reduced RXRα expression, and consequently affected the up-regulating effect of AM6-36 on the protein expression of p21. Also, transfection of p53 siRNA resulted in the abrogation of the p21 expression induced by AM6-36 (Fig. 4C). However, p53 knock-down did not influence the expression of RXRα (Fig. 4D). These data suggested that AM6-36 was not able to induce p21 expression in the absence of RXRα or p53, i.e., RXRα and p53 are required for AM6-36-mediated mRNA up-regulation of p21.
Figure 4.
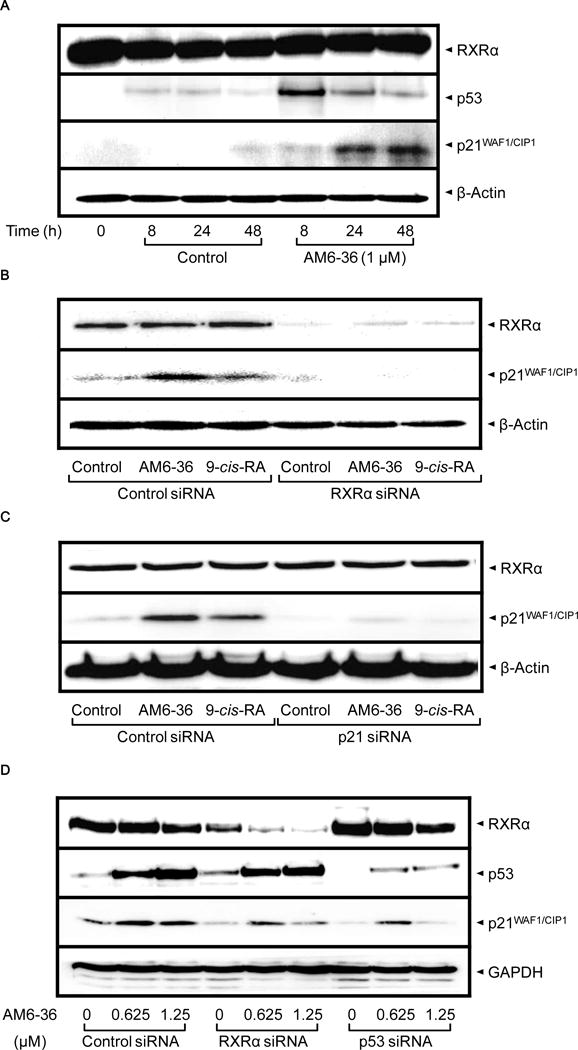
Increased protein expression of p53 and p21 by AM6-36, and altered expression of p21 by knock-down of RXRα or p53 in MCF7 cells. A, MCF7 cells were seeded at a density of 10 × 104 cells in 6-well culture plates and incubated for 24 h. Cells were treated with 1 μM AM6-36 for the indicated time points. Cell lysates were prepared and subjected to Western blot analysis. B–D, After transient transfection with the indicated siRNAs, MCF7 cells were treated with vehicle (0.1% DMSO), AM6-36 (1 μM, B and C; 0.625, 1, or 1.25 μM, D) or 9-cis-RA (1 μM, B and C) for an additional 24 h. Cell lysates were prepared and subjected to Western blot analysis.
Effects of AM6-36 on JB6 Cl41 cells
In order to begin assessment of the chemopreventive potential of AM6-36, studies were performed with TPA-treated JB6 Cl41 cells. As shown in Fig. 5A, the expression of COX-2 was induced after exposure to TPA (10 ng/ml) for 15 h. In contrast to control, however, co-treatment with AM6-36 attenuated COX-2 protein expression in a concentration-dependent manner. Next, anchorage-independent cell transformation assay was performed. After 28 days of incubation in the presence or absence of AM6-36, cells were stained and quantified. As shown in Fig. 5B, as judged by growth in soft agar, treatment with AM6-36 reduced cell transformation by approximately 70%.
Figure 5.
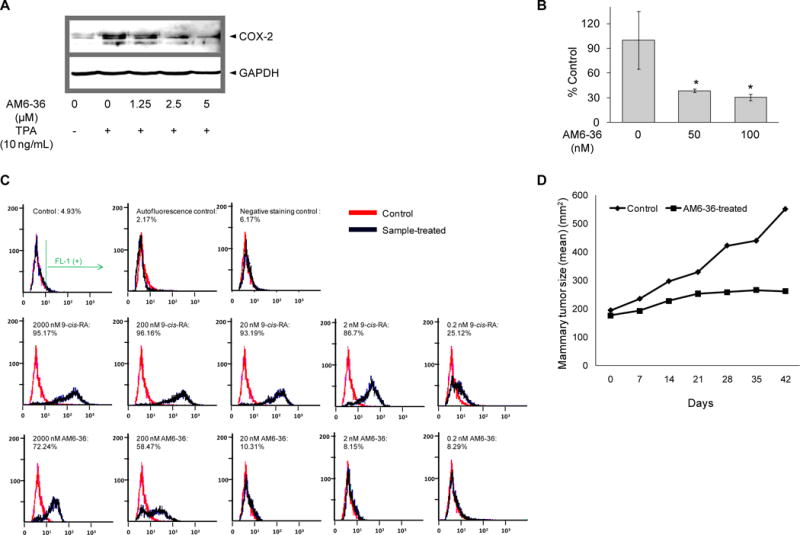
Evaluation of chemopreventive potential of AM6-36. A, JB6 Cl41 cells were stimulated by treatement with TPA (10 ng/ml) in the presence or absence of AM6-36 for 15 h. Whole cell lysates were prepared and COX-2 expression was determined by Western blot analysis. β-Actin was used as an internal control. B, JB6 Cl41 cells were suspended in 50 μl of 0.4% agar complete MEM medium over 100 μl of 0.8% agar complete MEM medium. Cells were exposed to 5 nM TPA with or without AM6-36 at 37°C in a humidified atmosphere with 5% CO2 for 28 days. At the end of the incubation, cell quantification solution was added to each well and further incubated at 37°C for 4 h. Absorbance was measured at 490 nm and the data are shown as % transformation activity relative to TPA-treated control. C, HL-60 cells were incubated with serially diluted 9-cis-RA or AM6-36 (2000, 200, 20, 2, 0.2 nM) for 96 h. Cells were stained with anti-CD38-FITC the intensity of FITC was measured using flow cytometry. FL-1 (+) indicates % of cell population which possess FITC fluorescence, the expression of CD38. D, Effect of AM6-36 (10 mg/kg) on MNU-induced mammary tumors in Sprague-Dawley rats. The plots summarize average tumor size in control (closed triangles) and AM6-36-treated (closed squares) animals (N=10). P=0.1; Mann-Whitney test.
Expression of cell surface marker, CD38
As an additional test of chemopreventive potential, the ability of AM6-36 to affect the expression of CD38 was assessed with HL-60 cells. As shown in Fig. 5C, with this model, treatment with 9-cis-RA can induce the expression of CD38 in about 95% of the cell population at higher concentrations (2000, 200, 20 nM). At a concentration of 2 nM, the 9-cis-RA-treated cell population moved to the left with a decreased percentage of FL-1 positive cells (86.7%), and at 0.2 nM, further reduction in expression was observed. When treated with 2000 or 200 nM AM6-36, cells exhibited a 72 or 58% FL-1 positive response (CD38-positive), respectively, although the fluorescence intensity was lower in comparison with 2000 nM 9-cis-RA-treated cells.
Evaluation of AM6-36 permeability and metabolic stability
Judged by the Caco-2 cell permeability model, the apparent permeability coefficient for AM6-36 in the AP → BL, 2.75×10⁻⁶ cm/sec, was found to be 10-fold slower than that of the high permeability standard, propranolol, but 17-fold faster than the low permeability standard, sucrose (Table 2A). These measurements indicate that the intestinal absorption of AM6-36 should proceed at a moderate rate following oral administration. Since the apparent permeability coefficients in the AP → BL and in the BL → AP were not significantly different, AM6-36 does not appear to be a substrate for efflux proteins that might reduce its bioavailability. During incubation of AM6-36 with human liver microsomes, one abundant and three minor metabolites were observed. In the absence of either NADPH or microsomes, no metabolites were detected. Therefore, we assume that all four metabolites are produced in a cytochrome P450- and NADPH-dependent manner. The structures of these metabolites are currently under investigation and will be reported later.
Table 2.
Intestinal permeability, metabolic stability, and distribution of AM6-36
| A, Apparent permeability coefficients of AM6-36 through Caco-2 monolayers. | ||
|---|---|---|
|
| ||
| Papp (×10−6 cm/sec ± S.D.)*
|
||
| AP to BL† | BL to AP‡ | |
| AM6-36§ | ||
| 5 μM | 2.75 ± 0.78 | 3.95 ± 0.11 |
| 10 μM | 5.52 ± 0.29 | 3.25 ± 0.71 |
| 25 μM | 4.45 ± 0.71 | 8.26 ± 0.93 |
| Standards | ||
| Propranolol 10 μM | 27.6 | |
| Sucrose 50 μM | 0.16 | |
| B, Disposition of AM-6-36 in the rat.** | |||||
|---|---|---|---|---|---|
|
| |||||
| AM6-36 (40 mg/kg) |
Serum 1-day (μg/ml) N=3 |
Serum 3-day (μg/ml) N=3 |
Liver (μg/g) N=3 |
Mammary gland (μg/g) Pooled:N=3 |
Fat (μg/g) Pooled:N=3 |
| Rat#1 | 0.84 ± 0.008 (2.14 μM) |
0.82 ± 0.003 (2.09 μM) |
3.72 ± 0.07 | – | – |
| Rat#2 | 0.84 ± 0.01 (2.14 μM) |
0.84 ± 0.007 (2.14 μM) |
5.03 ± 0.23 | – | – |
| Rat#3 | 0.82 ± 0.004 (2.09 μM) |
0.82 ± 0.002 (2.09 μM) |
3.75 ± 0.13 | – | – |
| Average | 0.83 ± 0.01 (2.12 μM) |
0.83 ± 0.01 (2.12 μM) |
4.28 ± 0.65 | 0.29 ± 0.006 | 0.28 ± 0.00 |
Papp corresponds to the apparent permeability coefficients and is expressed as cm/sec (×10−6).
AP to BL indicates apical to basolateral transport.
BL to AP indicates basolateral to apical transport.
Data are expressed as mean ± SD, n = 3.
See text for experimental details.
Preliminary studies conducted with rats
In order to assess absorption and metabolism, AM6-36 (40 mg/kg body weight) was administered to rats, by gavage, over a period of three days. Blood was collected on day 1 and day 3, and tissues were collected at the end of the study. As summarized in Table 2B, the concentration of AM6-36 in the rat serum was approximately 0.83 μg/ml. The concentration in liver (4.28 μg/g) was around 5-times higher. Appreciable quantities were also found in the mammary gland (0.29 μg/g) and perirenal fat (0.28 μg/g). These data are consistent with moderate oral absorption and slow metabolism/excretion.
Finally, to obtain an early indication of chemopreventive potential, a short-term mammary tumor model was used. As shown in Fig. 5D, at a dose of 10 mg/kg body weight, AM6-36 clearly attenuated tumor growth (p = 0.1). It will now be necessary to evaluate larger numbers of animals with various treatment regimens to establish statistical significance, but the trend demonstrates promising.
Discussion
RXR agonists have shown promise for the treatment or prevention of cancer. 9-cis-Retinoic acid and LGD1069 are key examples of agents in clinical use. In addition, unlike other nuclear receptors, RXRs are expressed in human carcinomas and over-expression of RXR has enhanced the transcriptional response after binding of ligands (26). Based on these considerations, we introduced a cell line-based RXRE-luciferase reporter gene assay to evaluate the RXRα transcriptional activity of various test substances. As the result of an extensive search, AM6-36 was found to be active. Since the COS-1 cells used for this discovery were transiently transfected with pRXRE and phRXRα, a response is expected to be due to the interaction of a test substance with RXR-RXR homodimers. Further investigation is required to determine the potential of any lead, including AM6-36, to interact with other nuclear receptors, such as RXR-peroxisome proliferator-activated receptor (PPAR) (27). The goal of this work, however, was to investigate the biological ramifications of the highly unique response mediated by AM6-36 with this model system.
Indenoisoquinolines were first synthesized in 1978 (28) and studied as topoisomerase I (topI) inhibitors with advantageous properties compared to camptothecins, known TopI inhibitors. Additional activities are also known, such as induction of cell cycle arrest, overcoming multidrug-resistance, and enhancement of the differentiation-inducing activity of retinoids (29–31). AM6-36 mediated only modest inhibition of the DNA religation reaction (data not shown), but unexpectedly, RXRE luciferase activity was highly up-regulated. Based on the response induced by AM6-36, a small group of structural relatives were evaluated to determine if activity could be further enhanced. As shown in Table 1, compounds 5 and 6 induced the RXR transcriptional activities as well as anti-proliferative effects toward MCF7 cells, but AM6-36 was still the most active compound.
The indenoisoquinoline AM6-36 is an atypical rexinoid since it does not contain a carboxylic acid and it does not structurally resemble a retinoic acid. In comparison with known rexinoids, most of which contain carboxylic acids (32–34), the indenoisoquinoline rexinoids constitute a fundamentally different type of RXR ligand. The fact that indenoisoquinolines are structurally unique rexinoids offers the possibility of them having unique pharmacological properties that could be clinically useful. Considering these factors as a whole, AM6-36 was selected for further evaluation.
As shown in Fig. 1, a synthetic procedure was devised that is suitable for production of the lead compound in multi-gram quantities. Since RXR agonists showed apoptotic effects in RXRα-expressed MCF7 cells (25), we examined the effect of AM6-36 using this cell line. As expected, when MCF7 cells were treated with AM6-36, we observed increased RXRα transcriptional activity, which correlated with the response observed with transiently transfected COS-1 cells. All of these data suggest MCF7 cells should be a useful model for exploring the action of AM6-36 related to RXRα. Cell cycle analysis revealed G2/M arrest at lower concentrations and S-phase arrest at higher concentrations (Fig. 4C). A similar dose-related dual effect has been reported when MCF7 cells were treated with adriamycin (35), and other DNA damaging agents showed partial G1 and G2/M phase cell cycle arrest at lower doses, whereas they exerted partial or total S-phase cell cycle arrest at higher doses (36). Analogously, the response induced by lower doses of AM6-36 may be related to effects on DNA.
Together with significant growth inhibition, genes known as conventional proliferation markers and used in the diagnosis of breast cancer, including MKI67 and PCNA (37), were down-regulated by treatment with AM6-36. However, a known target gene of RXR, CDKN1A (38), was the most intensively up-regulated. Correspondingly, p21 protein levels were increased (Fig. 4B). Treatment of cells with retinoic acid can lead to elevated p21 levels (39), as well as agents such as 2{[3-(2,3-dichlorophenoxy)propyl]amino}ethanol (40) and interferon α (41). Interestingly, similar to AM6-36, these agents arrest cells in the S-phase of the cycle. In the RXRE assay, AM6-36 showed higher induction in RXRα transcriptional activity than 9-cis-RA. The response may be augmented by enhanced expression of GADD45A, a RXRα coactivator (42). It is further noted from the DNA microarray that SKP2 is greatly down-regulated by treatment with AM6-36. This might give rise to the increased protein expression of p21, since Skp2 is involved in the degradation of p21 (43).
The role of p53 in these processes remains to be further explored. Although p53 gene expression was not increased by AM6-36, other effects such as modified protein expression and transcriptional activity may come into play. In addition to up-regulation of CDKN1A, other genes associated with p53 transcriptional activity (e.g., GADD45A, CCNG2) (44) showed increases in expression to some extent. Further, the expression of GTSE1, which has been reported to down-regulate the level and activity of the p53 tumor suppressor protein (45), was decreased by AM6-36. Thus, although additional studies are warranted, this might explain the increase in p53 protein level.
In any case, enhanced RXRα activity leading to highly elevated expression of p21, an inhibitor of CDKs which negatively regulates cell cycle progression (46), appears to play a dominent role in the cellular responses orchestrated by AM6-36 treatment. A direct relationship between the activation of RXRα and p21 expression was further established by transiently blocking the expression of RXRα. In the absence of RXRα, the expression of p21 was abrogated (Fig. 4B). The crystal structure of AM6-36 bound to RXRα has yet to be determined, but a hypothetical structure was generated by GOLD docking the indenoisoquinoline into the X-ray structure of RXR-α (1FBY) using the centroid (15.2492, 28.4959, 48.2618) of bound 9-cis-RA. As illustrated in Fig. 6, AM6-36 can readily interact with the binding site of 9-cis-RA. The ligand pose with the highest GOLD score and the most favorable binding energy was used for further calculations. The energy of the ligand and a surrounding spherical subset of atoms having a radius of 6 Å was minimized by the conjugate gradient method using the MMFF94s force field and MMFF94 charges. The calculation was terminated at a gradient of 0.05 kcal/(mol·Å).
Figure 6.
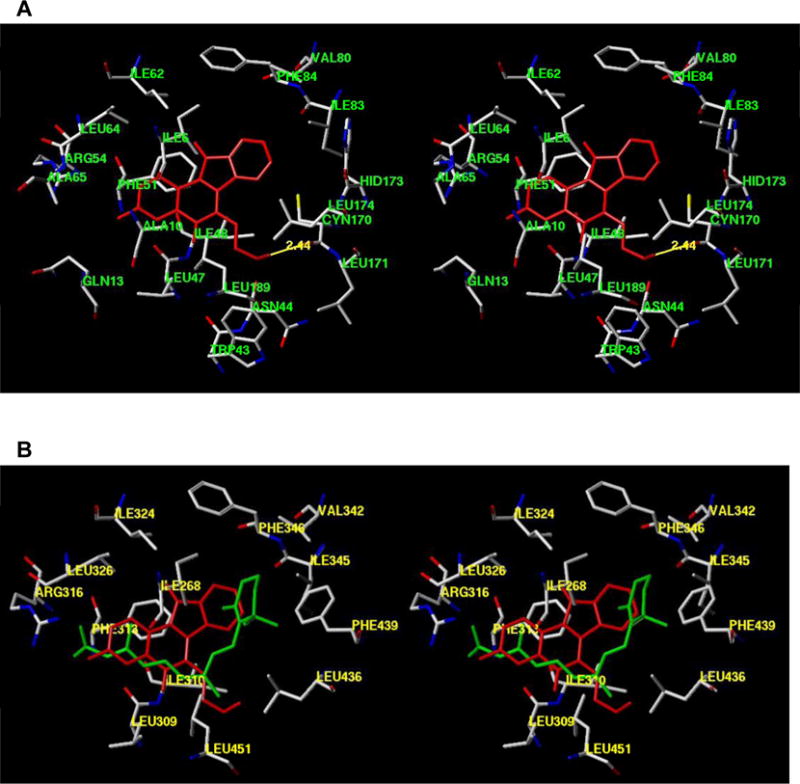
Protein modeling of AM6-36 or 9-cis-RA with RXRα. A, Hypothetical structure of AM6-36 (red) bound to RXRα. B, Overlap of AM6-36 with the crystal structure of 9-cis-RA-RXR complex. AM6-36 is colored red and 9-cis-RA is colored green. The structures are programmed for wall-eyed (relaxed) viewing.
Rexinoids are of interest due to cancer chemopreventive potential (6–8), and, of course, a question of utmost importance is the chemopreventive potential of AM6-36. Some early studies have been completed. As normal cells undergo neoplastic transformation, they gain the ability to demonstrate ‘anchorage independence’ and grow in soft agar (47). Currently, we demonstrated the potential of AM6-36 to suppress TPA-induced neoplastic transformation of JB6 Cl41 cells. Further, during neoplastic transformation stimulated by TPA, JB6 Cl41 cells express COX-2, which plays pivotal roles not only inflammation but also carcinogenesis. AM6-36 inhibits the expression of COX-2 in this model system.
An additional strategy for cancer chemoprevention is the induction of differentiation (48). All-trans-retinoic acid (ATRA) is known to induce CD38 expression through activation of RAR and RXR in myeloid progenitor cells, which modulates cell differentiation (49,50). As a further induction of cancer chemopreventive potential, we currently demonstrated AM6-36-treated HL-60 cells express CD38 on membrane surfaces.
Taken together, these data suggest the potential of AM6-36 to serve as a chemopreventive agent. Preliminary results were also obtained with the Caco-2 cell permeability model, suggesting the compound would be orally absorbed. In addition, incubation with human liver microsomes indicated moderate metabolism. These data were corroborated by studies involving oral administration with rats. Serum and tissue levels were readily achieved that should be of physiological relevance, based on in vitro response data. In support of this notion, a preliminary evaluation demonstrated attenuation of MNU-induced tumorigenesis in female Sprague-Dawley rats. Cleary, additional work is required to assess the effect of various dose-regimens with larger numbers of animals representative of different tumor models, but this is completely feasible, since AM6-36 can readily be produced on a multi-gram scale. AM6-36 is a surprising and unique molecule, representing a promising lead that functions through a novel mechanism.
Acknowledgments
Grant support: National Institutes of Health under NCI grants P01 CA48112 and U01 CA089566.
References
- 1.Mangelsdorf DJ, Ong ES, Dyck JA, Evans RM. Nuclear receptor that identifies a novel retinoic acid response pathway. Nature. 1990;345:224–9. doi: 10.1038/345224a0. [DOI] [PubMed] [Google Scholar]
- 2.Szanto A, Narkar V, Shen Q, Uray IP, Davies PJ, Nagy L. Retinoid X receptors: X-ploring their (patho)physiological functions. Cell Death Differ. 2004;11:S126–43. doi: 10.1038/sj.cdd.4401533. [DOI] [PubMed] [Google Scholar]
- 3.Mangelsdorf DJ, Evans RM. The RXR heterodimers and orphan receptors. Cell. 1995;83:841–50. doi: 10.1016/0092-8674(95)90200-7. [DOI] [PubMed] [Google Scholar]
- 4.Wolf G. Is 9-cis-retinoic acid the endogenous ligand for the retinoic acid-X receptor? Nutr Rev. 2006;64:532–8. doi: 10.1111/j.1753-4887.2006.tb00186.x. [DOI] [PubMed] [Google Scholar]
- 5.Germain P, Chambon P, Eichele G, et al. International Union of Pharmacology. LXIII. Retinoid X receptors. Pharmacol Rev. 2006;58:760–72. doi: 10.1124/pr.58.4.7. [DOI] [PubMed] [Google Scholar]
- 6.Anzano MA, Byers SW, Smith JM, et al. Prevention of breast cancer in the rat with 9-cis-retinoic acid as a single agent and in combination with tamoxifen. Cancer Res. 1994;54:4614–7. [PubMed] [Google Scholar]
- 7.Suh N, Lamph WW, Glasebrook AL, et al. Prevention and treatment of experimental breast cancer with the combination of a new selective estrogen receptor modulator, arzoxifene, and a new rexinoid, LG 100268. Clin Cancer Res. 2002;8:3270–5. [PubMed] [Google Scholar]
- 8.Gottardis MM, Bischoff ED, Shirley MA, Wagoner MA, Lamph WW, Heyman RA. Chemoprevention of mammary carcinoma by LGD1069 (Targretin): An RXR-selective ligand. Cancer Res. 1996;56:5566–70. [PubMed] [Google Scholar]
- 9.Dezube BJ, Pantanowitz L, Aboulafia DM. Management of AIDS-related Kaposi sarcoma: advances in target discovery and treatment. AIDS Read. 2004 May;14(5):236–8. [PubMed] [Google Scholar]
- 10.Querfeld C, Nagelli LV, Rosen ST, Kuzel TM, Guitart J. Bexarotene in the treatment of cutaneous T-cell lymphoma. Expert Opin Pharmacother. 2006;7:907–15. doi: 10.1517/14656566.7.7.907. [DOI] [PubMed] [Google Scholar]
- 11.Morrell A, Placzek M, Parmley S, et al. Optimization of the indenone ring of indenoisoquinoline topoisomerase I inhibitors. J Med Chem. 2007;50:4388–404. doi: 10.1021/jm070307+. [DOI] [PubMed] [Google Scholar]
- 12.Morrell A, Placzek M, Parmley S, et al. Nitrated indenoisoquinolines as topoisomerase I inhibitors: a systematic study and optimization. J Med Chem. 2007;50:4419–30. doi: 10.1021/jm070361q. [DOI] [PubMed] [Google Scholar]
- 13.Cushman M, Jayaraman M, Vroman JA, et al. Synthesis of New Indeno[1,2-c]isoquinolines: Cytotoxic Non-Camptothecin Topoisomerase I Inhibitors. J Med Chem. 2000;43:3688–98. doi: 10.1021/jm000029d. [DOI] [PubMed] [Google Scholar]
- 14.Morrell A, Antony S, Kohlhagen G, et al. Synthesis of benz[d]indeno[1,2-b]pyran-5,11-diones: Versatile intermediates for the design and synthesis of topoisomerase I inhibitors. Bioorg Med Chem Lett. 2006;16:1846–49. doi: 10.1016/j.bmcl.2006.01.008. [DOI] [PubMed] [Google Scholar]
- 15.Morrell A, Antony S, Kohlhagen G, et al. Systematic study of nitrated indenoisoquinolines reveals a potent topoisomerase I inhibitor. J Med Chem. 2006;49:7740–53. doi: 10.1021/jm060974n. [DOI] [PMC free article] [PubMed] [Google Scholar]
- 16.Skehan P, Storeng R, Scudiero D, et al. New colorimetric cytotoxicity assay for anticancer-drug screening. J Natl Cancer Inst. 1990;82:1107–12. doi: 10.1093/jnci/82.13.1107. [DOI] [PubMed] [Google Scholar]
- 17.Krishan A, Cabana R. Flow cytometric analysis of electronic nuclear volume and DNA content in normal mouse tissues. Cell Cycle. 2004;3:380–3. [PubMed] [Google Scholar]
- 18.Bradford MM. A rapid and sensitive method for the quantitation of microgram quantities of protein utilizing the principle of protein-dye binding. Anal Biochem. 1976;72:248–54. doi: 10.1016/0003-2697(76)90527-3. [DOI] [PubMed] [Google Scholar]
- 19.Chomczynski P, Sacchi N. Single-step method of RNA isolation by acid guanidinium thiocyanate-phenol-chloroform extraction. Anal Biochem. 1987;162:156–9. doi: 10.1006/abio.1987.9999. [DOI] [PubMed] [Google Scholar]
- 20.Livak KJ, Schmittgen TD. Analysis of relative gene expression data using real-time quantitative PCR and the 2(-Delta Delta C(T)) method. Methods. 2001;25:402–8. doi: 10.1006/meth.2001.1262. [DOI] [PubMed] [Google Scholar]
- 21.Guo J, Liu D, Nikolic D, Zhu D, Pezzuto JM, van Breemen RB. In vitro metabolism of isoliquiritigenin by human liver microsomes. Drug Metab Dispos. 2008;36:461–8. doi: 10.1124/dmd.107.018721. [DOI] [PubMed] [Google Scholar]
- 22.Li Y, Shin YG, Yu C, et al. Increasing the throughput and productivity of Caco-2 cell permeability assays using liquid chromatography-mass spectrometry: Application to resveratrol absorption and metabolism. Comb Chem High Throughput Screen. 2003;6:757–67. doi: 10.2174/138620703771826865. [DOI] [PubMed] [Google Scholar]
- 23.Yu C, Shin YG, Chow A, et al. Human, rat, and mouse metabolism of resveratrol. Pharm Res. 2002;19:1907–14. doi: 10.1023/a:1021414129280. [DOI] [PubMed] [Google Scholar]
- 24.Lubet RA, Szabo E, Christov K, et al. Effects of gefitinib (Iressa) on mammary cancers: Preventive studies with varied dosages, combinations with vorozole or targretin, and biomarker studies. Mol Cancer Ther. 2008;7:972–79. doi: 10.1158/1535-7163.MCT-07-2141. [DOI] [PubMed] [Google Scholar]
- 25.Toma S, Isnardi L, Riccardi L, Bollag W. Induction of apoptosis in MCF-7 breast carcinoma cell line by RAR and RXR selective retinoids. Anticancer Res. 1998;18:935–42. [PubMed] [Google Scholar]
- 26.Wan H, Dawson MI, Hong WK, Lotan R. Overexpressed activated retinoid X receptors can mediate growth inhibitory effects of retinoids in human carcinoma cells. J Biol Chem. 1998;273:26915–22. doi: 10.1074/jbc.273.41.26915. [DOI] [PubMed] [Google Scholar]
- 27.Monden T, Kishi M, Hosoya T, Satoh T, Wondisford FE, Hollenberg AN, Yamada M, Mori M. p120 acts as a specific coactivator for 9-cis-retinoic acid receptor (RXR) on peroxisome proliferator-activated receptor-gamma/RXR heterodimers. Mol Endocrinol. 1999;13:1695–703. doi: 10.1210/mend.13.10.0353. [DOI] [PubMed] [Google Scholar]
- 28.Cushman M, Cheng L. Stereoselective oxidation by thionyl chloride leading to the indeno[1,2-c]isoquinoline system. J Org Chem. 1978;43:3781–3. [Google Scholar]
- 29.Antony S, Agama KK, Miao ZH, et al. Novel indenoisoquinolines NSC 725776 and NSC 724998 produce persistent topoisomerase I cleavage complexes and overcome multidrug resistance. Cancer Res. 2007;67:10397–405. doi: 10.1158/0008-5472.CAN-07-0938. [DOI] [PubMed] [Google Scholar]
- 30.Antony S, Agama KK, Miao ZH, et al. Bisindenoisoquinoline bis-1,3-{(5,6-dihydro-5,11-diketo-11H-indeno[1,2-c]isoquinoline)-6-propylamino}propane bis(trifluoroacetate) (NSC 727357), a DNA intercalator and topoisomerase inhibitor with antitumor activity. Mol Pharmacol. 2006;70:1109–20. doi: 10.1124/mol.106.024372. [DOI] [PubMed] [Google Scholar]
- 31.Kim SH, Oh SM, Song JH, et al. Indeno[1,2-c]isoquinolines as enhancing agents on all-trans retinoic acid-mediated differentiation of human myeloid leukemia cells. Bioorg Med Chem. 2008;16:1125–32. doi: 10.1016/j.bmc.2007.10.086. [DOI] [PubMed] [Google Scholar]
- 32.Altucci L, Leibowitz MD, Ogilvie KM, de Lera AR, Gronemeyer H. RAR and RXR modulation in cancer and metabolic disease. Nat Rev Drug Discov. 2007;6:793–810. doi: 10.1038/nrd2397. [DOI] [PubMed] [Google Scholar]
- 33.de Lera AR, Bourguet W, Altucci L, Gronemeyer H. Design of selective nuclear receptor modulators: RAR and RXR as a case study. Nat Rev Drug Discov. 2007;6:811–20. doi: 10.1038/nrd2398. [DOI] [PubMed] [Google Scholar]
- 34.Muccio DD, Brouillette WJ, Alam M, Vaezi MF, Sani BP, Venepally P, Reddy L, Li E, Norris AW, Simpson-Herren L, Hill DL. Conformationally defined 6-S-trans-retinoic acid analogs. 3. Structure-activity relationships for nuclear receptor binding, transcriptional activity, and cancer chemopreventive activity. J Med Chem. 1996;39:3625–35. doi: 10.1021/jm9603126. [DOI] [PubMed] [Google Scholar]
- 35.Su J, Ciftci K. Changes in BRCA1 and BRCA2 expression produced by chemotherapeutic agents in human breast cancer cells. Int J Biochem Cell Biol. 2002;34:950–7. doi: 10.1016/s1357-2725(02)00016-x. [DOI] [PubMed] [Google Scholar]
- 36.Scully R, Chen J, Plug A, et al. Association of BRCA1 with Rad51 in mitotic and meiotic cells. Cell. 1997;88:265–75. doi: 10.1016/s0092-8674(00)81847-4. [DOI] [PubMed] [Google Scholar]
- 37.Urruticoechea A, Smith IE, Dowsett M. Proliferation marker Ki-67 in early breast cancer. J Clin Oncol. 2005;23:7212–20. doi: 10.1200/JCO.2005.07.501. [DOI] [PubMed] [Google Scholar]
- 38.Tanaka T, Suh KS, Lo AM, De Luca LM. p21WAF1/CIP1 is a common transcriptional target of retinoid receptors: Pleiotropic regulatory mechanism through retinoic acid receptor (RAR)/retinoid X receptor (RXR) heterodimer and RXR/RXR homodimer. J Biol Chem. 2007;282:29987–97. doi: 10.1074/jbc.M701700200. [DOI] [PubMed] [Google Scholar]
- 39.Hsu SL, Chen MC, Chou YH, Hwang GY, Yin SC. Induction of p21CIP1/Waf1 and activation of p34cdc2 involved in retinoic acid-induced apoptosis in human hepatoma Hep3B cells. Exp Cell Res. 1999;248:87–96. doi: 10.1006/excr.1999.4397. [DOI] [PubMed] [Google Scholar]
- 40.Zhu H, Zhang L, Wu S, et al. Induction of S-phase arrest and p21 overexpression by a small molecule 2{[3-(2,3-dichlorophenoxy)propyl] amino}ethanol in correlation with activation of ERK. Oncogene. 2004;23:4984–92. doi: 10.1038/sj.onc.1207645. [DOI] [PubMed] [Google Scholar]
- 41.Zhou Y, Wang S, Yue BG, Gobl A, Oberg K. Effects of interferon alpha on the expression of p21cip1/waf1 and cell cycle distribution in carcinoid tumors. Cancer Invest. 2002;20:348–56. doi: 10.1081/cnv-120001180. [DOI] [PubMed] [Google Scholar]
- 42.Yi YW, Kim D, Jung N, Hong SS, Lee HS, Bae I. Gadd45 family proteins are coactivators of nuclear hormone receptors. Biochem Biophys Res Commun. 2000;272:193–8. doi: 10.1006/bbrc.2000.2760. [DOI] [PubMed] [Google Scholar]
- 43.Bornstein G, Bloom J, Sitry-Shevah D, Nakayama K, Pagano M, Hershko A. Role of the SCFSkp2 ubiquitin ligase in the degradation of p21Cip1 in S phase. J Biol Chem. 2003;278:25752–7. doi: 10.1074/jbc.M301774200. [DOI] [PubMed] [Google Scholar]
- 44.Wei CL, Wu Q, Vega VB, et al. A global map of p53 transcription-factor binding sites in the human genome. Cell. 2006;124:207–19. doi: 10.1016/j.cell.2005.10.043. [DOI] [PubMed] [Google Scholar]
- 45.Monte M, Benetti R, Collavin L, Marchionni L, Del Sal G, Schneider C. hGTSE-1 expression stimulates cytoplasmic localization of p53. J Biol Chem. 2004;279:11744–52. doi: 10.1074/jbc.M311123200. [DOI] [PubMed] [Google Scholar]
- 46.Harper JW, Adami GR, Wei N, Keyomarsi K, Elledge SJ. The p21 Cdk-interacting protein Cip1 is a potent inhibitor of G1 cyclin-dependent kinases. Cell. 1993;75:805–16. doi: 10.1016/0092-8674(93)90499-g. [DOI] [PubMed] [Google Scholar]
- 47.Freedman VH, Shin SI. Cellular tumorigenicity in nude mice: correlation with cell growth in semi-solid medium. Cell. 1974;3(4):355–9. doi: 10.1016/0092-8674(74)90050-6. [DOI] [PubMed] [Google Scholar]
- 48.Morse MA, Stoner GD. Cancer chemoprevention: principles and prospects. Carcinogenesis. 1993;14(9):1737–46. doi: 10.1093/carcin/14.9.1737. [DOI] [PubMed] [Google Scholar]
- 49.Lamkin TJ, Chin V, Varvayanis S, Smith JL, Sramkoski RM, Jacobberger JW, Yen A. Retinoic acid-induced CD38 expression in HL-60 myeloblastic leukemia cells regulates cell differentiation or viability depending on expression levels. J Cell Biochem. 2006;97(6):1328–38. doi: 10.1002/jcb.20745. [DOI] [PubMed] [Google Scholar]
- 50.Yen A. Retinoic acid therapy served by ligands cross linking and masking CD38 Leuk Res. 2007;31(4):423–5. doi: 10.1016/j.leukres.2006.07.003. [DOI] [PubMed] [Google Scholar]