Summary
Reprogrammed cellular metabolism is a common characteristic observed in various cancers1,2. However, whether metabolic changes directly regulate cancer development and progression remains poorly understood. Here we show that BCAT1, a cytosolic aminotransferase for the branched-chain amino acids (BCAAs), is aberrantly activated and functionally required for chronic myeloid leukemia (CML). BCAT1 is up-regulated during CML progression and promotes BCAA production in leukemia cells by aminating the branched-chain keto acids. Blocking BCAT1 expression or enzymatic activity induces cellular differentiation and impairs the propagation of blast crisis CML (BC-CML) both in vitro and in vivo. Stable isotope tracer experiments combined with NMR-based metabolic analysis demonstrate the intracellular production of BCAAs by BCAT1. Direct supplementation with BCAAs ameliorates the defects caused by BCAT1 knockdown, indicating that BCAT1 exerts its oncogenic function via BCAA production in BC-CML cells. Importantly, BCAT1 expression not only is activated in human BC-CML and de novo acute myeloid leukemia but also predicts disease outcome in patients. As an upstream regulator of BCAT1 expression, we identified Musashi2 (MSI2), an oncogenic RNA binding protein that is required for BC-CML. MSI2 is physically associated with the BCAT1 transcript and positively regulates its protein expression in leukemia. Taken together, this work reveals that altered BCAA metabolism activated through the MSI2-BCAT1 axis drives cancer progression in myeloid leukemia.
To understand the contribution of α-amino acid (AA) metabolism to the cancer progression of CML, we analyzed blood AA levels in murine models that recapitulate the chronic and blast crisis phases of human CML3,4. Using amine-specific fluorescent labeling coupled with high-performance liquid chromatography, sixteen AAs were quantified in the blood plasma from leukemic mice (Extended Data Fig. 1a–d). Mice bearing BC-CML showed moderate but significant elevations of plasma glutamate, alanine and the branched-chain amino acids (BCAAs; namely, valine, leucine and isoleucine) compared to CP-CML mice, indicating hyperaminoacidemia (Extended Data Fig. 1e). Intracellular levels of BCAAs and proline were higher in BC-CML, whereas intracellular glutamate and alanine were comparable in the two disease phases (Fig. 1a). These results suggest that increased BCAA uptake or metabolism may contribute to CML progression. We analyzed the gene expression and found no significant up-regulation of known BCAA transporters in BC-CML compared with CP-CML (data not shown). Leucine import into BC-CML cells was not greater than into CP-CML cells (Extended Data Fig. 1f), indicating that increased BCAA uptake does not explain the higher BCAA levels in BC-CML. To examine the possibility of altered intracellular BCAA metabolism, we next analyzed the expression of genes encoding AA metabolic enzymes and found that the branched-chain amino acid aminotransferase 1 (Bcat1) was more highly expressed in BC-CML than in CP-CML at both the mRNA and protein levels (Fig. 1b–c, Extended Data Fig. 1g–h). In contrast, normal hematopoietic stem/progenitor cells (HSPCs) from healthy mice had very low levels of Bcat1 expression (Lin− Sca-1+ cKit+ (LSK) population; Fig. 1b), and normal tissues did not show detectable Bcat1 expression except for the brain and testis (Extended Data Fig. 1i). Bcat1 encodes an evolutionarily conserved cytoplasmic aminotransferase for glutamate and BCAAs, constituting a regulatory component of cytoplasmic amino and keto acid metabolism5 (Fig. 1d). Bcat2, a paralog encoding the mitochondrial BCAA aminotransferase, and alanine and aspartate aminotransferases did not show differential expression between CP- and BC-CML (Extended Data Fig. 1g–l).
Figure 1. Activated BCAA production by BCAT1 in BC-CML.
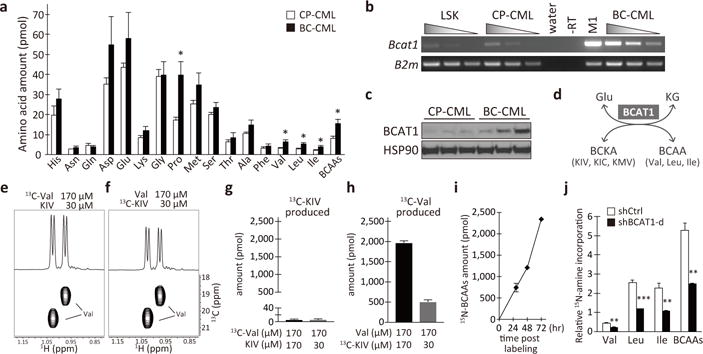
a, Intracellular amino acid levels in CP-CML (n=7, open bars) and BC-CML (n=9, closed bars). Amounts per 2 × 10⁵ cells. b, Bcat1 expression in normal and leukemic hematopoietic cells. Serial cDNA dilutions were used for RT-PCR analysis. Normal LSK cells, CP- and BC-CML cells, M1 myeloid cells and no reverse transcriptase (-RT) and water controls are shown. B2m, beta-2-microglobulin. c, BCAT1 protein expression in primary mouse leukemia (n=3 each). d, Schematics of the reaction catalyzed by BCAT1. KG, alpha-ketoglutarate. e–h, Intracellular Val production from KIV captured by 1H-13C HSQC analysis. (e, f) 1D (top) and 2D (bottom) HSQC spectra. The amounts of (g) 13C-KIV and (h) 13C-Val produced per one million cells are shown (n=3 each). i, 15N-amine incorporation into BCAAs. The amounts per one million cells. n=3 per time point. j, BCAT1-dependent production of BCAAs. The amounts of 15N-BCAAs produced are normalized with that of 15N-Glu/Gln. n=3 each. *p<0.05, **p<0.01, ***p<0.001 by two-tailed t-test. All data are mean ± s.e.m.
Although BCAT1 catalyzes transamination in both directions, the breakdown of BCAAs is the predominant reaction in most cell types6. In order for BCAT1 to generate BCAAs via the reverse reaction, the corresponding branched-chain keto acids (BCKAs), as well as glutamate, must be present as substrates. We found all three BCKAs, keto-isovalerate (KIV), keto-isocaproate (KIC) and keto-methylvalerate (KMV), were present in both the blood plasma and leukemia cells (Extended Data Fig. 2a–d). In BC-CML cells, BCKAs were present at concentrations equivalent to 22–55% of the corresponding BCAAs, suggesting that intracellular BCKAs can serve as substrates for BCAA production (Extended Data Fig. 2e). Next, we examined whether BCAAs are produced through BCAT1 transamination reactions in leukemia cells by stable-isotope tracer experiments with 13C-valine or 13C-KIV. Intracellular 13C-labeled metabolites in K562 human BC-CML cells were analyzed using one- (1D) and two-dimensional (2D) 1H-13C heteronuclear single bond correlation (HSQC) analysis by high-field NMR spectroscopy (Fig. 1e–h, Extended Data Fig. 3). HSQC analysis detects only metabolites that have incorporated 13C. To determine whether KIV is converted to valine, cells were cultured in media supplemented with uniformly-labeled [(U)-13C] KIV and non-labeled valine at physiological concentrations (30 and 170μM, respectively) and analyzed for intracellular 13C-metabolites. After 15 min of labeling, the generation of 13C-valine was clearly observed, indicating the efficient intracellular production of valine from KIV (Fig. 1f, h). In contrast, 13C-KIV formation was barely detectable in the cells cultured with non-labeled KIV and [(U)-13C]-valine (Fig. 1e, g). Our observation of intracellular 13C-valine signals indicates its transport into BC-CML cells. We also detected robust signals for 13C-KIV when present (Extended Data Fig. 3d, f). The formation of valine from KIV, but not the breakdown of valine to KIV, was also observed when we used equal concentrations of KIV and Val in the labeling media (170μM each; Fig.1g–h). We did not detect KIC formation from 13C-leucine either (Extended Data Fig. 3g–i). These results indicate that little, if any, BCAAs are catabolized to BCKAs in leukemia cells. To further provide evidence for the intracellular BCAA production through transamination, we performed alternative labeling experiments to track the fate of the amine group of glutamate. We cultured K562 cells with 15N-amine-labeled glutamine, which is metabolized to 15N-amine-glutamate by glutaminase upon cellular intake, and analyzed the subsequent labeling of BCAAs via 1H NMR and 1H-15N heteronuclear multiple bond correlation (HMBC) analysis. HMBC analysis detects only metabolites that have incorporated 15N, whereas 1H NMR detects any compounds containing protons (Extended Data Fig. 4a–f). At 29–72 h post-labeling, we detected 15N-amine-labeled BCAAs, indicating transamination from glutamine to BCAAs (Fig. 1i). By 72 h, the 15N-amine-labeled BCAAs had accumulated to fractional abundances ranging from 24 to 39% (Extended Data Fig. 4g), indicating a significant contribution of transamination to the intracellular BCAA pool. Lentiviral BCAT1 knockdown resulted in greater than a 50% decrease in the amount of intracellular BCAAs produced (Fig. 1j). These data demonstrate that BCKA transamination by BCAT1 contributes to the BCAA pool in leukemia cells.
Given that Bcat1 is highly expressed and augments intracellular BCAAs in BC-CML, Bcat1 may functionally contribute to the acute properties of BC-CML. To test this possibility, we inhibited Bcat1 expression using a short hairpin RNA (shRNA)-mediated gene knockdown approach. We sorted the immature lineage-negative (Lin−) cells from primary BC-CML samples, a population that contains the leukemia-initiating cells of this cancer, and introduced two independent retroviral shRNA constructs (Extended Data Fig. 1j; shBcat1-a and shBcat1-b). Both constructs inhibited Bcat1 expression in BC-CML compared with a non-targeting negative control shRNA (shCtrl) (Extended Data Fig. 5a–c). Bcat1 knockdown resulted in significantly smaller colonies and a 40–60% reduction in the colony-forming ability relative to a control (Fig. 2a). The co-introduction of a shRNA-resistant Bcat1 cDNA rescued the reduced clonogenic potential (Extended Data Fig. 5d). As an alternative approach to gene knockdown, we treated BC-CML cells with gabapentin (Gbp), a chemical inhibitor of BCAT1. Gbp is a structural analog of leucine and specifically and competitively inhibit the transaminase activity of BCAT1 but not that of BCAT27. BC-CML cells plated with Gbp formed smaller colonies and showed a dose-dependent impairment in clonogenic growth (Fig. 2b). In contrast, normal HSPCs were only minimally affected by gene knockdown or Gbp treatment (Extended Data Fig. 5e–f). These data suggest that BCAT1 inhibition may selectively impair the propagation of leukemia without affecting normal hematopoiesis.
Figure 2. Bcat1 is essential for BC-CML propagation and differentiation arrest.
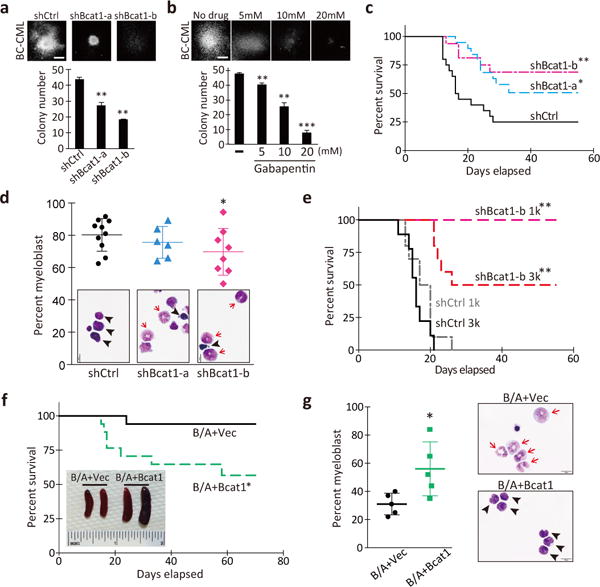
a, b, Colony-forming ability of primary Lin− BC-CML cells (a) transduced with the indicated shRNAs, or (b) plated with the indicated concentrations of gabapentin or vehicle (-). 1,000 cells/well (n=3). Photomicrographs show representative colonies formed under each condition. Scale bar, 500 μm. c, Bcat1 knockdown impaired BC-CML development in vivo. BC-CML cells expressing the indicated constructs were transplanted, and the survival of the recipients was monitored. shCtrl, n=20; shBcat1-a, n=19; shBcat1-b, n=16. d, g, Percentage of immature myeloblasts in leukemic mice. Photomicrographs of Wright’s stained leukemia cells. Arrowheads, immature myeloblasts; arrows, differentiating myelocytes and mature band cells. Scale bar, 10 μm. e, Survival curve of mice serially transplanted with Lin− cells from primary shRNA-expressing leukemias. 1,000 cells/mouse (1k), n=10 for shCtrl, n=8 for shBcat1-a; and 3,000 cells/mouse (3k), n=9 for shCtrl, n=10 for shBcat1-a. f, Survival curve of mice transplanted with LSK cells infected with BCR-ABL1 and the vector-control or Bcat1. n=17 each. Inset, spleens from the indicated groups. Error bars indicate s.e.m. *p<0.05, **p<0.01, ***p<0.001 by two-tailed t-test (d, g) or log-rank test (c, e, f).
To examine whether Bcat1 loss affects the propagation of BC-CML in vivo, Lin− cells expressing shBcat1 were transplanted into conditioned recipient mice. Whereas 75% of the recipients transplanted with control cells succumbed to the disease within 30 days, only 47% (shBcat1-a) and 31% (shBcat1-b) of the mice transplanted with Bcat1-knockdown cells developed the disease, and more than half of these mice survived even when followed out to 60 days (Fig. 2c). Among the mice that developed disease with Bcat1 knockdown, most had leukemia that was characterized by differentiated granulocytes and lower levels of immature myeloblasts (Fig. 2d, Extended Data Fig. 4g). They also displayed a lower frequency of immature Lin− cells than control leukemia (Extended Data Fig. 5h), indicating that the loss of Bcat1 induced differentiation and impaired the leukemia-initiating cell activity. Consistent with these phenotypes, serial transplantation of the leukemia cells revealed that while all the control leukemia propagated the disease, none of the mice transplanted with Bcat1-knockdown leukemia cells succumbed to the disease (1k; Fig. 2e). In addition, we established a doxycycline (Dox)-inducible Bcat1 knockdown system (i-shBcat1) and examined the impact of Bcat1 loss on the disease maintenance. Ten days post-transplantation with BC-CML cells infected with i-shBcat1, leukemic engraftment was assessed in each recipient, and Dox treatment was initiated (Extended Data Fig. 5i–j). While almost all the mice that were transplanted with control cells and the non-Dox-treated mice developed leukemia, more than half of the Dox-treated i-shBcat1 mice remained disease-free (Extended Data Fig. 5k), indicating that Bcat1 is required for the continuous propagation of BC-CML. At the cellular level, we did not observe enhanced apoptosis or a decrease in actively cycling cells by Bcat1 knockdown (Extended Data Fig. 5l–m). These results demonstrate that Bcat1 is critical for the sustained growth and maintenance of leukemia-initiating cells in BC-CML.
We next examined whether the enforced expression of Bcat1 could drive blastic transformation in hematopoietic cells. Although we observed a significant increase in Bcat1 expression compared with the vector control, Bcat1 expression alone did not enhance the colony-forming ability of either LSK or Lin− c-Kit+ hematopoietic cells isolated from normal bone marrow (Extended Data Fig. 6a–b). To determine whether BCR-ABL1 cooperates with Bcat1 overexpression to confer an aggressive growth phenotype, we transduced normal HSPCs with Bcat1 and BCR-ABL1. Compared with the vector control, the combinatorial expression promoted clonogenic growth in vitro (Extended Data Fig. 6c), and the transplantation of the cells led to significantly elevated leukemia burdens (Extended Data Fig. 6d–e), splenomegaly and increased mortality in the recipient mice (Fig. 2f), with a concomitant increase in plasma BCAA levels (Extended Data Fig. 6f). Accordingly, leukemia that developed in response to Bcat1 overexpression exhibited a highly immature myeloblastic morphology compared to the control (Fig. 2g, Extended Data Fig. 6g). These data indicate that activated Bcat1 mediates the blastic transformation of CP-CML cells.
Our results demonstrate that Bcat1 is essential for the development of BC-CML in mice, while normal bone marrow HSPCs show a very limited dependence on this metabolic enzyme. To investigate the contribution of BCAT1 to human leukemia, we looked at a panel of 13 peripheral blood samples from healthy and leukemic subjects and found human BCAT1 expression was higher in BC-CML than in either normal or CP-CML cells (Fig. 3a). To determine whether this expression pattern reflects a general trend in human CML, we analyzed BCAT1 levels in a GEO dataset of 113 CML patient samples8. This focused analysis revealed a significant elevation in BCAT1 expression as the disease progresses from the chronic to the accelerated phase and then to the blast crisis phase (Fig. 3b). On average, BCAT1 expression was 15-fold higher in BC-CML than in CP-CML. We did not find significant changes in BCAT2 expression, which is consistent with the results from the mouse models (Fig. 3c, Extended Data Fig. 1g). These data indicate that activation of BCAT1 is a shared characteristic in the progression of human CML. Lentiviral BCAT1 knockdown or Gbp treatment markedly inhibited the colony-forming ability of K562 human BC-CML (Extended Data Fig. 7a–d) and patient-derived primary leukemia cells (Fig. 3d–e, Extended Data Fig. 7e–f). Interestingly, we observed BCAT1 activation in primary human acute myeloid leukemia as well (AML; Fig. 3f), and Gbp effectively inhibited the clonal growth of human AML cell lines and primary de novo AML cells (Fig. 3g, Extended Data Fig. 7g–i). Moreover, BCAT1 expression levels predict disease outcome in patient cohorts. Cases from the TCGA AML dataset were divided into quartiles based on BCAT1 expression levels (Extended Data Fig. 7j), and we found that the median survival time was 46% shorter in the BCAT1-high group (427 vs. 792 days; Fig. 3h). These results demonstrate an essential role for BCAT1 in the pathogenesis of a wide array of human myeloid malignancies.
Figure 3. BCAT1 activation and requirement in human myeloid leukemia.
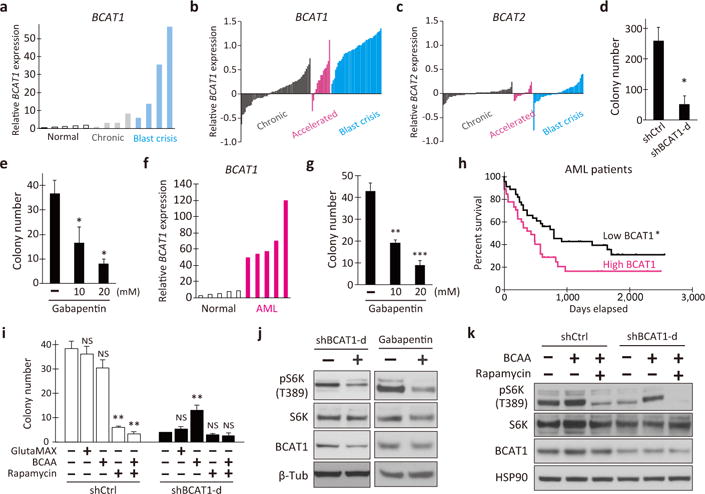
a, BCAT1 expression in healthy subjects (n=5) and in patients with chronic and blast crisis CML (n=4 each) at IMSUT Hospital, the University of Tokyo. b–c, Microarray data analysis of (b) BCAT1 and (c) BCAT2 expression in 57 chronic (gray), 15 accelerated (pink) and 41 blast crisis (blue) phase patients. The bars represent the normalized expression in each specimen. d, e, Colony-forming ability of primary human BC-CML cells treated with (d) shBCAT1 or (e) Gbp. n=3 each. Two independent patient specimens were tested. f, BCAT1 expression in healthy subjects and de novo AML patients at IMSUT Hospital (n=5). g, Colony-forming ability of Gbp-treated primary human AML cells. h, Kaplan-Meier analysis of overall survival in the AML patient cohorts with low (bottom quartile) or high (top quartile) BCAT1 expression. n=93 in each cohort. i, BCAA supplementation augmented the colony-forming ability of BCAT1-knockdown K562 cells (n=3). j, Western blotting for the indicated proteins. K562 cells treated with shBCAT1-d or 20 mM Gbp for 24 h. (-), shCtrl or vehicle controls. k, Effect of BCAA on mTORC1 pathway activation in BCAT1-knockdown K562 cells. Cells were treated with or without BCAA or rapamycin, and analyzed at 24 h post-treatment. Error bars indicate s.e.m. NS, not statistically significant (p>0.05). *p<0.05, **p<0.01, ***p<0.001 by two-tailed t-test (d, e, g, i) or log-rank test (h).
To understand how the BCAT1-driven change in metabolism promotes leukemia growth, we analyzed intracellular AA concentrations upon BCAT1 inhibition and found that all three BCAAs were significantly reduced by shBCAT1 or Gbp treatment compared with the controls (Extended Data Fig. 8a–b). Interestingly, the addition of BCAAs, but not alanyl-glutamine (GlutaMax), functionally suppressed the reduction of colony-forming ability caused by BCAT1 knockdown (Fig. 3i), suggesting that BCAT1 enhances clonogenic growth through BCAA production via BCKA reamination. BCAAs, particularly leucine, activate the mTORC1 pathway via cytosolic leucine sensor proteins, which integrate multiple signals from nutrient sensing and growth factor stimuli to promote cell growth9–12. Thus, we examined whether reduced BCAA production by BCAT1 inhibition results in the attenuation of the mTORC1 signal. Indeed, BCAT1 blockade by either shRNA or Gbp treatment significantly reduced the phosphorylation of S6 kinase (pS6K), a downstream target of mTORC1 kinase (Fig. 3j), suggesting BCAT1 activation of the mTORC1 pathway. We observed no apparent changes in the levels of phosphorylated AKT upon BCAT1 inhibition, suggesting a predominant contribution of BCAA nutrient signals to the activation of mTORC1 (Extended Data Fig. 8c). Consistently, the mTORC1 inhibitor rapamycin reversed the BCAA-induced suppression of colony formation (Fig. 3i) and the BCAA-induced increase in pS6K (Fig. 3k).
To further investigate the BCAT1-mediated regulation of CML progression, we performed gene correlation analyses using tumor gene expression datasets available in the GEO and TCGA databases. We found that BCAT1 and MSI2 are often co-expressed in several types of cancer, including leukemias, colorectal and breast cancers (Extended Data Fig. 9a–b). MSI2 is a member of the evolutionarily conserved Musashi RNA binding protein family, which regulates cell fates during development and in multiple adult stem cell systems in metazoans13–15. At the molecular level, Musashi proteins bind to r(G/A)U1-3AGU sequences (MSI binding elements, MBEs) and post-transcriptionally regulate gene expression via mRNA binding16,17. Importantly, MSI genes are aberrantly activated in human malignancies, such as gliomas and breast and colorectal cancers18,19. In human BC-CML, the MSI2 gene is up-regulated and functionally required for the progression of this leukemia20,21. To determine whether BCAT1 is a direct target of the MSI2 RNA binding protein, we analyzed the BCAT1 mRNA sequence and found 40 putative MBEs in the 3′-untranslated region (3′-UTR; Extended Data Fig. 9c). To test whether MSI2 binds to the BCAT1 transcripts, we expressed a FLAG-tagged MSI2 protein in K562 cells and performed RNA immunoprecipitation (RIP). FLAG-MSI2 co-precipitated the BCAT1 transcripts with a >1,500-fold enrichment relative to the vector control (Fig. 4a). In contrast, when RIP was performed with a mutant MSI2 protein in which three phenylalanine residues essential for RNA binding were replaced with leucine16, the amount of the BCAT1 mRNA recovered was markedly diminished (Fig. 4a, RBD), indicating that the co-precipitation of BCAT1 transcript requires the RNA binding activity of MSI2. The transcripts for beta-2-microglobulin (B2M) or c-Myc oncogene (MYC) contain only one copy of a putative MBE in their 3′-UTRs (data not shown), and MSI2 RIP did not enrich B2M or MYC mRNAs as efficiently as BCAT1 (Fig. 4a). Furthermore, RIP with an anti-MSI2 antibody showed that endogenous MSI2 proteins bound to BCAT1 transcripts, while B2M or MYC mRNAs exhibited minimal enrichment relative to that of an IgG control (Fig. 4b), indicating that MSI2 is specifically associated with the BCAT1 transcripts. Because MSI2 knockdown reduced the levels of BCAT1 protein and phospho-S6K (Extended Data Fig. 9d), the binding of MSI2 to BCAT1 mRNA positively regulates BCAT1 translation and mTORC1 activation. Importantly, BCAT1 over-expression (Fig. 4c) and BCAA supplementation (Fig. 4d) effectively suppressed the attenuation of the colony-forming ability caused by MSI2 knockdown, with a concomitant increase in pS6K levels in a rapamycin-sensitive manner (Fig. 4e). The levels of AKT phosphorylation were unaffected by shMSI2 (Extended Data Fig. 8c). Collectively, our work presented here demonstrates an essential role for the MSI2-BCAT1 axis in myeloid leukemia and provides a proof-of-principle for inhibiting the BCAA metabolic pathway to regulate CML progression (Fig. 4f).
Figure 4. RNA binding protein MSI2 mediates BCAT1 activation in BC-CML.
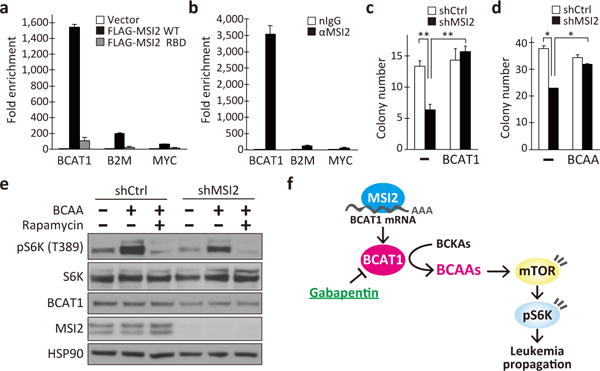
a, b, RNA immunoprecipitation (RIP) with (a) anti-FLAG antibody from K562 cells expressing empty vector, FLAG-tagged MSI2 (WT) or FLAG-MSI2 with defective RNA binding domains (RBD), or (b) RIP with anti-MSI2 (αMSI2) or a control IgG (nIgG) from K562 cells. Co-immunoprecipitated RNAs were analyzed for the enrichment of BCAT1, beta-2-microglobulin (B2M) and c-MYC transcripts. n=3 each. c, d, Effect of (c) BCAT1 overexpression and (d) BCAA supplementation on the colony-forming ability of MSI2-knockdown K562 cells (n=3). (-), shCtrl or vehicle controls. e, Effect of nutrient supplementation on mTORC1 pathway activation in MSI2-knockdown K562 cells. f, Schematic model of the MSI2-BCAT1-BCAA axis in BC-CML. Error bars indicate s.e.m. *p<0.05, **p<0.01, by two-tailed t-test.
The up-regulation and functional requirements of BCAT1 have been reported in glioblastoma and in colorectal and breast tumors22,23. Interestingly, Musashi proteins also regulate the same spectrum of cancers including myeloid leukemia18–21,24,25, suggesting a highly conserved role for the MSI-BCAT1 pathway in multiple cancer types. Despite the conservation of this pathway, the metabolic role of BCAT1 seems distinct and dependent on the tissue of origin; in the brain, BCAT1 catalyzes BCAA breakdown and glutamate production to enhance tumor growth in glioblastoma23, whereas BCAT1 promotes BCAA production in leukemia. Mayers et al. recently showed that two different types of tumors, specifically pancreatic ductal adenocarcinoma (PDAC) and non-small cell lung carcinoma (NSCLC)26, exhibit different usages of BCAAs. Despite the same initiating events of Kras activation and p53 deletion, NSCLC cells actively utilize BCAAs by enhancing their uptake and oxidative breakdown to BCKAs, whereas PDAC cells display decreased uptake and thus little dependency on BCAAs. Consistently, BCAT1 and BCAT2 are required for tumor formation in NSCLC but not in PDAC. Although BCAT1 is functionally required for tumor growth in a broad range of malignancies, these reports and our studies highlight the context-dependent role of the BCAT1 metabolic pathway in cancer.
Methods
Mice
C57BL6/J mice were from the Jackson Laboratory. Mice were bred and maintained in the facility of the University Research Animal Resources at University of Georgia. All mice were 8–16 weeks old, age- and sex-matched and randomly chosen for experimental use. No statistical methods were used for sample size estimates. All animal experiments were performed according to protocols approved by the University of Georgia Institutional Animal Care and Use Committee.
Cell isolation, analysis and sorting
Cells were suspended for cell sorting in Hanks’ balanced salt solution (HBSS) containing 5%(vol/vol) fetal bovine serum (FBS) and 2 mM EDTA as previously described27. The following antibodies were used to define lineage positive cells: 145-2C11 (CD3ε), GK1.5 (CD4), 53–6.7 (CD8), RB6-8C5 (Ly-6G/Gr1), M1/70 (CD11b/Mac-1), TER119 (Ly-76/TER119), 6B2 (CD45R/B220), and eBio1D3 (CD19). Red blood cells were lysed with RBC Lysis Buffer (eBioscience) before staining for lineage markers. For the Lin− Sca-1+ cKit+ (LSK) bone marrow cell sorting, the antibodies 2B8 (cKit/CD117) and D7 (Sca-1/Ly-6A/E) antibodies were also used. To determine donor-derived chimerism in the transplantation-based assays, peripheral blood from the recipients was obtained by the submandibular bleeding method and prepared for analysis as previously described20. All antibodies were purchased from eBioscience. Apoptosis assays were performed by staining cells with Annexin V and 7-AAD (BioLegend). Cell cycle status was analyzed by staining cells with 2.5 μg/ml PI containing 0.1% BSA and 2 μg/ml RNase after fixation with 70% ethanol. Flow cytometric analysis and cell sorting were carried out on the Moflo XDP, Cyan ADP (Beckman Coulter) or S3 (Bio-Rad), and the data were analyzed with FlowJo software (Tree Star Inc.).
Viral constructs and production
Retroviral BCR-ABL1 and NUP98-HOXA9 vectors and lentiviral FG12-UbiC-GFP vector were obtained from Addgene. Mouse Bcat1 cDNA (IMAGE clone ID 30063465) was cloned into MSCV-IRES-GFP and Human BCAT1 cDNA (NITE clone ID AK056255) was cloned into FG12-Ubc-hCD2. The short hairpin RNA constructs against Bcat1 (shBcat1) were designed and cloned in MSCV-LTRmiR30-PIG (LMP) vector from Open Biosystems or TtRMPVIR from Addgene according to their instructions. The target sequences are 5′-CCCAGTCTCTGATATTCTGTAC-3′ for shBcat1-a, 5′- TCCGCGCCGTTTGCTGGAGAAA-3′ for shBcat1-b and 5′-CTGTGCCAGAGTCCTTCGATAG-3′ for luciferase as a negative control (shCtrl). Lentiviral short hairpin RNA (shRNA) constructs were cloned in FG12 essentially as described previously28. The target sequences are 5′-CGCAGAGTGTACCGGAGA-3′ for shBCAT1-c, 5′-TGCCCAATGTGAAGCAGT-3′ for shBcat1-d and 5′-TGCGCTGCTGGTGCCAAC-3′ for luciferase as a negative control. Virus was produced in 293FT cells transfected using polyethylenimine with viral constructs along with VSV-G and gag-pol. For lentivirus production Rev was also co-transfected. Viral supernatants were collected for two days followed by ultracentrifugal concentration at 50,000× g for 2h.
Cell culture and colony formation assays
The human BC-CML cell line K562, the human acute leukemia cell lines MV4-11 and U937 were maintained in Roswell Park Memorial Institute 1640 medium (RPMI-1640) with 10% FBS, 100 IU/ml penicillin and 100 μg/ml streptomycin. The human acute promyelocytic leukemia cell line HL60 was maintained in RPMI supplemented with 20% FBS. All human cell lines were obtained from ATCC, and cell line authentication testing was performed by ATCC-standardized STR analysis to verify their identity in July 2016. For the colony forming assays, the cells were transduced with lentiviral shRNA and plated in triplicate in 1.2% methylcellulose medium (R&D systems) supplemented with 100IU/ml penicillin and 100μg/ml streptomycin, 10% FBS. Where indicated, either BCAAs (L-Leucine, L-Valine, L-Isoleucine, 4 mM each, Sigma-Aldrich), L-alanyl-L-glutamine (4 mM, GlutaMax™, Life Technologies), rapamycin (50 nM, Tocris) or gabapentin (Gbp; Tokyo Chemical Industry Co.) was added to the medium. Gbp was freshly dissolved in PBS before use. Colonies were scored on days 9 to 14. For liquid culture of murine cells, freshly isolated adult LSK cells or Lin− BC-CML cells were plated into a 96-well U bottom plate in X-Vivo15 (with Gentamicin and Phenol Red; Lonza) supplemented with 50 μM 2-mercaptoethanol, 10% FBS, 100 ng/ml stem cell factor (SCF, eBioscience) and 20 ng/ml thrombopoietin (TPO, Peprotech). For the BC-CML and LSK colony formation assays, BCR-ABL+ NUP98-HOXA9+ or infected construct-positive cells were sorted and plated in triplicate in Iscove’s modified medium (IMDM)-based methylcellulose medium (Methocult M3434, StemCell Technologies). Colonies were scored on days 7 to 10.
Generation and analysis of leukemic mice
Mice bearing CP- and BC-CML were generated essentially as previously described3,4,29–31. In brief, CP-CML was modeled by transducing the oncogene BCR-ABL1 into hematopoietic stem/progenitor cells (HSPCs) defined by the LSK surface marker phenotype from normal bone marrow, which were transplanted into conditioned recipient mice. BC-CML was modeled by transplanting LSK cells infected with two oncogenes, BCR-ABL1 and NUP98-HOXA9, which are associated with myeloid BC-CML in humans. LSK cells were sorted from healthy C57BL6/J bone marrow and cultured in X-Vivo15 media supplemented with 50 μM 2-mercaptoethanol, 10% FBS, 100 ng/ml SCF and 20 ng/ml TPO. After incubation overnight, cells were infected with retroviruses carrying the oncogenes. Viruses used were as follows: MSCV-BCR-ABL-IRES-YFP to generate CP-CML, or MSCV-BCR-ABL-IRES-YFP and MSCV-NUP98-HOXA9-IRES-tNGFR to generate BC-CML. Cells were harvested 48 h after infection and transplanted retro-orbitally into groups of C57BL6/J mice. Recipients were lethally irradiated (9.5 Gy) for CP-CML and sublethally (6 Gy) for BC-CML. For Bcat1 overexpression, LSK cells were infected with MSCV-BCR-ABL-IRES-YFP and MSCV-Bcat1-IRES-GFP, and doubly infected cells were FACS-purified and transplanted into recipients that were sublethally irradiated. For Bcat1 knockdown by retroviral shRNA transduction, the Lin− population from BC-CML cells was sorted and infected with either control shCtrl (against luciferase) or shBcat1-a/b (against Bcat1) retrovirus for 48 h. Infected cells were sorted based on GFP expression, and 1,000 or 2,000 cells were transplanted in sublethally irradiated C57BL6/J recipients. For conditional Bcat1 knockdown by a Dox-inducible shRNA system, animals were analyzed for donor chimerism at day 10 post-transplantation, and then Dox treatment was initiated by feeding Dox-containing rodent chow (0.2 mg/g diet; S3888, BioServ). After transplantation, recipient mice were maintained on antibiotic water (sulfamethoxazole/trimethoprim) and evaluated daily for signs of morbidity, weight loss, failure to groom, and splenomegaly. Premorbid animals were sacrificed, and relevant tissues were harvested and analyzed by flow cytometry and histopathology. For secondary BC-CML transplantations, cells recovered from terminally ill primary recipients were sorted for Lin− donor cells and transplanted into secondary recipients. Where indicated, sorted live BC-CML cells from the spleen were cytospun and stained with Wright’s stain solution (Harleco) for cytopathologic evaluation by a board-certified veterinary pathologist (T. N.).
Primary human leukemia samples
Patient blood samples were obtained at the Institute of Medical Science, the University of Tokyo (IMSUT) Hospital with written informed consent according to the procedures approved by the Institutional Review Board. Mononuclear cells from the subjects were viably frozen and stored in liquid nitrogen. For in vitro colony formation with BCAT1 knockdown, primary hCD34+ cells sorted from patient bone marrow samples were cultured in IMDM supplemented with 10% FBS, 100 IU/ml penicillin and 100 μg/ml streptomycin, 55 μM 2-mercaptoethanol, SCF, IL-3, IL-6, FLT3L and TPO. After 24 h of culture, the cells were transduced with lentiviral shRNA (cloned in FG12-UbiC-GFP), and the GFP-positive infected cells were sorted at 48 h, and 5,000 - 50,000 cells were plated in complete methylcellulose medium (Methocult H4435, StemCell Technologies). For the colony forming assays with Gbp, sorted hCD34+ cells from the primary patient specimens were cultured in complete methylcellulose medium with the indicated concentrations of Gbp. Colonies were scored on days 9 to 14.
Bioinformatic analysis of human gene expression
For the focused gene expression analysis of BCAT1, BCAT2 and MSI2 in human CML progression, the GEO dataset GSE4170 was retrieved and analyzed using Python v2.7 and the SciPy statistical toolkit (http://www.scipy.org/). Pearson correlation coefficients were used to find patterns of coexpression. For coexpression analysis of BCAT1 and MSI2 across multiple cancer types, the GEO datasets GSE14671 (CML), GSE10327 (medulloblastoma), GSE20916 (colorectal), GSE14548 (breast) and TCGA datasets LAML (AML) and LUAD (lung adenocarcinoma) were collected and analyzed in a similar fashion.
Realtime and standard RT-PCR analysis
Total cellular RNAs were isolated using RNAqueous-Micro kit (Ambion) and cDNAs were prepared from equal amounts of RNAs using Superscript III reverse transcriptase (Life Technologies). For standard PCRs, the reactions were performed with DreamTaq PCR Master Mix (Life Technologies), cDNA and 0.5 μM of each primer. PCR conditions were as follows: 1 min at 94°C, followed by 35 cycles at 94°C for 30 s, 58°C for 30 s, and 72°C for 30 s. PCR primer sequences are as follows. B2m-F1, 5′ –GTAGCCTCTGCCATAGGTTGC-3′; B2m-R2, 5′ –CCATACTGGCATGCTTAACTCTG-3′; Bcat1-F1, 5′ –TGTGGCTGTACGGCAAGGACAAC-3′; Bcat1-R2, 5′ -GTAGCTCGATTGTCCAGTCACT-3′. Quantitative real-time PCRs were performed using EvaGreen® qPCR Master Mix (Bio-Rad) on an iQ5 (Bio-Rad), or using TaqMan Gene Expression Assays on an Applied Biosystems® 7500 Real-Time PCR Systems (Life Technologies). Results were normalized to the level of β-2-microglobulin. PCR primer sequences are as follows. mB2m-F, 5′ –ACCGGCCTGTATGCTATCCAGAA-3′ ; mB2m-R, 5′ –AATGTGAGGCGGGTGGAACTGT-3′; hB2M-F, 5′ –ATGAGTATGCCTGCCGTGTGA-3′; hB2M-R, 5′ –GGCATCTTCAAACCTCCATG-3′; hBCAT1-F, 5′ –TGGAGAATGGTCCTAAGCTG-3′; hBCAT1-R, 5′ –GCACAATTGTCCAGTCGCTC-3′; hMYC-F, 5′ –GAGCAAGGACGCGACTCTCC-3′; hMYC-R, 5′ –GCACCGAGTCGTAGTCGAGG-3′. Following genes were analyzed with TaqMan Gene Expression Assays: Bcat1 (Mm00500289_m1), Bcat2 (Mm00802192_m1), Gpt1 (Mm00805379_g1), Gpt2 (Mm00558028_m1), Got1 (Mm00494698_m1), Got2 (Mm00494703_m1).
Amino acid and keto acid quantification
Leukemia cells or peripheral blood samples drawn from mice bearing myeloid leukemia were used for amino acid and keto acid analysis by high-performance liquid chromatography (HPLC)-fluorescence detection, as described32–34. In brief, two hundred thousand live leukemia cells per sample were sorted and washed twice with ice-cold PBS to remove media components prior to amino acid extraction. The blood plasma was prepared by centrifugation of the peripheral blood samples at 2,000 × g at 4°C for 10 min. Plasma fractions were then treated with 45% methanol/45% acetonitrile containing 6-aminocaproic acid (internal standard for amino acid analysis) or α-ketovalerate (internal standard for keto acid analysis) on ice for 10 min. Cell samples were treated with 80% methanol instead of 45% methanol/acetonitrile mixture. After removing the insoluble particles by centrifugation, the supernatants were collected and dried using a SpeedVac at 30–45°C. For amino acid quantification, the dried samples were treated with the amine-reactive 4-fluoro-7-nitro-2,1,3-benzoxadizole (NBD-F) to derivatize the amino acids. HPLC separation of NBD-amino acids was carried out on an Inertsil ODS-4 column (3.0 × 250 mm, 5 μm, GL Sciences, Tokyo, Japan) at a flow rate of 0.6 ml min−1. We used two types of mobile phase conditions for the separation of 16 amino acids. The mobile phases included (A) 25 mM citrate buffer containing 25 mM sodium perchlorate (pH 6.2) and (B) water/acetonitrile (50/50, v/v). The gradient conditions were as follows: t=0 min, 10% B; t=20 min, 50% B; and t=30 min, 100% B. For NBD-Asn, Ser, Thr, Gln and Phe analysis, 25 mM citrate buffer containing 25 mM sodium perchlorate (pH 4.4) was used as the mobile phase A. NBD-amino acids were detected with excitation and emission wavelengths of 470 and 530 nm, respectively. For keto acid quantification, dried samples were treated with o-phenylenediamine (OPD) to derivatize alpha-keto acids, followed by liquid-liquid extraction with ethyl acetate. HPLC separation of OPD-keto acids was carried out on an Inertsil ODS-4 column (3.0 × 250 mm, 5 μm) at a flow rate of 0.6 ml min−1. Mobile phase was water/methanol (55/45, v/v). The fluorescence detection was carried out at the emission wavelength of 410 nm with excitation of 350 nm.
Measurement of leucine uptake in primary mouse leukemia cells
Primary mouse leukemia cells from the spleens of the mice bearing myeloid leukemia were used for the analysis of leucine uptake essentially as described previously35,36. In brief, live leukemia cells were sorted and washed with HBSS to remove media components. The cells were incubated at 37°C for 1–3 min with pre-warmed HBSS containing 10 μM [(U)-14C]-L-leucine (Moravek Inc., specific activity, 328 mCi/mmol). The cells were subseuently washed twice with cold HBSS and lysed using 100 mM NaOH. The solubilized cell lysates were mixed with the EcoLume liquid scintillation cocktail (MP Biomedicals), and radioactivity was measured using an LS6500 liquid scintillation counter (Beckman Coulter). Leucine uptake was quantified using a calibration curve of [14C]-L-leucine reference standard samples.
NMR-based metabolic analysis
Cells were cultured and labeled in media supplemented with either 170 μM [(U)-13C]-L-valine, 30 or 170 μM [(U)-13C]-ketoisovalerate (KIV) sodium salt (for 13C tracer experiments; Cambridge Isotope Laboratories) or 2 mM [amine-15N]-L-glutamine (for 15N tracer experiments; Cambridge Isotope Laboratories). The concentrations are based on the standard RPMI-1640 media formulation. At the time of collection, the cells were washed twice with ice-cold PBS and extracted with 80% methanol on ice for 10 min. After removing the insoluble particles by centrifugation, the supernatants were collected and dried using a SpeedVac at 30°C. The cell extracts were dissolved in a total volume of 90 μL 99.96% D2O containing 0.1mM DSS-d6 and transferred to 3-mm NMR tubes (Shigemi Inc.). Calibration samples (150–250 mM) were prepared from 98% 15N-enriched glutamine, glutamic acid, valine, leucine, isoleucine and alanine (Isotec Inc.) and 13C-enriched KIV and 13C,15N-enriched valine (Cambridge Isotope Laboratories) in D2O containing 0.1 mM DSS. All signals were identified either with authentic samples or by reference to literature values. Two-dimensional proton correlated spectra (COSY and TOCSY) were also collected in some cases to confirm assignments. The data were collected at 25°C on Agilent DD2 spectrometers at 600 or 900 MHz equipped with cryogenically cooled probes. The 1H data were collected with a 20-sec relaxation delay for accurate integration. The 15N data were acquired with a two-dimensional heteronuclear multiple bond correlation experiment (gNhmbc) derived from the Agilent pulse program library with the transfer delay set for a 15N-1H coupling value of 4 Hz. Typically, data sets were 2000 × 64 complex points with the 15N dimension set between 30 and 46 ppm, and 64 scans per point. The 13C data were acquired with a two-dimensional heteronuclear single bond correlation experiment (HSQCAD) from the Agilent pulse program library, and the datasets were 1202 × 64 complex points with the 13C dimension set between 10 and 80 ppm with 16 scans per point. One-dimentional spectra were also collected using the same heteronuclear correlation experiments for 15N and 13C. The data were processed using MestReNova software (Mestrelab Research S.L.). One-dimensional proton data were processed with 0.3 Hz line broadening and polynomial baseline correction. The gNhmbc and HSQC data were processed with linear prediction and zero-filling in the 15N and 13C dimensions. Integration was achieved by summing over peak areas with the contribution of noise subtracted in the 15N spectra. To calculate the concentrations in the 15N tracer experiments, the 1H and gNhmbc spectra of the calibration samples were integrated, and a scaling factor was derived from the ratio of the known concentration of each 98% enriched 15N-amino acid and the integral values from the gNhmbc data. These factors are a function of the 3-bond coupling between the 15N-amine and β-protons as well as the number of those protons. Therefore, the concentrations of each amino acid in cell extracts can be estimated from their integral values by applying the respective scaling factor. For quantification of 13C-labeled compounds, the methyl groups in the 1H and HSQC spectra of the calibration references were integrated, and a scaling factor was derived essentially as described above and used to calculate concentrations from the HSQC data of each sample.
Antibodies
Anti-FLAG monoclonal antibody M2 (Sigma-Aldrich), anti-MSI2 monoclonal antibody EP1305Y (Abcam) and normal Rabbit IgG PP64B (Millipore) were used for immunoprecipitation. For Western blotting the following antibodies were used: mouse monoclonal BCAT1 (clone ECA39, BD Transduction Laboratories) and Bcat1 OTI3F5 (OriGene), rabbit monoclonal S6K (#9202 and #2708), pS6K (#9234), AKT (#4691), pAKT, T308 (#13038) and pAKT, S473 (#4060) from Cell Signaling, rabbit monoclonal MSI2 EP1305Y, mouse monoclonal HSP90 F-8 (Santa Cruz Biotech) and mouse monoclonal β-tubulin BT7R (Thermo Fisher Scientific).
RNA immunoprecipitation assays
K562 cells were lysed in 50 mM Tris/HCl (pH 7.5) containing 150 mM NaCl, 5 mM EDTA, 1% NP-40, and the Halt Protease and Phosphatase Inhibitor Cocktail (Thermo Fisher Scientific). We performed immunoprecipitations with anti-FLAG, anti-MSI2 or rabbit normal IgG and protein G magnetic beads (Life Technologies) for 1 h at 4°C. The immunoprecipitated protein-RNA complexes were washed three times with low- and high-salt wash buffers (300 mM or 550 mM NaCl, respectively), followed by three washes in PBS. Total RNAs were purified from the washed beads using the RNAqueous-Micro kit (Ambion) and subjected to RT-qPCR analysis for quantification. The fold enrichment of the transcript amount in the RIP fraction over the amount present in the input sample before RIP (RIP/input) was calculated for each sample.
Statistical analysis
Statistical analyses were carried out using GraphPad Prism software version6.0f (GraphPad Software Inc.). Data are shown as the mean ± the s.e.m. Two-tailed unpaired Student’s t-tests or Mann-Whitney U tests were used to determine statistical significance. For Kaplan Meier survival analysis, log-rank tests were used for statistical significance (*p<0.05, **p<0.01, ***p<0.001).
Data availability
Source gel images and source data from animal models are included in Supplementary Information files. All NMR spectral data from metabolic analyses are deposited under the Project ID PR000423 in Metabolomics Workbench37. All other relevant data are available from the corresponding author upon request.
Supplementary Material
Extended Data
Extended Data Figure 1. Change in the amino acid metabolism in leukemic mice.
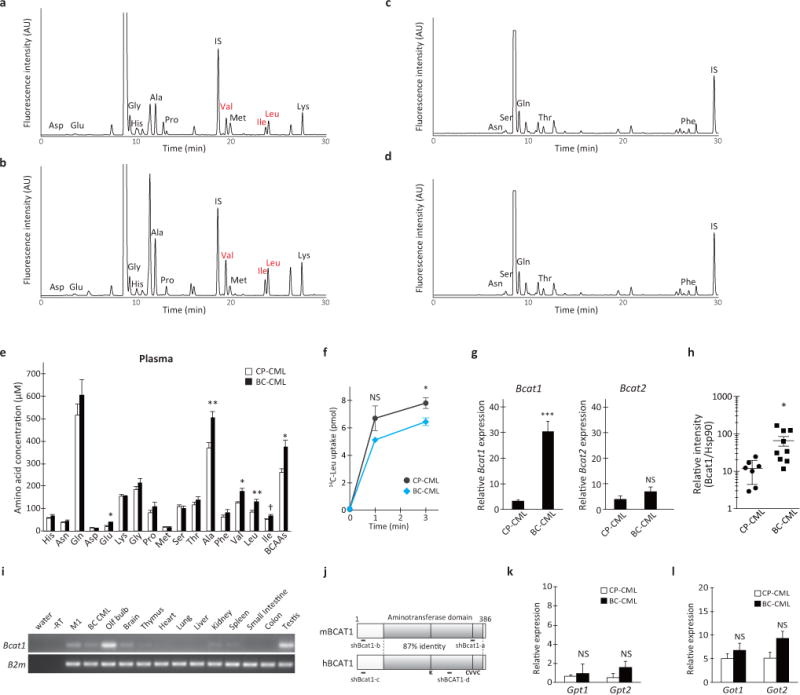
a–d, Representative chromatograms of (a, c) CP-CML and (b, d) BC-CML plasma samples derivatized with the amine-specific fluorescent labeling agent NBD-F and analyzed in mobile phases at (a, b) pH 6.2 or (c, d) pH 4.4. Each NBD-amino acid peak is assigned as indicated. IS, internal standard (NBD-6-aminocaproic acid). e, Plasma amino acid levels in mice with CP- and BC-CML. Blood plasma samples were prepared from mice with CP- and BC-CML, methanol-extracted and dried under a vacuum. The dried extracts were analyzed for quantification. Open and closed bars indicate CP-CML (n=5) and BC-CML (n=7) specimens, respectively. Two-tailed t-test. †p<0.06, *p<0.05, **p<0.01. f, Leucine transport in primary CP- and BC-CML cells. BCR-ABL1-YFP+PI− live leukemia cells (5 × 10⁵) were sorted from premorbid animals and placed in a pre-warmed uptake media containing 10 μM [(U)-14C]-labeled L-leucine. After incubation at 37°C for the indicated times, the cells were washed with cold HBSS and lysed with 0.1 M sodium hydroxide, and the radioactivity was measured using a scintillation counter. The gray and blue lines indicate the average leucine uptake in CP- and BC-CML samples, (n= 5 and 3, respectively). Error bars indicate s.e.m. *p<0.05. NS, not statistically significant (p>0.05). g, RT-qPCR analysis of Bcat1 and Bcat2 expression in CP- and BC-CML cells (n=4 each). The expression levels are normalized and displayed relative to the control beta-2-microglobulin gene expression. Error bars indicate s.e.m.; ***p<0.001, NS, not statistically significant (p>0.05). h, BCAT1 protein expression in mouse primary CP- and BC-CML cells. This graph shows BCAT1 protein expression levels normalized relative to the HSP90 loading control (CP-CML, n=7; BC-CML, n=9). Error bars indicate s.e.m. *p<0.05. i, Tissue-specific expression of mouse Bcat1. The expression was detectable in the myeloid cell line M1, primary mouse BC-CML cells, olfactory bulb (Olf bulb), whole brain and testis. B2m, beta-2-microglobulin. j, Schematics of the structures of human and mouse BCAT1 proteins. The shaded boxes represent aminotransferase domains. K, a Lys residue for the binding of the pyridoxal phosphate cofactor. CVVC, a conserved redox-sensitive CXXC motif. Regions targeted with shRNAs in this study are shown as thick bars (shBcat1-a and -b, and shBCAT1-c and -d). k, l, Alanine and aspartate transaminase gene expression in CP- and BC-CML. RT-qPCR analysis of (k) Gpt1 and Gpt2, and (l) Got1 and Got2 expression in CP- and BC-CML samples (n=4 each). The expression levels are normalized and displayed relative to the expression of the B2m control. Error bars indicate s.e.m.; NS, not statistically significant (p>0.05).
Extended Data Figure 2. Keto acid metabolism in leukemic mice.
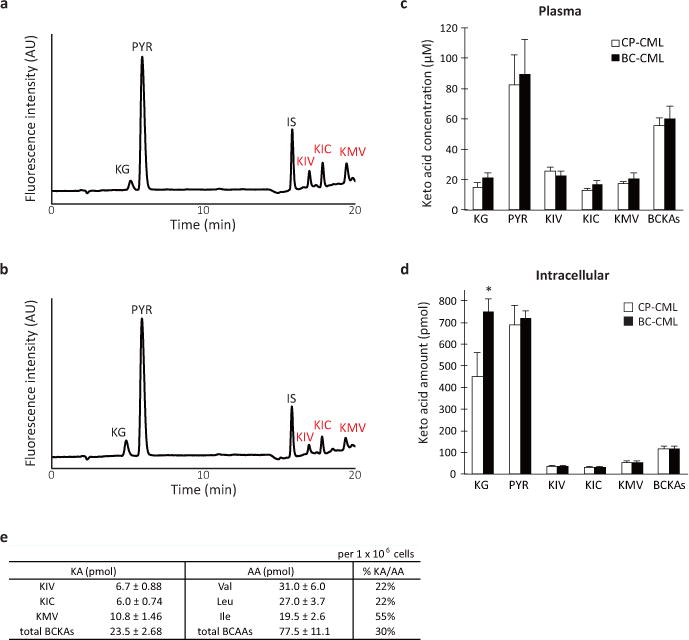
a, b, Representative chromatograms of (a) CP- and (b) BC-CML plasma samples derivatized with the keto acid-reactive o-phenylenediamine (OPD). Each OPD-keto acid peak is assigned as indicated. KG, alpha-ketoglutarate; PYR, pyruvate; KIV, keto-isovalerate; KIC, keto-isocaproate; KMV, keto-methylvalerate. IS, internal standard for keto acid analysis (OPD-alpha-ketovalerate). c, d, Plasma and intracellular branched-chain keto acid levels in CP- and BC-CML. (c) Blood plasma fractions from leukemic mice or (d) FACS-purified live leukemia cells (5 × 10⁶) were methanol-extracted and dried under a vacuum. The dried extracts were labeled with OPD, extracted with ethyl acetate and analyzed using an HPLC system equipped with a fluorescence detector. Open and closed bars indicate CP-CML (plasma, n=9; intracellular, n=5) and BC-CML (plasma, n=10; intracellular, n=6) specimens, respectively. BCKAs, total branched-chain keto acids. *p<0.05. Error bars indicate s.e.m. e, Molar amount of intracellular BCAAs and BCKAs in primary mouse BC-CML cells. The amount of each organic acid per one million cells is estimated using calibration curves obtained with reference standards for each compound. “%KA/AA” shows the amount of a BCKA relative to the corresponding BCAA species.
Extended Data Figure 3. Intracellular BCAA production from BCKA in human K562 BC-CML cells.
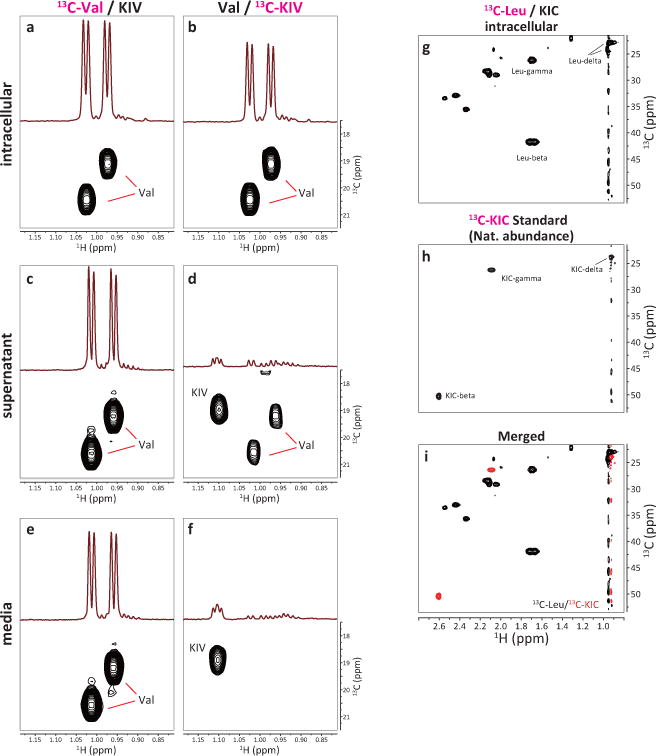
a–f, Regions of HSQC spectra of 13C-labeled metabolites. K562 cells were cultured in media supplemented with (a, c) 170 μM 13C-Val and 30 μM non-labeled KIV, or (b, d) 170 μM non-labeled Val and 30 μM 13C-KIV. After labeling for 15 min, the cells were collected, washed with PBS and methanol-extracted for HSQC analysis by high-field NMR spectroscopy. Each panel shows the regions of 1D and 2D HSQC spectra for the (a, b) intracellular fraction, (c, d) culture supernatant, and (e, f) labeling media alone, respectively. Panels a and b are the same as shown in Fig. 1e and f, respectively. g–i, Absence of detectable intracellular KIC generation by Leu breakdown. K562 cells were cultured in the labeling medium supplemented with 170 μM 13C-Leu and 30 μM non-labeled KIC for 15 min, and the intracellular 13C-labeled metabolites were analyzed by HSQC analysis. Each panel shows region of the 2D spectrum showing 1H-13C HSQC signals for beta, gamma and delta carbons of Leu and KIC. (g) intracellular fraction, (h) KIC reference standard (HSQC signals derived from natural abundance 13C-KIC), (i) overlay of the spectra g (black) and h (red). Note the absence of KIC signals in (g).
Extended Data Figure 4. Intracellular BCAA production via transamination.
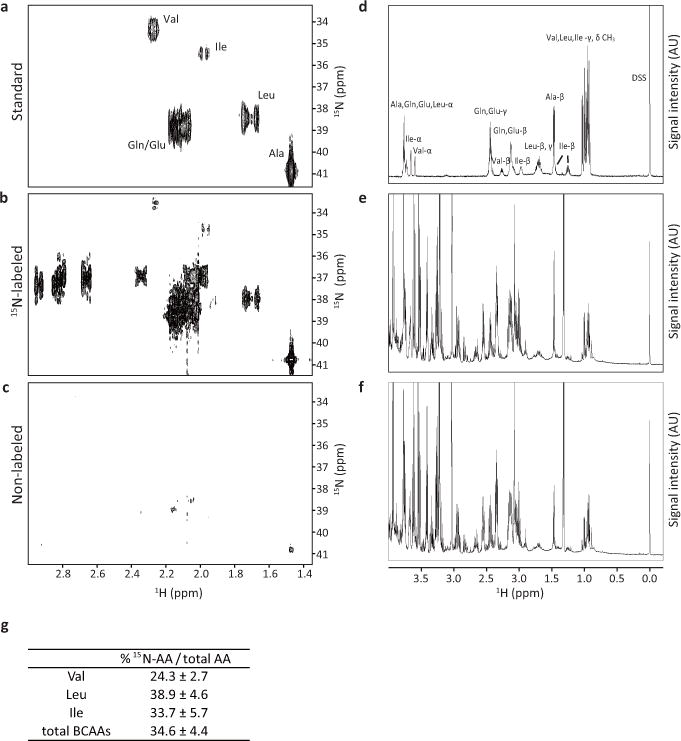
a–c, Regions of 600 MHz 2D HMBC spectra showing crosspeaks between the amine nitrogen and the beta carbon protons. Only those amino acids that have incorporated a significant amount of 15N-amine show crosspeak signals. d–f, Regions of 600 MHz 1D 1H spectra. Each proton peak is assigned as indicated. DSS, 2,2-dimethyl-2-silapentane-5-sulfonate. (a, d) Mixture of reference standards of the indicated amino acids, (b, e) K562 cell sample cultured in the medium containing (amine-15N)-glutamine and (c, f) K562 cell sample cultured in the non-labeled standard medium. g, Percentage of newly synthesized 15N-labeled BCAAs within total intracellular pool at 72 h after post-labeling for each amino acid indicated. “Total BCAAs” shows the percentage including all three BCAA species.
Extended Data Figure 5. Roles of Bcat1 in differentiation, proliferation and leukemia development in vivo.
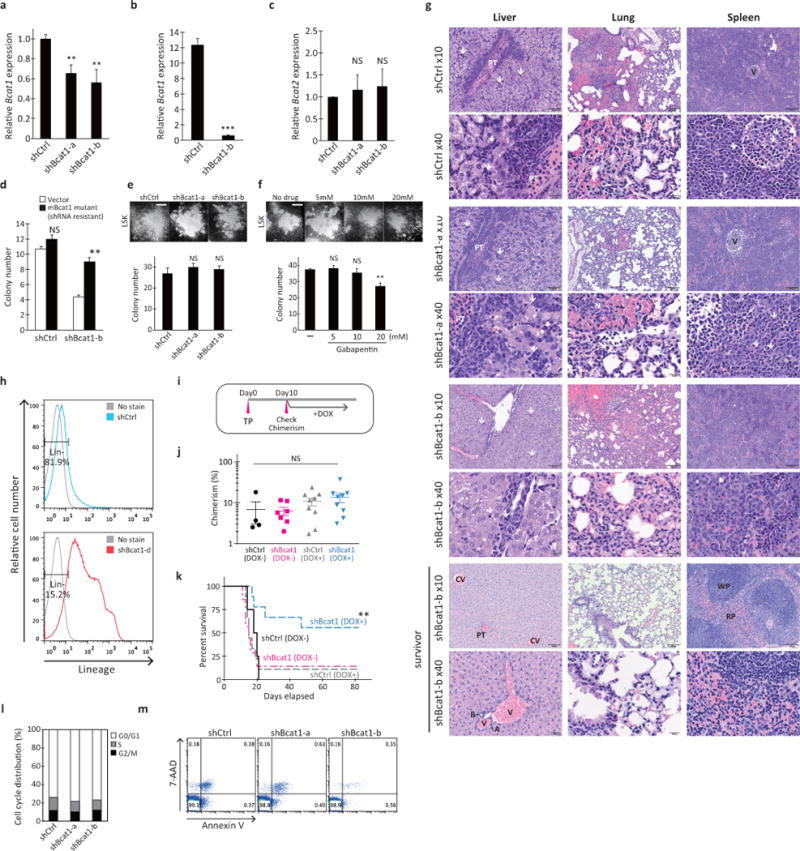
a, RT-qPCR analysis of Bcat1 expression. Lin− cells from NUP98-HOXA9/BCR-ABL-induced BC-CML were infected with shCtrl or Bcat1 shRNA (shBcat1-a and shBcat1-b) for 3 days and resorted for analysis of Bcat1 expression. The expression levels are normalized to the level of B2m expression and displayed relative to the control, which was arbitrarily set at 1. Error bars represent s.e.m. of triplicate PCRs. **p<0.01. b, RT-qPCR analysis of Bcat1 expression in leukemia cells isolated from diseased mice transplanted with shCtrl- or shBcat1-expressing BC-CML cells. The expression levels are normalized and displayed relative to the B2m control. ***p<0.001. c, Bcat2 expression in shBcat1-expressing cells. Lin− cells from NUP98-HOXA9/BCR-ABL-induced BC-CML were infected with shCtrl or Bcat1 shRNA (shBcat1-a and shBcat1-b) for 3 days and resorted for analysis of Bcat2 expression. The expression levels are normalized to the level of B2m and are displayed relative to the control arbitrarily set at 1. Error bars represent the s.e.m. of triplicate PCRs. NS, not statistically significant (p>0.05). d, Functional rescue of the shBcat1-induced reduction in colony-forming ability with the expression of shRNA-resistant mutant Bcat1 cDNA. Primary Lin− BC-CML cells transduced with the vector or shRNA-resistant Bcat1 gene together with the indicated shRNA constructs. **p<0.01 compared with the vector and shBcat1-b. e, f, Colony-forming ability of primary HSPCs. (e) Normal HSPCs purified from bone marrow based on their LSK phenotype were transduced with the Bcat1 shRNAs (shBcat1-a and shBcat1-b) and plated for colony formation. NS, not statistically significant (p>0.05). (f) Normal HSPCs were plated for colony formation with the indicated concentrations of gabapentin or PBS (-). NS, not statistically significant (p>0.05). **p<0.01 compared with the PBS control. Photomicrographs showing representative colonies formed under each condition. Scale bar, 500 μm. 300 LSK cells were plated per well in triplicate for the evaluation of colony-forming activity. Error bars indicate s.e.m. g, Hematoxylin and eosin staining of sections of the liver, lung and spleen at the time of onset of clinical signs (top 6 rows) and of tissue sections from a disease-free survivor (bottom 2 rows). White arrows indicate immature myeloid cells. Portal triad (PT), hemorrhagic necrosis (N), central veins (CV), arteriolar profiles (A), bile ducts (B), veins (V), white pulp (WP) and red pulp (RP) are indicated. Scale bars, 100 μm for images at 10x and 20 μm for images at 40x magnification. h, Representative flow cytometry plots showing lineage marker expression in leukemia cells from mice transplanted with the shRNA-infected BC-CML cells. Leukemia cells were analyzed for their frequency of the Lin− population. i–k, Effect of conditional Bcat1 knockdown on BC-CML maintenance in vivo. (i) Lin− BC-CML cells were infected with doxycycline-inducible shRNAs against shBcat1-b or a control (shCtrl) and transplanted into recipients (1,500 cells per recipient). After ten days of the transplantation with leukemia cells expressing the indicated constructs, (j) donor-derived chimerisms were analyzed. Mice were then fed with chow containing doxycycline to induce shRNA expression, and (k) survival was monitored. The data shown are from two independent experiments. n=4 for shCtrl with no Dox (DOX-); n=7 for shBcat1-b, DOX-; and n=9 each for shCtrl with Dox (DOX+) and shBcat1-b, DOX+. **p<0.01 (shCtrl vs shBcat1-b, DOX+). NS, not statistically significant (p>0.05). l, Cell cycle distribution of the shRNA-infected leukemia cells. Live leukemia cells were isolated from mice transplanted with shRNA-infected BC-CML cells, fixed and stained with propidium iodide for analysis of cell cycle distribution via flow cytometry. m, Apoptotic cells from leukemic mice transplanted with shRNA-infected BC-CML cells were analyzed via flow cytometry using Annexin V and 7-aminoactinomycin D (7-AAD) staining.
Extended Data Figure 6. BCAT1 cooperates with BCR-ABL1 in blastic transformation in vivo.
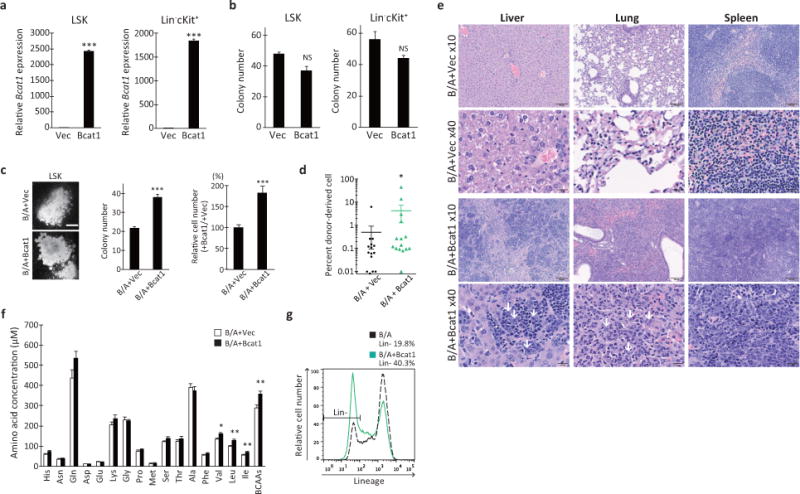
a, RT-qPCR analysis of Bcat1 expression in normal LSK or Lin− c-Kit+ HSPCs transduced with either the vector or Bcat1 retroviruses. The expression levels are normalized and displayed relative to the control B2m expression. ***p<0.001. b, Normal LSK or Lin− c-Kit+ HSPCs were purified from healthy bone marrow and transduced with the indicated retroviruses, and the infected cells were plated in triplicate to assess colony formation after 10 days. Error bars indicate s.e.m. NS, not statistically significant (p>0.05). c, Colony-forming ability of normal HSPCs expressing BCR-ABL1 and Bcat1. LSK cells were purified from healthy bone marrow and transduced with either the control vector or Bcat1 together with BCR-ABL1 (B/A) retroviruses, and double-positive cells were plated in triplicate to assess colony formation after 10 days (plated at a density of 150 cells/well). Photomicrographs showing representative colonies formed in each group. Scale bar, 500 μm. Error bars indicate s.e.m. ***p<0.001. d, Chimerism of donor–derived cells after transplantation with LSK cells expressing the indicated constructs. n=15 for each group. *p<0.05. e, Hematoxylin and eosin staining of liver, lung and spleen sections from mice transplanted with LSK cells expressing BCR-ABL1 and vector or Bcat1. White arrows indicate immature myeloid cells. Scale bars, 100 μm for 10x images and 20 μm for 40x images. f, Plasma α-amino acid levels in mice transplanted with LSK cells infected with BCR-ABL1 and the vector or Bcat1. Blood plasma fractions were prepared from peripheral blood samples, methanol-extracted and dried under a vacuum. The dried extracts were labeled with NBD-F and analyzed using an HPLC equipped with a fluorescence detector. Open and closed bars indicate vector-control (n=17) and Bcat1 (n=18) specimens, respectively. *p<0.05, **p<0.01. g, Representative flow cytometry plots showing lineage marker expression in leukemia cells from mice transplanted with LSK cells infected with either the control vector or Bcat1 together with BCR-ABL1. Leukemia cells were analyzed for their frequency of the Lin− population.
Extended Data Figure 7. BCAT1 is required for human myeloid leukemia.
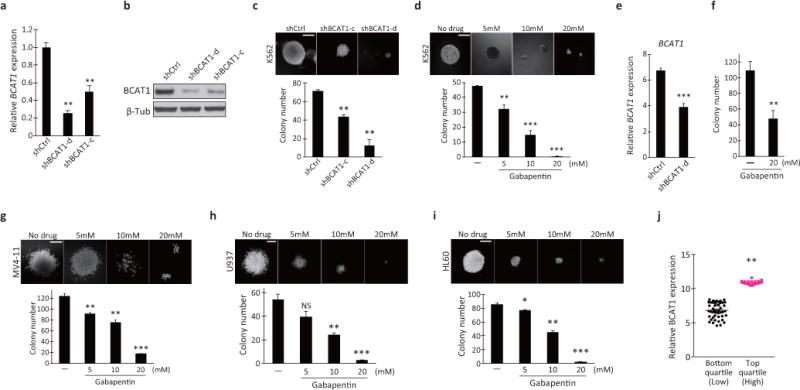
a, RT-qPCR analysis of BCAT1 expression in the human K562 BC-CML cell line transduced with lentiviral shCtrl or BCAT1 shRNA (shBCAT1-c and shBCAT1-d). The expression levels are normalized and displayed relative to the expression of the B2M control. **p<0.01. b, Western blot analysis of BCAT1 protein levels in K562 cells infected with the indicated lentiviral shRNA constructs. Human β-tubulin protein (β-Tub) was used as the loading control. β-Tub image is the same as shown in Fig. 3j. c, d, Colony-forming ability of (c) K562 cells transduced with control (shCtrl) or BCAT1 shRNAs (shBCAT1-c and shBCAT1-d) and (d) K562 cells cultured with the indicated concentrations of Gbp. One hundred cells were plated per well in triplicate. Photomicrographs show representative colonies formed. Scale bar, 200 μm. Error bars indicate s.e.m. **p<0.01, ***p<0.001. e, RT-qPCR analysis of BCAT1 expression in the samples from the BC-CML patient used in the data presented in Fig. 3d that were transduced with control (shCtrl) or BCAT1 shRNA (shBCAT1-d). ***p<0.001. f, Colony-forming ability of primary human CD34+ BC-CML cells from another patient specimen treated with Gbp. Error bars indicate s.e.m. **p<0.01. g–i, Colony-forming ability of (g) MV4-11, (h) U937 and (i) HL60 human AML cells treated with the indicated concentrations of Gbp. MV4-11, HL60 cells (300/well) or U937 (100/well) were plated in triplicate. Photomicrographs show representative colonies formed. Scale bars, 200 μm. Error bars indicate s.e.m. *p<0.05, **p<0.01, ***p<0.001. j, BCAT1 expression in human de novo AML patients. Data for BCAT1 expression levels from the TCGA AML dataset were divided into quartiles and were compared. On average, top quartile cohort showed 1.6-fold higher expression level than the bottom quartile. **p<0.01.
Extended Data Figure 8. Impact of BCAT1 knockdown in K562 cells.

a, b, Effect of (a) BCAT1 knockdown or (b) Gbp treatment on the intracellular concentrations of glutamate and BCAAs in K562 cells. The shCtrl or PBS control values were set as 100%. Error bars indicate s.e.m. n=10 each for (a) and n=3 each for (b). **p<0.01. c, AKT activation status in BCAT1- or MSI2-knockdown K562 cells. K562 cells treated with shCtrl, shBCAT1 or shMSI2 were analyzed by Western blotting for phospho-AKT (at Thr308 or Ser473), total AKT, hBCAT1, hMSI2 and HSP90 levels. d, Effect of alpha-ketoglutarate supplementation on the colony-forming ability of BCAT1-knockdown cells. K562 cells transduced with shCtrl (-) or shBCAT1-d (+) were plated in triplicate with or without 1 mM dimethyl-alpha-ketoglutarate (KG) and/or 4 mM BCAAs as indicated. n=3 technical replicates. Error bars indicate s.e.m. *p<0.05, **p<0.01. NS, not statistically significant (p>0.05).
Extended Data Figure 9. MSI2 and BCAT1 expression in human cancer.
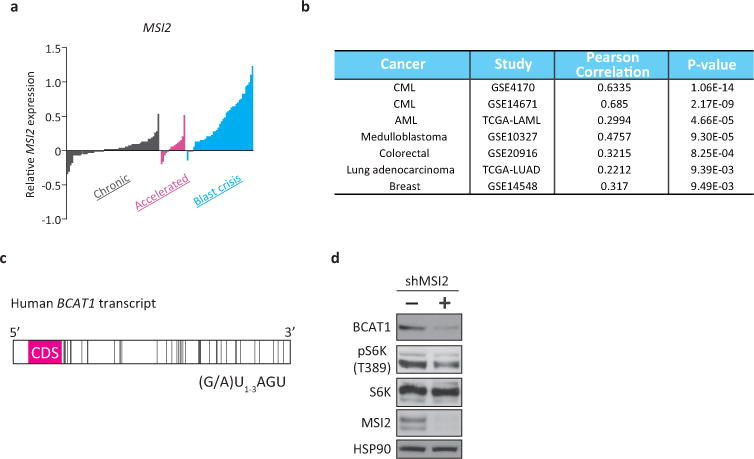
a, Microarray data analysis of MSI2 expression in human CML. Gene expression data of chronic (gray, n=57), accelerated (pink, n=15) and blast crisis (blue, n=41) phase patients were retrieved from the NCBI GEO database (GSE4170). The bar represents the normalized expression value in each specimen. b, Co-expression analysis of the BCAT1 and MSI2 genes in human cancer. Pearson correlation coefficients were used to evaluate the extent of co-expression patterns. c, Schematic of the human BCAT1 transcript. The bars represent the putative MSI binding elements (MBEs; r(G/A)U1-3AGU). Forty MBEs were identified within the 3′-UTR of BCAT1. CDS, coding sequence for hBCAT1 protein. d, K562 cells infected with lentiviral shRNA against MSI2 (shMSI2) or shCtrl (-) were analyzed by Western blotting for phospho-S6 kinase (at Thr389; pS6K), total S6K, hMSI2 and HSP90 levels. Note that MSI2 knockdown reduced the levels of BCAT1 protein and phospho-S6K.
Acknowledgments
We thank Drs. Warren Pear, David Baltimore and Scott Lowe for plasmids and Drs. Stephen Dalton, Craig Jordan, Bryan Zimdahl, Jun Ninomiya-Tsuji, Kazuhito Sai, Kunihiro Matsumoto, Hiroshi Hanafusa, Tomoaki Mizuno, Yachiyo Kuwatsuka, Yosuke Minami and Matthew Merritt for discussions and comments on the manuscript. We also thank Dr. Julie Nelson at the CTEGD Cytometry Shared Resource Lab for assistance in cell sorting, Drs. Kazuhisa Sekimizu, Christopher West, Msano Mandalasi and Hanke van der Wel for advice on radioisotope use, and Kristen MacKeil, Jamie Nist and Kazutomo Ogata for technical help. This work was supported by grants from the University of Georgia Research Foundation and the Heather Wright Cancer Research Fund (T.I.); by the Japan Society for the Promotion of Science Bilateral Open Partnership Joint Research Projects Program (M.T.); A.S.E. and the CCRC NMR facility were partially supported by the Southeast Center for Integrated Metabolomics, NIH U24DK097209 and the Georgia Research Alliance.
Footnotes
Author Contributions
A.H. designed the studies, performed all experiments, analyzed the data and wrote the manuscript. M.T. designed and performed experiments related to quantitative analysis of amino and keto acids. T.K., M.K. and A.T. provided and performed experiments with human primary samples. T.N. performed histological and cytological analysis. J.G. F.T. and A.S.E. designed and conducted NMR-based metabolic analysis. D.M. and N.K. performed bioinformatics analysis of gene expression datasets. T.I. conceived and supervised the project and wrote the manuscript.
Author Information
Competing financial interests. T.I. and A.H. are named inventors of a provisional patent application number 62/413,028. Correspondence and requests for materials should be addressed to T.I. (ito@bmb.uga.edu).
References
- 1.Vander Heiden MG. Targeting cancer metabolism: a therapeutic window opens. Nat Rev Drug Discov. 2011;10:671–684. doi: 10.1038/nrd3504. [DOI] [PubMed] [Google Scholar]
- 2.DeBerardinis RJ, Thompson CB. Cellular metabolism and disease: what do metabolic outliers teach us? Cell. 2012;148:1132–1144. doi: 10.1016/j.cell.2012.02.032. [DOI] [PMC free article] [PubMed] [Google Scholar]
- 3.Daley G, Van Etten R, Baltimore D. Induction of chronic myelogenous leukemia in mice by the P210bcr/abl gene of the Philadelphia chromosome. Science. 1990;247:824–830. doi: 10.1126/science.2406902. [DOI] [PubMed] [Google Scholar]
- 4.Dash AB, et al. A murine model of CML blast crisis induced by cooperation between BCR/ABL and NUP98/HOXA9. Proc Natl Acad Sci USA. 2002;99:7622–7627. doi: 10.1073/pnas.102583199. [DOI] [PMC free article] [PubMed] [Google Scholar]
- 5.Brosnan JT, Brosnan ME. Branched-chain amino acids: enzyme and substrate regulation. J Nutr. 2006;136:207S–11S. doi: 10.1093/jn/136.1.207S. [DOI] [PubMed] [Google Scholar]
- 6.Hutson SM, Sweatt AJ, Lanoue KF. Branched-chain amino acid metabolism: implications for establishing safe intakes. J Nutr. 2005;135:1557S–64S. doi: 10.1093/jn/135.6.1557S. [DOI] [PubMed] [Google Scholar]
- 7.Hutson SM, et al. Role of branched-chain aminotransferase isoenzymes and gabapentin in neurotransmitter metabolism. J Neurochem. 1998;71:863–874. doi: 10.1046/j.1471-4159.1998.71020863.x. [DOI] [PubMed] [Google Scholar]
- 8.Radich JP, et al. Gene expression changes associated with progression and response in chronic myeloid leukemia. Proc Natl Acad Sci USA. 2006;103:2794–2799. doi: 10.1073/pnas.0510423103. [DOI] [PMC free article] [PubMed] [Google Scholar]
- 9.Wolfson RL, et al. Sestrin2 is a leucine sensor for the mTORC1 pathway. Science. 2016;351:43–48. doi: 10.1126/science.aab2674. [DOI] [PMC free article] [PubMed] [Google Scholar]
- 10.Han JM, et al. Leucyl-tRNA synthetase is an intracellular leucine sensor for the mTORC1-signaling pathway. Cell. 2012;149:410–424. doi: 10.1016/j.cell.2012.02.044. [DOI] [PubMed] [Google Scholar]
- 11.Bar-Peled L, Sabatini DM. Regulation of mTORC1 by amino acids. Trends Cell Biol. 2014;24:400–406. doi: 10.1016/j.tcb.2014.03.003. [DOI] [PMC free article] [PubMed] [Google Scholar]
- 12.Jewell JL, Russell RC, Guan KL. Amino acid signalling upstream of mTOR. Nat Rev Mol Cell Biol. 2013;14:133–139. doi: 10.1038/nrm3522. [DOI] [PMC free article] [PubMed] [Google Scholar]
- 13.Okano H, Imai T, Okabe M. Musashi: a translational regulator of cell fate. J Cell Sci. 2002;115:1355–1359. doi: 10.1242/jcs.115.7.1355. [DOI] [PubMed] [Google Scholar]
- 14.Sutherland JM, McLaughlin EA, Hime GR, Siddall NA. The Musashi family of RNA binding proteins: master regulators of multiple stem cell populations. Adv Exp Med Biol. 2013;786:233–245. doi: 10.1007/978-94-007-6621-1_13. [DOI] [PubMed] [Google Scholar]
- 15.Rentas S, et al. Musashi-2 attenuates AHR signalling to expand human haematopoietic stem cells. 2016;532:508–511. doi: 10.1038/nature17665. [DOI] [PMC free article] [PubMed] [Google Scholar]
- 16.Imai T, et al. The neural RNA-binding protein Musashi1 translationally regulates mammalian numb gene expression by interacting with its mRNA. Mol Cell Biol. 2001;21:3888–3900. doi: 10.1128/MCB.21.12.3888-3900.2001. [DOI] [PMC free article] [PubMed] [Google Scholar]
- 17.Cragle C, MacNicol AM. Musashi protein-directed translational activation of target mRNAs is mediated by the poly(A) polymerase, germ line development defective-2. J Biol Chem. 2014;289:14239–14251. doi: 10.1074/jbc.M114.548271. [DOI] [PMC free article] [PubMed] [Google Scholar]
- 18.Wang XY, et al. Musashi1 regulates breast tumor cell proliferation and is a prognostic indicator of poor survival. Mol Cancer. 2010;9:221. doi: 10.1186/1476-4598-9-221. [DOI] [PMC free article] [PubMed] [Google Scholar]
- 19.Muto J, et al. RNA-Binding Protein Musashi1 Modulates Glioma Cell Growth through the Post-Transcriptional Regulation of Notch and PI3 Kinase/Akt Signaling Pathways. PLoS ONE. 2012;7:e33431. doi: 10.1371/journal.pone.0033431. [DOI] [PMC free article] [PubMed] [Google Scholar]
- 20.Ito T, et al. Regulation of myeloid leukaemia by the cell-fate determinant Musashi. Nature. 2010;466:765–768. doi: 10.1038/nature09171. [DOI] [PMC free article] [PubMed] [Google Scholar]
- 21.Kharas MG, et al. Musashi-2 regulates normal hematopoiesis and promotes aggressive myeloid leukemia. Nat Med. 2010;16:903–908. doi: 10.1038/nm.2187. [DOI] [PMC free article] [PubMed] [Google Scholar]
- 22.Yoshikawa R, et al. ECA39 is a novel distant metastasis-related biomarker in colorectal cancer. World J Gastroenterol. 2006;12:5884–5889. doi: 10.3748/wjg.v12.i36.5884. [DOI] [PMC free article] [PubMed] [Google Scholar]
- 23.Tönjes M, et al. BCAT1 promotes cell proliferation through amino acid catabolism in gliomas carrying wild-type IDH1. Nat Med. 2013;19:901–908. doi: 10.1038/nm.3217. [DOI] [PMC free article] [PubMed] [Google Scholar]
- 24.Lagadec C, et al. The RNA-binding protein Musashi-1 regulates proteasome subunit expression in breast cancer- and glioma-initiating cells. Stem Cells. 2014;32:135–144. doi: 10.1002/stem.1537. [DOI] [PMC free article] [PubMed] [Google Scholar]
- 25.Li N, et al. The Msi Family of RNA-Binding Proteins Function Redundantly as Intestinal Oncoproteins. Cell Rep. 2015;13:2440–2455. doi: 10.1016/j.celrep.2015.11.022. [DOI] [PMC free article] [PubMed] [Google Scholar]
- 26.Mayers JR, et al. Tissue of origin dictates branched-chain amino acid metabolism in mutant Kras-driven cancers. Science. 2016;353:1161–1165. doi: 10.1126/science.aaf5171. [DOI] [PMC free article] [PubMed] [Google Scholar]
References - Methods
- 27.Domen J, Cheshier SH, Weissman IL. The role of apoptosis in the regulation of hematopoietic stem cells: Overexpression of Bcl-2 increases both their number and repopulation potential. J Exp Med. 2000;191:253–264. doi: 10.1084/jem.191.2.253. [DOI] [PMC free article] [PubMed] [Google Scholar]
- 28.Qin XF, An DS, Chen IS, Baltimore D. Inhibiting HIV-1 infection in human T cells by lentiviral-mediated delivery of small interfering RNA against CCR5. Proc Natl Acad Sci USA. 2003;100:183–188. doi: 10.1073/pnas.232688199. [DOI] [PMC free article] [PubMed] [Google Scholar]
- 29.Mayotte N, Roy DC, Yao J, Kroon E, Sauvageau G. Oncogenic interaction between BCR-ABL and NUP98-HOXA9 demonstrated by the use of an in vitro purging culture system. Blood. 2002;100:4177–4184. doi: 10.1182/blood-2002-04-1244. [DOI] [PubMed] [Google Scholar]
- 30.Neering SJ, et al. Leukemia stem cells in a genetically defined murine model of blast-crisis CML. Blood. 2007;110:2578–2585. doi: 10.1182/blood-2007-02-073031. [DOI] [PMC free article] [PubMed] [Google Scholar]
- 31.Ashton JM, et al. Gene Sets Identified with Oncogene Cooperativity Analysis Regulate In Vivo Growth and Survival of Leukemia Stem Cells. Cell Stem Cell. 2012;11:359–372. doi: 10.1016/j.stem.2012.05.024. [DOI] [PMC free article] [PubMed] [Google Scholar]
- 32.Song Y, Funatsu T, Tsunoda M. Amino acids analysis using a monolithic silica column after derivatization with 4-fluoro-7-nitro-2,1,3-benzoxadiazole (NBD-F) J Chromatogr B Analyt Technol Biomed Life Sci. 2011;879:335–340. doi: 10.1016/j.jchromb.2010.12.018. [DOI] [PubMed] [Google Scholar]
- 33.Song Y, Funatsu T, Tsunoda M. Rapid determination of amino acids in biological samples using a monolithic silica column. Amino Acids. 2012;42:1897–1902. doi: 10.1007/s00726-011-0914-2. [DOI] [PubMed] [Google Scholar]
- 34.Pailla K, Blonde-Cynober F, Aussel C, De Bandt JP, Cynober L. Branched-chain keto-acids and pyruvate in blood: measurement by HPLC with fluorimetric detection and changes in older subjects. Clin Chem. 2000;46:848–853. [PubMed] [Google Scholar]
- 35.Segawa H, et al. Identification and functional characterization of a Na+-independent neutral amino acid transporter with broad substrate selectivity. J Biol Chem. 1999;274:19745–19751. doi: 10.1074/jbc.274.28.19745. [DOI] [PubMed] [Google Scholar]
- 36.Morimoto E, et al. Establishment and Characterization of Mammalian Cell Lines Stably Expressing Human L-Type Amino Acid Transporters. J Pharmacol Sci. 2008;108:505–516. doi: 10.1254/jphs.08232fp. [DOI] [PubMed] [Google Scholar]
- 37.Sud M, et al. Metabolomics Workbench: An international repository for metabolomics data and metadata, metabolite standards, protocols, tutorials and training, and analysis tools. Nucleic Acids Res. 2016;44:D463–70. doi: 10.1093/nar/gkv1042. [DOI] [PMC free article] [PubMed] [Google Scholar]
Associated Data
This section collects any data citations, data availability statements, or supplementary materials included in this article.
Supplementary Materials
Data Availability Statement
Source gel images and source data from animal models are included in Supplementary Information files. All NMR spectral data from metabolic analyses are deposited under the Project ID PR000423 in Metabolomics Workbench37. All other relevant data are available from the corresponding author upon request.


