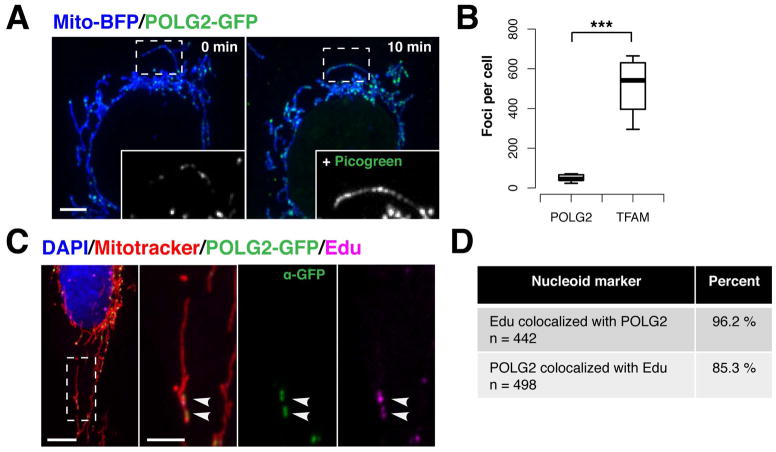
Figure 2. POLG2-GFP is specifically recruited to replicating nucleoids in live cells.
(A) A live U2OS cell expressing mito-BFP and POLG2-GFP was imaged (left panel), then stained with Picogreen DNA dye and re-imaged ten minutes later (right panel). Inset is 488 channel signal intensity in an example mitochondrion, left panel, and the same organelle after Picogreen staining, right panel. Magnified 2X. (B) The number of mitochondrial POLG2-GFP (n= total 441 foci from 10 cells) or TFAM-GFP foci (n=5,182 foci from 10 cells) per U2OS cell (***p<0.001, two-tailed t test). Data are mean +/− SD. (C) Representative image of a U2OS cell expressing POLG2-GFP and pulse-labeled with 50mM EdU, fixed and stained with DAPI (DNA, blue), Mitotracker (mitochondria, red), anti-GFP AlexaFluor488 conjugate antibody (POLG2-GFP, green), and ClickIt Edu-AlexaFluor647 (nascent DNA, magenta). (D) Observed co-localization between mitochondrial POLG2-GFP and EdU foci in fixed U2OS cells labeled as in C, from 15 cells. Scale bars: (A, C) 10 um, (C inset) 5 um.

