

Abstract
Background
Olfactory dysfunction has profound effects on quality of life, physical and social function, and mortality itself. Nitrogen dioxide (NO2) is a pervasive air pollutant that is associated with respiratory diseases. Given the olfactory nerve’s anatomic exposure to airborne pollutants, we investigated the relationship between NO2 exposure and olfactory dysfunction.
Methods
The ability to identify odors was evaluated using a validated test in respondents from the National Social Life, Health, and Aging Project (NSHAP), a representative probability sample of home-dwelling, older US adults ages 57–85. Exposure to NO2 pollution was assessed using measurements obtained from the US EPA AIRS ambient monitoring site closest to each respondent’s home. We tested the association between NO2 exposure and olfactory dysfunction using multivariate logistic regression.
Results
Among older adults in the US, 22.6% had impaired olfactory function, defined as ≤ 3 correct (out of 5) on the odor identification test. Median NO2 exposure during the 365 days prior to the interview date was 14.7 ppb (interquartile range [IQR] 10.8–19.7 ppb). An IQR increase in NO2 exposure was associated with increased odds of olfactory dysfunction (OR 1.35, 95% CI: 1.07–1.72), adjusting for age, gender, race/ethnicity, education, cognition, comorbidity, smoking, and season of the home interview (n=1,823).
Conclusion
We show for the first time that NO2 exposure is associated with olfactory dysfunction in older US adults. These results suggest an important role for NO2 exposure on olfactory dysfunction, and, potentially, nasal disease more broadly.
Keywords: Aged, Air Pollutants, Air Pollution, Cross-sectional Studies, Nitrogen Dioxide, Olfaction disorders, Smell
Background
Age-related olfactory dysfunction (presbyosmia) is a major personal and public health problem, affecting approximately 15 million older Americans and resulting in over 200,000 annual physician visits1–8. This sensory condition affects critical daily functions including detection of environmental hazards9, nutrition10–12, behavior13, sensation of pleasure14, sexuality15,16, mood17,18, and general wellbeing19. Further, olfactory dysfunction presages several neurodegenerative diseases, including Alzheimer’s Disease and Parkinson’s Disease20–28. We and others have shown that olfactory impairment is a major, independent risk factor for mortality29,30. Despite the profound impact of olfactory dysfunction on older adults, human olfaction is relatively understudied and the mechanisms that modulate age-related dysfunction are poorly understood.
The olfactory nerve is anatomically susceptible to damage by exposures to air pollutants31. Nitrogen dioxide (NO2), a pervasive criteria airborne pollutant regulated by the US Environmental Protection Agency (EPA), is generated by fossil fuel combustion. Anthropogenic sources account for approximately 87% of US emissions and include on-road and off-road motor vehicles, as well as stationary sources such as electrical utilities and industrial processes32–34. Exposure to NO2 has been associated with poor health outcomes, including respiratory, cardiovascular, and neurologic diseases35–50. Older adults may be at greater risk than younger adults for poor health outcomes associated with air pollution45. While the mechanisms by which NO2 may cause disease are not fully understood, biochemical, cellular, and animal studies suggest a role for inflammation and oxidative stress51–56. Indeed, these processes have been implicated in studies of the relationship between other airborne pollutants and olfactory pathology57.
To investigate the association between NO2 exposure and olfactory dysfunction, we used data from the National Social Life, Health, and Aging Project (NSHAP), a nationally representative probability sample of home-dwelling, older US adults ages 57–8558.
Materials and Methods
Study Population
We studied 1,832 NSHAP respondents who lived within 60 km of a US EPA AIRS ambient monitoring site and had complete olfactory testing. These respondents were interviewed from 2005–6 in their homes by professional interviewers (NORC at the University of Chicago) and form a representative probability sample of the US home-dwelling population ages 57–8559. Weighted demographic, olfactory, and health characteristics of the study population are presented in Table 1. Further details regarding the design, data collection, and baseline characteristics of NSHAP respondents are available elsewhere58. The study was approved by the Institutional Review Boards of the University of Chicago and NORC; all respondents provided written, informed consent.
Table 1.
Olfactory, demographic, and health characteristics of the population (n=1,832)
| Characteristic | Weighted %* |
|---|---|
|
| |
| Odors correctly identified | |
| Impaired olfaction (0–3 correct) | 22.6 |
| 0 | 1.2 |
| 1 | 2.5 |
| 2 | 5.0 |
| 3 | 13.8 |
| Normal olfaction (4–5 correct) | 77.4 |
| 4 | 28.4 |
| 5 | 49.0 |
|
| |
| Age (years, weighted mean ± SD) | 67.9±7.8 |
|
| |
| Gender | |
| Men | 49.3 |
| Women | 50.8 |
|
| |
| Race/ethnicity (n=1,823) | |
| White | 79.4 |
| Black | 10.8 |
| Hispanic, non-Black | 7.0 |
| Other | 2.8 |
|
| |
| Education | |
| <High school | 16.7 |
| High school graduate or equivalent | 24.8 |
| Some college | 30.4 |
| Bachelors or higher | 28.1 |
|
| |
| Cognition (SPMSQ, weighted mean ± SD) | 9.2±1.1 |
|
| |
| Modified Charlson comorbidity index (weighted mean ± SD) | 1.8±1.7 |
|
| |
| Smoking | |
| Current smokers | 18.2 |
| Not current smokers | 81.8 |
|
| |
| Season of the home interview | |
| Cool (October–March) | 30.8 |
| Warm (April–September) | 69.2 |
|
| |
| Frequency of physical activity (n=1,829) | |
| 1+ times per week | 78.8 |
| <1 time per week | 21.2 |
|
| |
| Employment | |
| Current employed | 40.5 |
| Not current employed | 59.5 |
|
| |
| Region | |
| West | 23.5 |
| Midwest | 20.2 |
| South | 33.8 |
| Northeast | 22.5 |
Unless otherwise specified;
Notes: SD=Standard deviation
Olfactory Assessment
Olfactory function was assessed with the odor identification portion of the Olfactory Function Field Exam, a validated test for field studies1,60–62. Respondents were asked to identify each odor presented by Sniffin’ Stick odor pens by choosing from a set of four picture/word prompts in a forced choice protocol; refusals were coded as incorrect. Respondents who identified 4–5 odors correctly were classified as normosmic, whereas respondents who identified 3 or fewer odors correctly were classified as having some form of olfactory dysfunction62. Odor pens were purchased from Burghart Messtechnik (Wedel, Germany) and stored and utilized according to the manufacturer’s instructions.
Nitrogen Dioxide Exposure Assessment
Exposure to NO2 was assessed using hourly data from monitoring sites maintained by the EPA. We linked participant data to NO2 concentrations measured at the nearest stationary ambient monitoring site within 60 km of each respondent’s home address. To evaluate the effect of exposure windows on the association between NO2 exposure and olfactory dysfunction, we used the 365 day moving average exposure prior to the health assessment as our main exposure window of interest. In addition, we calculated NO2 exposures for shorter exposure windows, including 30, 60, 90, and 180 days, to assess whether NO2 exposures over shorter time frames also impacted olfaction. For each moving average, exposures were considered valid when at least 75% of the hourly measurements within the exposure window were available.
Potential Confounding Variables
Our analyses controlled for numerous potential confounders, including age, gender, race/ethnicity, education, cognitive function, smoking status, comorbidity, and season of the home interview. Age and gender have previously observed, consistent associations with olfactory function4,63,64. Race (an established olfactory risk factor3) and Hispanic ethnicity were measured via self-report according to standard NIH questions, and respondents were classified as White, African American, or Hispanic (those who reported their race as “Black/African American” and answered “Yes” to Hispanic ethnicity were classified as African American). Those reporting their race as “American Indian or Alaskan Native,” “Asian,” or “Other” were combined into a single Other category. Socioeconomic status was measured by highest educational degree or certification earned. Cognitive function (specifically memory and mental arithmetic) was measured with a modified version of the Short Portable Mental Status Questionnaire (SPMSQ, scores from 0–10)65. Although smoking has an unclear association with olfactory dysfunction63,66,67, current smoking (based on either self-report or salivary cotinine level ≥ 15 ng/mL) was included as a potential confounder because of its mechanistic relevance to air pollution exposure. Comorbid diseases were measured with the Charlson Index modified for NSHAP68. Season of the home interview (cooler months, October–March vs. warmer months, April–September) was included because of plausible seasonal differences in olfactory function due to infections or allergies69. Missing covariates were minimal: race/ethnicity was missing for 9 of 1,832 respondents, and no other covariates were missing for any respondents.
Statistical Analysis
NSHAP had a 75.5% survey response rate, excellent for a targeted probability sample, and the non-responders were similar demographically to the responders59. Analyses were performed using person-level weights, accounting for non-response. Design-based standard errors were calculated using the linearization method together with the strata and Primary Sampling Unit indicators provided with the dataset. All statistical analyses were conducted using Stata Version 14.070.
Multivariate logistic regression was used to estimate the relationship between NO2 and olfactory dysfunction, adjusting for potential confounders. Results are presented as odds ratios and 95% confidence intervals (CI). Wald tests were used to determine p-values. For each variable considered as an effect modifier, the corresponding model included both its main effect and interaction with NO2. Statistical significance was set at p<0.05.
To ensure that the results were not dependent on the chosen threshold between normosmia and olfactory dysfunction, multivariate linear regression models including all covariates were fit, treating the number of odors correctly identified (0–5) as the dependent variable. To assess the sensitivity of our findings to distance from monitor, we performed additional analyses that restricted our study population to participants who lived within 40 km of an EPA monitoring site. We also conducted sensitivity analyses that included all NSHAP respondents irrespective of distance to monitor.
Results
NO2 Exposure
Older US adults experienced a median NO2 exposure level of 14.7 ppb (interquartile range [IQR] 10.8–19.7 ppb) during the 365 days prior to the interview date. Older adults’ pollution exposure differed by geography: respondents in the Northeast experienced the highest median NO2 exposures (19.0ppb, IQR 12.3–22.8 ppb), followed by the West (18.4 ppb, IQR 12.6–23.3 ppb) and Midwest (16.8ppb, IQR 14.7–19.8 ppb), and with the South experiencing the lowest NO2 levels (11.3ppb, IQR 7.9–13.4 ppb). The highest 365 day NO2 exposure for our study participants was 36.3 ppb, significantly below the 53 ppb annual mean National Ambient Air Quality Standard (NAAQS) imposed by the EPA for NO271,72. The World Health Organization recommends a limit of 21 ppb annual mean NO2 exposure, and we found that 21.5% of older US adults faced exposure levels higher than that recommendation33. As expected, older adults’ pollution exposure varied by season when we considered shorter exposure windows: for example, the median 30 day NO2 exposure for respondents interviewed during cool months was higher than for those interviewed during warm months (16.4 vs. 12.5 ppb, p=0.001), consistent with known short term variability in this pollutant related to season. Median distance from an EPA monitoring site was 13.7 km. NO2 exposure levels are presented in Table 2.
Table 2.
365 day NO2 exposure for the population (n=1,832)
| Measured NO2 (ppb) | |
|---|---|
| Mean ± SD | 15.6±7.0 |
| Median | 14.7 |
| 25th–75th percentile | 10.8–19.7 |
| Interquartile range | 8.9 |
| Cool season, Mean ± SD | 17.7±8.2 |
| Warm season, Mean ± SD | 13.0±7.1 |
Notes: All values are weighted. SD=Standard deviation
Olfaction and NO2
Older adults who experienced higher yearly averaged NO2 exposure levels faced significantly greater odds of olfactory impairment: a 33% increase in odds of having olfactory dysfunction per 8.9 ppb (1-IQR) increase in NO2 exposure (OR 1.33, 95% CI: 1.05–1.70), controlling for age, gender, race/ethnicity, and education (Table 3). This relationship was similar in adjusted models which controlled additionally for cognition, comorbidity, smoking, and season of the home interview (OR 1.35, 95% CI: 1.07–1.72; Figure 1). As has been previously reported, older adults, men, and Blacks (compared to Whites) had worse olfactory function in these models, while higher levels of education and better cognitive function were protective2–4 (Table 3). There were no significant interactions between NO2 exposure and any of our measured covariates (data not shown). Evidence of nonlinearity was assessed by use of a quadratic term, which was found to be nonsignificant.
Table 3.
Effects of NO2 exposure on olfactory dysfunction, controlling for age, gender, race/ethnicity, and education (logistic regression, Model A), and additionally for cognition, comorbidity, smoking, and season of the home interview (Model B) (n=1,823)
| Odds Ratio (95% Confidence Interval) p-Value |
||
|---|---|---|
|
| ||
| Covariates | Model A | Model B |
|
| ||
| NO2 exposure (per 1-IQR: 8.9ppb) | 1.33 (1.05,1.70) 0.022 |
1.35 (1.07, 1.72) 0.013 |
|
| ||
| Age (decades) | 2.11 (1.77, 2.51) <0.001 |
1.98 (1.67, 2.34) <0.001 |
|
| ||
| Gender (men vs. women) | 1.52 (1.15, 2.02) 0.004 |
1.57 (1.18, 2.09) 0.003 |
|
| ||
| Race/ethnicity | ||
| White (ref) | -- | -- |
| Black | 2.48 (1.72, 3.58) <0.001 |
2.23 (1.54, 3.23) <0.001 |
| Hispanic, non-Black | 1.00 (0.56, 1.80) 0.998 |
0.92 (0.50, 1.68) 0.770 |
| Other | 1.49 (0.72, 3.10) 0.277 |
1.35 (0.66, 2.78) 0.407 |
|
| ||
| Education | ||
| <High school (ref) | -- | -- |
| High school graduate or equivalent | 0.68 (0.49, 0.95) 0.023 |
0.76 (0.56, 1.04) 0.083 |
| Some college | 0.50 (0.34, 0.74) 0.001 |
0.58 (0.40, 0.84) 0.005 |
| Bachelors or higher | 0.46 (0.30, 0.73) 0.001 |
0.55 (0.34, 0.87) 0.013 |
|
| ||
| Cognition (SPMSQ) | -- | 0.80 (0.71, 0.90) <0.001 |
|
| ||
| Comorbidity (modified Charlson index) | -- | 1.04 (0.97, 1.11) 0.244 |
|
| ||
| Current smoking | -- | 0.94 (0.69, 1.29) 0.688 |
|
| ||
| Season of the home interview (cool vs. warm) | -- | 0.83 (0.60, 1.16) 0.278 |
Notes: IQR=Interquartile Range
Figure 1.
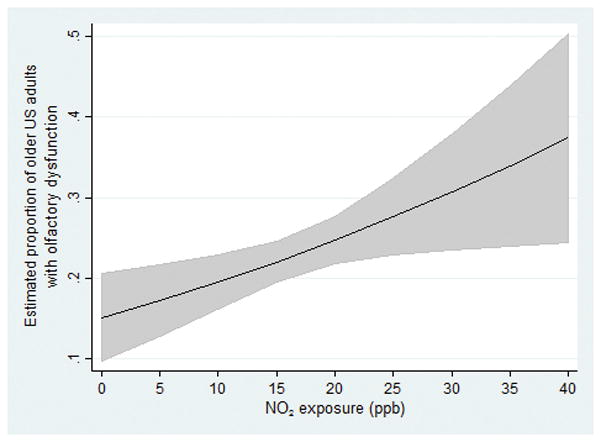
Association among US older adults between NO2 exposure (NB: 53 ppb annual mean exposure = EPA National Ambient Air Quality Standard (NAAQS)) and olfactory dysfunction (logistic regression), controlling for age, gender, race/ethnicity, education, cognition, comorbidity, smoking, and season of the home interview (n=1,823)
NO2 exposures averaged over 180 days was found to have a similar impact on olfaction as compared to those experienced over one year (Table 4). For example, the odds of olfactory impairment associated with an IQR increase in 180 day NO2 exposures was found to be similar (OR 1.31, 95% CI: 1.02–1.67) in adjusted models controlling for all covariates. In contrast, shorter exposure windows of 30 to 90 days prior to olfactory testing showed no significant association with olfaction, although the observed associations were consistently positive.
Table 4.
Effect of NO2 sampling window on detecting relationship between olfactory dysfunction and NO2 exposure in logistic regression Models A and B (n=1,823)
| 30 day NO2 |
60 day NO2 |
90 day NO2 |
180 day NO2 |
365 day NO2 |
|
|---|---|---|---|---|---|
|
| |||||
| NO2 exposure IQR | 10.0 | 9.5 | 9.1 | 9.2 | 8.9 |
|
| |||||
| Model A | |||||
| OR per 1-IQR increase in NO2 exposure | 1.17 | 1.18 | 1.21 | 1.29 | 1.33 |
| 95% CI | (0.90,1.51) | (0.91,1.52) | (0.95,1.55) | (1.00,1.66) | (1.05,1.70) |
| p-Value | 0.237 | 0.200 | 0.122 | 0.046 | 0.022 |
|
| |||||
| Model B | |||||
| OR per 1-IQR increase in NO2 exposure | 1.21 | 1.23 | 1.26 | 1.31 | 1.35 |
| 95% CI | (0.94,1.57) | (0.95,1.59) | (0.98,1.61) | (1.02,1.67) | (1.07,172) |
| p-Value | 0.141 | 0.118 | 0.066 | 0.034 | 0.013 |
Notes: IQR=Interquartile Range, OR=Odds Ratio, CI=Confidence Interval
Model A adjusted for age, gender, race/ethnicity, and education
Model B adjusted for age, gender, race/ethnicity, education, cognition, comorbidity, smoking, and season of the home interview
Sensitivity Analyses
When we restricted our study population to include only those respondents living within 40 km of an EPA monitoring site, we found the association between NO2 exposure and olfactory dysfunction to be slightly stronger (OR 1.42, 95% CI: 1.11–1.80, p=0.006) in adjusted models controlling for all covariates.
We also re-ran the analyses to include all respondents (adding back those who lived further than 60 km from an EPA monitoring site). We found that the relationship between NO2 exposure and olfactory impairment remained strong: older adults had a 21% increase in odds of impairment per 8.9 ppb (1-IQR) increase in NO2 exposure (OR 1.21, 95% CI: 1.02–1.43, p=0.031) in adjusted models controlling for all covariates.
Finally, to determine if our results were dependent on the chosen threshold between normosmia and olfactory dysfunction, we examined multivariate linear models with olfactory function scored as number of odors correctly identified. This analysis showed a similar deleterious association, with higher NO2 pollution exposure associated with worse olfaction (β=−0.12 for 1-IQR increase in NO2, 95% CI: −0.20 to −0.04, p=0.004), controlling for age, gender, race/ethnicity, education, cognition, comorbidity, smoking, and season of the home interview.
Discussion
We show for the first time that NO2 exposure is associated with olfactory dysfunction in older US adults: we found that an IQR increase in annual NO2 exposure was independently associated with markedly greater odds of olfactory impairment. Importantly, this association was found even though our study population experienced NO2 exposures that were well below the EPA NAAQS of 53 ppb71,72. In recognition of the seriousness of the NO2 threat on public health, the World Health Organization recommends a much more stringent limit of 21 ppb annual mean NO2 exposure33. Remarkably, over one-fifth of older US adults faced exposures greater than that recommendation.
We are the first to show a relationship between olfactory dysfunction and NO2 exposure; however, our results are consistent with prior studies that demonstrate an association between olfaction and air pollution. For example, residents living in severely polluted Mexico City were found to have significantly worse olfactory function than control subjects living in less polluted regions of Mexico73,74. Further, the Mexico City residents had ultrafine particles in their olfactory bulbs that were not found in the olfactory bulbs of control subjects74. Similarly, older German women living closer to a busy road, a proxy for traffic-related pollution exposure, performed worse on tests of olfactory function than women living farther from a busy road75.
We found similar associations between NO2 and olfactory dysfunction for the exposure window of 180 days, but not at shorter exposure windows. Additionally, we found no effect modification of the NO2-olfaction associations by age, gender, education, and most notably by race/ethnicity. Since we found olfaction to vary significantly by race, our findings suggest that the impacts of NO2 exposure on olfaction are comparable across older adults from different racial backgrounds with varying base levels of olfactory impairment.
The implications of these data are that lifetime exposure to NO2 may cause olfactory decline, and by extension, have effects on the central nervous system20–28. The olfactory nerve is anatomically exposed to the outside environment, particularly to airborne pollutants. Odorants enter the nasal cavity through the nasal vestibule and travel superiorly to the olfactory epithelium, whose axons project through the cribriform plate to synapse in the olfactory bulb31,76. Along with odorants, airborne pollutants have direct access to this pathway, and damage by airborne pollutants leading to inflammation and oxidative stress may mediate olfactory dysfunction51–56. Further, it has been hypothesized that inhaled agents, such as pollutants or other toxins, may bypass the blood-brain barrier and access the brain via this same pathway, thereby causing or catalyzing neurodegenerative diseases (referred to as the “olfactory vector hypothesis”)77,78. Thus, understanding the role of airborne pollution in olfactory dysfunction may elucidate the mechanism through which olfactory dysfunction predates neurodegenerative diseases. Given the burden of neurosensory disease, understanding the mechanism of this interaction between olfactory dysfunction and NO2 exposure is likely to have a major public health impact.
Residual confounding or confounding by unmeasured covariates and/or other forms of pollution (e.g., traffic, noise, or other airborne pollutants (e.g., particulate matter), etc.) is possible. Nonetheless, adjustment for several known confounding variables, including those related to socio-economic status, did not eliminate the observed associations of NO2 with olfaction. We assessed NO2 levels using exposures based on the nearest stationary ambient monitor within 60 km to participants’ residential addresses, with a median distance of 13.7 km. These measures do not account for spatial variability, time spent indoors, or length of time at the current residence, and thus are imperfect proxies of personal NO2 exposures and contribute to exposure misclassification. However, our sensitivity analyses suggest that exposure error in our findings may be small, as we found comparable results when restricting to a smaller buffer zone (40 km), suggesting that our findings are valid. While we do not have information on how many respondents moved within the year prior to olfactory testing, other studies have found that less than 12% of Americans move per year, and that older adults are less likely to move than younger adults79. Furthermore, results from several exposure studies of the elderly suggest that ambient NO2 exposures are correlated with corresponding personal exposures and are thus appropriate proxies of exposures in epidemiological studies80.
Conclusion
We show for the first time that NO2 exposure well below the EPA limit is associated with olfactory dysfunction in older US adults, thus adding a nasal/neurosensory phenotype to the substantial list of processes affected by airborne pollution. NSHAP is the largest, nationally representative study of olfactory function and airborne pollution to date. Our data support the recommendation that clinicians should consider screening older patients and others at risk of increased pollution exposure for olfactory loss. Given the profound biopsychosocial effects of olfactory dysfunction on quality of life, physical and social function, and mortality itself, as well as its association with neurologic outcomes, understanding the mechanism of this association is likely to have a major public health impact.
Acknowledgments
Susie Kim, Katherine McKeough (both Section of Otolaryngology-Head and Neck Surgery) and Sara Henning (NORC) provided logistical support. Johannes Huessy and Timothy M. Mulcahy (both NORC) provided technical support. William Dale (Section of Geriatrics and Palliative Medicine, The University of Chicago) provided valuable intellectual input.
Funding Sources: NIA AG029795, AG030481, AG036762, AG033903, and AG021487; NIAID AI106683; NIEHS ES022657 and ES019168. DRA was supported by a Pritzker Fellowship from the Pritzker School of Medicine at The University of Chicago. The funders had no role in the design, methods, subject recruitment, data collections, analysis or preparation of this paper.
Footnotes
Presented at the American Rhinologic Society Spring Meeting/Combined Otolaryngology Spring Meetings, Chicago, IL, USA on May 19, 2016.
Financial Disclosures: The authors declare no conflicts of interest.
References
- 1.Schumm LP, McClintock M, Williams S, et al. Assessment of Sensory Function in the National Social Life, Health, and Aging Project. Journal of Gerontology: Social Sciences. 2009;64B:i76–i85. doi: 10.1093/geronb/gbp048. [DOI] [PMC free article] [PubMed] [Google Scholar]
- 2.Kern DW, Wroblewski KE, Schumm LP, Pinto JM, Chen RC, McClintock MK. Olfactory Function in Wave 2 of the National Social Life, Health, and Aging Project. Journals of Gerontology, Series B: Psychological Sciences and Social Sciences. 2014;69:144–53. doi: 10.1093/geronb/gbu093. [DOI] [PMC free article] [PubMed] [Google Scholar]
- 3.Pinto JM, Schumm LP, Wroblewski KE, Kern DW, McClintock MK. Racial Disparities in Olfactory Loss Among Older Adults in the United States. Journals of Gerontology: MEDICAL SCIENCES Cite journal as J Gerontol A Biol Sci Med Sci. 2014;69:323–9. doi: 10.1093/gerona/glt063. [DOI] [PMC free article] [PubMed] [Google Scholar]
- 4.Murphy C, Schubert CR, Cruickshanks KJ, Klein BEK, Klein R, Nondahl DM. Prevalence of olfactory impairment in older adults. JAMA : the journal of the American Medical Association. 2002;288:2307–12. doi: 10.1001/jama.288.18.2307. [DOI] [PubMed] [Google Scholar]
- 5.Schubert CR, Cruickshanks KJ, Klein BE, Klein R, Nondahl DM. Olfactory impairment in older adults: five-year incidence and risk factors. Laryngoscope. 2011;121:873–8. doi: 10.1002/lary.21416. [DOI] [PMC free article] [PubMed] [Google Scholar]
- 6.Schubert CR, Cruickshanks KJ, Fischer ME, et al. Olfactory impairment in an adult population: the Beaver Dam Offspring Study. Chem Senses. 2012;37:325–34. doi: 10.1093/chemse/bjr102. [DOI] [PMC free article] [PubMed] [Google Scholar]
- 7.National Institute on Deafness and Other Communication Disorders (NIDCD) [Accessed April 27, 2016];Quick Statistics About Taste and Smell. Available at: http://www.nidcd.nih.gov/health/statistics/pages/smell.aspx.
- 8.NAMCS. Report of the Panel of Communicative Disorders to the National Advisory Neurological and Communicative Disorders and Stroke Council. Washington, D.C: Public Health Service; 1979. [Google Scholar]
- 9.Santos DV, Reiter ER, DiNardo LJ, Costanzo RM. Hazardous events associated with impaired olfactory function. Arch Otolaryngol Head Neck Surg. 2004;130:317–9. doi: 10.1001/archotol.130.3.317. [DOI] [PubMed] [Google Scholar]
- 10.Miwa T, Furukawa M, Tsukatani T, Costanzo RM, DiNardo LJ, Reiter ER. Impact of olfactory impairment on quality of life and disability. Arch Otolaryngol Head Neck Surg. 2001;127:497–503. doi: 10.1001/archotol.127.5.497. [DOI] [PubMed] [Google Scholar]
- 11.Mattes RD, Cowart BJ, Schiavo MA, et al. Dietary evaluation of patients with smell and/or taste disorders. The American journal of clinical nutrition. 1990;51:233–40. doi: 10.1093/ajcn/51.2.233. [DOI] [PubMed] [Google Scholar]
- 12.Mattes RD, Cowart BJ. Dietary assessment of patients with chemosensory disorders. Journal of the American Dietetic Association. 1994;94:50–6. doi: 10.1016/0002-8223(94)92041-9. [DOI] [PubMed] [Google Scholar]
- 13.Herz RS, Schooler JW. A naturalistic study of autobiographical memories evoked by olfactory and visual cues: testing the Proustian hypothesis. The American journal of psychology. 2002;115:21–32. [PubMed] [Google Scholar]
- 14.Wolfe J, Kluender K, Levi D. Sensation & Perception. 2. Sunderland, MA: Sinauer Associates; 2008. [Google Scholar]
- 15.Bhutta MF. Sex and the nose: human pheromonal responses. Journal of the Royal Society of Medicine. 2007;100:268–74. doi: 10.1258/jrsm.100.6.268. [DOI] [PMC free article] [PubMed] [Google Scholar]
- 16.Jacob S, McClintock MK, Zelano B, Ober C. Paternally inherited HLA alleles are associated with women’s choice of male odor. Nature genetics. 2002;30:175–9. doi: 10.1038/ng830. [DOI] [PubMed] [Google Scholar]
- 17.Schiffman SS, Sattely-Miller EA, Suggs MS, Graham BG. The effect of pleasant odors and hormone status on mood of women at midlife. Brain Res Bull. 1995;36:19–29. doi: 10.1016/0361-9230(94)00133-l. [DOI] [PubMed] [Google Scholar]
- 18.Schiffman SS, Suggs MS, Sattely-Miller EA. Effect of pleasant odors on mood of males at midlife: comparison of African-American and European-American men. Brain Res Bull. 1995;36:31–7. doi: 10.1016/0361-9230(94)00134-m. [DOI] [PubMed] [Google Scholar]
- 19.Neuland C, Bitter T, Marschner H, Gudziol H, Guntinas-Lichius O. Health-related and specific olfaction-related quality of life in patients with chronic functional anosmia or severe hyposmia. Laryngoscope. 2011;121:867–72. doi: 10.1002/lary.21387. [DOI] [PubMed] [Google Scholar]
- 20.Doty RL, Reyes PF, Gregor T. Presence of both odor identification and detection deficits in Alzheimer’s disease. Brain research bulletin. 1987;18:597–600. doi: 10.1016/0361-9230(87)90129-8. [DOI] [PubMed] [Google Scholar]
- 21.Doty RL. Olfactory dysfunction in Parkinson disease. Nature Reviews Neurology. 2012;8:329–39. doi: 10.1038/nrneurol.2012.80. [DOI] [PubMed] [Google Scholar]
- 22.Serby M, Larson P, Kalkstein D. The nature and course of olfactory deficits in Alzheimer’s disease. Am J Psychiatry. 1991;148:357–60. doi: 10.1176/ajp.148.3.357. [DOI] [PubMed] [Google Scholar]
- 23.Schiffman SS. Taste and smell losses in normal aging and disease. Jama. 1997;278:1357–62. [PubMed] [Google Scholar]
- 24.Schubert CR, Carmichael LL, Murphy C, Klein BEK, Klein R, Cruikshanks KJ. Olfaction and the 5-year incidence of cognitive impairment in an epidemiologic study of older adults. J Am Geriatr Soc. 2008;56:1517–21. doi: 10.1111/j.1532-5415.2008.01826.x. [DOI] [PMC free article] [PubMed] [Google Scholar]
- 25.Tabert MH, Liu X, Doty RL, et al. A 10-item smell identification scale related to risk for Alzheimer’s disease. Annals of Neurology. 2005;58:155–60. doi: 10.1002/ana.20533. [DOI] [PubMed] [Google Scholar]
- 26.Devanand DP, Liu X, Tabert MH, et al. Combining early markers strongly predicts conversion from mild cognitive impairment to Alzheimer’s disease. Biol Psychiatry. 2008;64:871–9. doi: 10.1016/j.biopsych.2008.06.020. [DOI] [PMC free article] [PubMed] [Google Scholar]
- 27.Ponsen MM, Stoffers D, Booij J, Van Eck-Smit BLF, Wolters EC, Berendse HW. Idiopathic hyposmia as a preclinical sign of Parkinson’s disease. Annals of Neurology. 2004;56:173–81. doi: 10.1002/ana.20160. [DOI] [PubMed] [Google Scholar]
- 28.Mesholam RI, Moberg PJ, Mahr RN, Doty RL. Olfaction in Neurodegenerative Disease. Archives of Neurology. 1998;55:84. doi: 10.1001/archneur.55.1.84. [DOI] [PubMed] [Google Scholar]
- 29.Pinto JM, Wroblewski KE, Kern DW, Schumm LP, McClintock MK. Olfactory dysfunction predicts 5-year mortality in older adults. PloS one. 2014;9:e107541–e. doi: 10.1371/journal.pone.0107541. [DOI] [PMC free article] [PubMed] [Google Scholar]
- 30.Wilson RS, Yu L, Bennett DA. Odor identification and mortality in old age. Chem Senses. 2011;36:63–7. doi: 10.1093/chemse/bjq098. [DOI] [PMC free article] [PubMed] [Google Scholar]
- 31.Pinto JM. Olfaction. Proceedings of the American Thoracic Society. 2011;8:46–52. doi: 10.1513/pats.201005-035RN. [DOI] [PMC free article] [PubMed] [Google Scholar]
- 32.Han X, Naeher LP. A review of traffic-related air pollution exposure assessment studies in the developing world. Environment International. 2006;32:106–20. doi: 10.1016/j.envint.2005.05.020. [DOI] [PubMed] [Google Scholar]
- 33.World Health Organization. [Accessed April 27, 2016];Ambient (outdoor) air quality and health. Available at: http://www.who.int/mediacentre/factsheets/fs313/en/
- 34.Agency USEP, editor. Risk and Exposure Assessment to Support the Review of the NO2 Primary National Ambient Air Quality Standard. 2008. [Google Scholar]
- 35.Wellenius GA, Schwartz J, Mittleman MA. Air pollution and hospital admissions for ischemic and hemorrhagic stroke among medicare beneficiaries. Stroke; a journal of cerebral circulation. 2005;36:2549–53. doi: 10.1161/01.STR.0000189687.78760.47. [DOI] [PubMed] [Google Scholar]
- 36.Tsai SS, Goggins WB, Chiu HF, Yang CY. Evidence for an association between air pollution and daily stroke admissions in Kaohsiung, Taiwan. Stroke; a journal of cerebral circulation. 2003;34:2612–6. doi: 10.1161/01.STR.0000095564.33543.64. [DOI] [PubMed] [Google Scholar]
- 37.Oudin A, Forsberg B, Nordin Adolfsson A, et al. Traffic-Related Air Pollution and Dementia Incidence in Northern Sweden: A Longitudinal Study. Environmental Health Perspectives. 2015 doi: 10.1289/ehp.1408322. [DOI] [PMC free article] [PubMed] [Google Scholar]
- 38.Chang KH, Chang MY, Muo CH, Wu TN, Chen CY, Kao CH. Increased risk of dementia in patients exposed to nitrogen dioxide and carbon monoxide: a population-based retrospective cohort study. PLoS One. 2014;9:e103078. doi: 10.1371/journal.pone.0103078. [DOI] [PMC free article] [PubMed] [Google Scholar]
- 39.Block ML, Calderon-Garciduenas L. Air pollution: mechanisms of neuroinflammation and CNS disease. Trends in neurosciences. 2009;32:506–16. doi: 10.1016/j.tins.2009.05.009. [DOI] [PMC free article] [PubMed] [Google Scholar]
- 40.Peel JL, Tolbert PE, Klein M, et al. Ambient air pollution and respiratory emergency department visits. Epidemiology (Cambridge, Mass) 2005;16:164–74. doi: 10.1097/01.ede.0000152905.42113.db. [DOI] [PubMed] [Google Scholar]
- 41.Favarato G, Anderson HR, Atkinson R, Fuller G, Mills I, Walton H. Traffic-related pollution and asthma prevalence in children. Quantification of associations with nitrogen dioxide. Air Quality, Atmosphere & Health. 2014:459–66. doi: 10.1007/s11869-014-0265-8. [DOI] [PMC free article] [PubMed] [Google Scholar]
- 42.Jacquemin B, Siroux V, Sanchez M, et al. Ambient air pollution and adult asthma incidence in six European cohorts (ESCAPE) Environ Health Perspect. 2015;123:613–21. doi: 10.1289/ehp.1408206. [DOI] [PMC free article] [PubMed] [Google Scholar]
- 43.Darrow LA, Klein M, Sarnat JA, et al. The use of alternative pollutant metrics in time-series studies of ambient air pollution and respiratory emergency department visits. J Expo Sci Environ Epidemiol. 2011;21:10–9. doi: 10.1038/jes.2009.49. [DOI] [PMC free article] [PubMed] [Google Scholar]
- 44.Ye F, Piver WT, Ando M, Portier CJ. Effects of temperature and air pollutants on cardiovascular and respiratory diseases for males and females older than 65 years of age in Tokyo, July and August 1980–1995. Environ Health Perspect. 2001;109:355–9. doi: 10.1289/ehp.01109355. [DOI] [PMC free article] [PubMed] [Google Scholar]
- 45.Wong TW, Lau TS, Yu TS, et al. Air pollution and hospital admissions for respiratory and cardiovascular diseases in Hong Kong. Occup Environ Med. 1999;56:679–83. doi: 10.1136/oem.56.10.679. [DOI] [PMC free article] [PubMed] [Google Scholar]
- 46.Peters A, Liu E, Verrier RL, et al. Air pollution and incidence of cardiac arrhythmia. Epidemiology (Cambridge, Mass) 2000;11:11–7. doi: 10.1097/00001648-200001000-00005. [DOI] [PubMed] [Google Scholar]
- 47.Brook RD, Kousha T. Air Pollution and Emergency Department Visits for Hypertension in Edmonton and Calgary, Canada: A Case-Crossover Study. American journal of hypertension. 2015;28:1121–6. doi: 10.1093/ajh/hpu302. [DOI] [PubMed] [Google Scholar]
- 48.Mar TF, Norris GA, Koenig JQ, Larson TV. Associations between air pollution and mortality in Phoenix, 1995–1997. Environ Health Perspect. 2000;108:347–53. doi: 10.1289/ehp.00108347. [DOI] [PMC free article] [PubMed] [Google Scholar]
- 49.Uzoigwe JC, Prum T, Bresnahan E, Garelnabi M. The emerging role of outdoor and indoor air pollution in cardiovascular disease. North American journal of medical sciences. 2013;5:445–53. doi: 10.4103/1947-2714.117290. [DOI] [PMC free article] [PubMed] [Google Scholar]
- 50.Lockwood A. The Silent Epidemic: Coal and the Hidden Threat to Health. Cambridge, MA: MIT Press; 2012. [Google Scholar]
- 51.Gamon LF, Nathanael JG, Taggert BI, Henry FA, Bogena J, Wille U. Fragmentation-Rearrangement of Peptide Backbones Mediated by the Air Pollutant NO 2. Chemistry - A European Journal. 2015;21:14924–30. doi: 10.1002/chem.201501850. [DOI] [PubMed] [Google Scholar]
- 52.Goeschen CWNWJMWU. Damage of aromatic amino acids by the atmospheric free radical oxidant. Organic & Biomolecular Chemistry. 2011;9:3380–5. doi: 10.1039/c0ob01186j. [DOI] [PubMed] [Google Scholar]
- 53.Persinger RL, Poynter ME, Ckless K, Janssen-Heininger YMW. Molecular mechanisms of nitrogen dioxide induced epithelial injury in the lung. Molecular and Cellular Biochemistry. 2002;234–235:71–80. [PubMed] [Google Scholar]
- 54.Last Ja, Sun WM, Witschi H. Ozone, NO, and NO2: oxidant air pollutants and more. Environmental Health Perspectives. 1994;102(Suppl):179–84. doi: 10.1289/ehp.94102s10179. [DOI] [PMC free article] [PubMed] [Google Scholar]
- 55.Sanström T, Stjernberg N, Eklund A, et al. Inflammatory cell response in bronchoalveolar lavage fluid after nitrogen dioxide exposure of healthy subjects: a dose-response study. Eur Respir J. 1991;3:33é–339. [PubMed] [Google Scholar]
- 56.Valko M, Leibfritz D, Moncol J, Cronin MT, Mazur M, Telser J. Free radicals and antioxidants in normal physiological functions and human disease. The international journal of biochemistry & cell biology. 2007;39:44–84. doi: 10.1016/j.biocel.2006.07.001. [DOI] [PubMed] [Google Scholar]
- 57.Calderon-Garciduenas L, Kulesza RJ, Doty RL, D’Angiulli A, Torres-Jardon R. Megacities air pollution problems: Mexico City Metropolitan Area critical issues on the central nervous system pediatric impact. Environ Res. 2015;137:157–69. doi: 10.1016/j.envres.2014.12.012. [DOI] [PubMed] [Google Scholar]
- 58.Suzman R. The National Social Life, Health, and Aging Project: An Introduction. Journal of Gerontology: Social Sciences. 2009:64–5. doi: 10.1093/geronb/gbp078. [DOI] [PMC free article] [PubMed] [Google Scholar]
- 59.O’Muircheartaigh C, Eckman S, Smith S. Statistical design and estimation for the National Social Life, Health, and Aging Project. Journal of Gerontology: Social Sciences. 2009;64B:i12–9. doi: 10.1093/geronb/gbp045. [DOI] [PMC free article] [PubMed] [Google Scholar]
- 60.Boesveldt S, Lindau ST, McClintock MK, Hummel T, Lundstrom JN. Gustatory and olfactory dysfunction in older adults: a national probability study. Rhinology. 2011;49:324–30. doi: 10.4193/rhino10.155. [DOI] [PMC free article] [PubMed] [Google Scholar]
- 61.Kern DW, Wroblewski KE, Schumm LP, Pinto JM, McClintock MK. Field Survey Measures of Olfaction: The Olfactory Function Field Exam (OFFE) Field Methods. 2014 doi: 10.1177/1525822X14547499. [DOI] [PMC free article] [PubMed] [Google Scholar]
- 62.Mueller C, Renner B. A new procedure for the short screening of olfactory function using five items from the “Sniffin’ Sticks” identification test kit. American journal of rhinology. 2006;20:113–6. [PubMed] [Google Scholar]
- 63.Brämerson A, Johansson L, Ek L, Nordin S, Bende M. Prevalence of olfactory dysfunction: the skövde population-based study. The Laryngoscope. 2004;114:733–7. doi: 10.1097/00005537-200404000-00026. [DOI] [PubMed] [Google Scholar]
- 64.Schubert CR, Cruickshanks KJ, Murphy C, et al. Olfactory impairment in adults. Ann N Y Acad Sci. 2009;1170:531–6. doi: 10.1111/j.1749-6632.2009.04102.x. [DOI] [PMC free article] [PubMed] [Google Scholar]
- 65.Pfeiffer E. A short portable mental status questionnaire for the assessment of organic brain deficit in elderly patients. J Am Geriatr Soc. 1975;23:433–41. doi: 10.1111/j.1532-5415.1975.tb00927.x. [DOI] [PubMed] [Google Scholar]
- 66.Vennemann MM, Hummel T, Berger K. The association between smoking and smell and taste impairment in the general population. Journal of neurology. 2008;255:1121–6. doi: 10.1007/s00415-008-0807-9. [DOI] [PubMed] [Google Scholar]
- 67.Frye RE, Schwartz BS, Doty RL. Dose-related effects of cigarette smoking on olfactory function. Jama. 1990;263:1233–6. [PubMed] [Google Scholar]
- 68.Katz JN, Chang LC, Sangha O, Fossel AH, Bates DW. Can comorbidity be measured by questionnaire rather than medical record review? Med Care. 1996;34:73–84. doi: 10.1097/00005650-199601000-00006. [DOI] [PubMed] [Google Scholar]
- 69.Konstantinidis I, Haehner A, Frasnelli J, et al. Post-infectious olfactory dysfunction exhibits a seasonal pattern. Rhinology. 2006;44:135–9. [PubMed] [Google Scholar]
- 70.StataCorp. Stata Statistical Software: Release 14. College Station, TX: StataCorp LP; 2015. [Google Scholar]
- 71.United States Environmental Protection Agency. [Accessed April 27, 2016];Integrated Review Plan for the Primary National Ambient Air Quality Standards for Nitrogen Dioxide. Available at: https://www3.epa.gov/ttn/naaqs/standards/nox/data/201406finalirpprimaryno2.pdf.
- 72.United States Environmental Protection Agency. [Accessed April 27, 2016];NAAQS Table. Available at: https://www.epa.gov/criteria-air-pollutants/naaqs-table.
- 73.Hudson R, Arriola A, Martínez-Gómez M, Distel H. Effect of air pollution on olfactory function in residents of Mexico City. Chemical Senses. 2006;31:79–85. doi: 10.1093/chemse/bjj019. [DOI] [PubMed] [Google Scholar]
- 74.Calderon-Garciduenas L, Franco-Lira M, Henriquez-Roldan C, et al. Urban air pollution: influences on olfactory function and pathology in exposed children and young adults. Exp Toxicol Pathol. 2010;62:91–102. doi: 10.1016/j.etp.2009.02.117. [DOI] [PMC free article] [PubMed] [Google Scholar]
- 75.Ranft U, Schikowski T, Sugiri D, Krutmann J, Krämer U. Long-term exposure to traffic-related particulate matter impairs cognitive function in the elderly. Environmental Research. 2009;109:1004–11. doi: 10.1016/j.envres.2009.08.003. [DOI] [PubMed] [Google Scholar]
- 76.Cullen MM, Leopold DA. Disorders of smell and taste. The Medical clinics of North America. 1999;83:57–74. doi: 10.1016/s0025-7125(05)70087-0. [DOI] [PubMed] [Google Scholar]
- 77.Doty RL. The olfactory vector hypothesis of neurodegenerative disease: is it viable? Ann Neurol. 2008;63:7–15. doi: 10.1002/ana.21327. [DOI] [PubMed] [Google Scholar]
- 78.Oberdorster G, Sharp Z, Atudorei V, et al. Translocation of inhaled ultrafine particles to the brain. Inhalation toxicology. 2004;16:437–45. doi: 10.1080/08958370490439597. [DOI] [PubMed] [Google Scholar]
- 79.Taylor P, Morin R, Cohn D, Wang W. [Accessed June 12, 2016];American Mobility: Who Moves? Who Stays Put? Where’s Home? 2008 Available at: http://www.pewsocialtrends.org/files/2010/10/Movers-and-Stayers.pdf.
- 80.Sarnat JA, Brown KW, Schwartz J, Coull BA, Koutrakis P. Ambient gas concentrations and personal particulate matter exposures: implications for studying the health effects of particles. Epidemiology (Cambridge, Mass) 2005;16:385–95. doi: 10.1097/01.ede.0000155505.04775.33. [DOI] [PubMed] [Google Scholar]