The Cancer Cell Line Encyclopedia1 (CCLE) and Cancer Genome Project2 (CGP) are two independent large-scale efforts to characterize genomes, mRNA expression, and anti-cancer drug dose–responses across cell lines, providing a public resource relating cellular biochemical context to drug sensitivity. A recent study3 analysed correlations between reported dose–response metrics and found inconsistency between CCLE and CGP, thus questioning the validity of not only these, but also other current and future costly large-scale studies. Here, we examine two metrics of drug responsiveness (slope and area under the curve) that we derive from the original CCLE and CGP data, and find reasonable and statistically significant consistency. Our results revive confidence that the CCLE and CGP drug dose–response data are of sufficient quality for meaningful analyses. There is a Reply to this Comment by Safikhani, Z. et al. Nature 540, http://dx.doi.org/10.1038/nature20581 (2016).
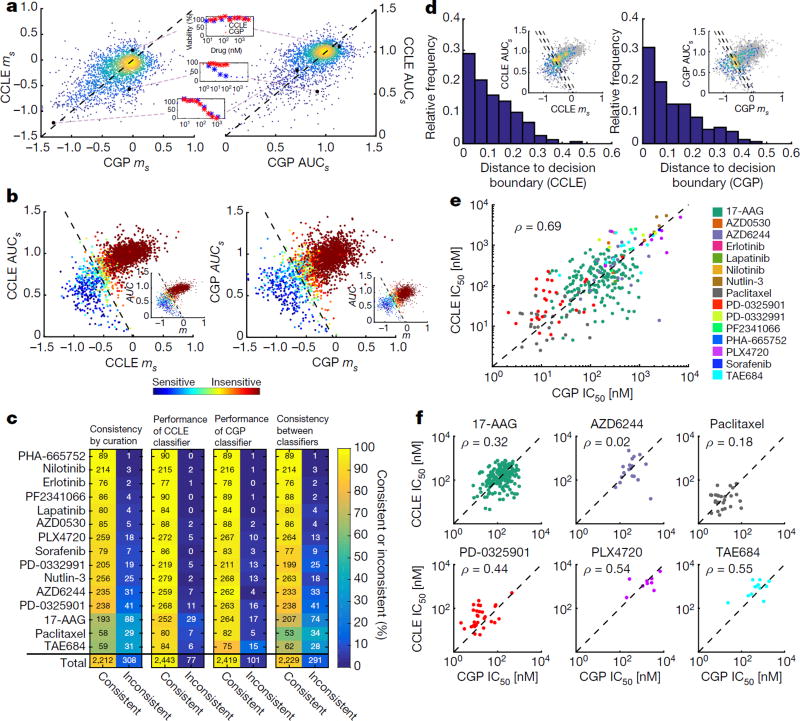
CCLE and CGP share 2,520 dose–responses across 285 cell lines and 15 drugs, but cells were treated with different dose ranges. To compare CCLE and CGP dose–responses, we calculated a common viability metric (0–100%) across a shared log10-dose range, and computed slope (ms) and area under the curve (AUCs) values (in which subscript ‘s’ denotes the shared dose range) (Fig. 1a). This analysis revealed surprisingly good quantitative agreement between the two studies (ms: population Pearson correlation coefficient (ρ) = 0.52, P < 10−16; AUCs: ρ = 0.61, P < 10−16). Furthermore, since a small ms or large AUCs value indicates insensitivity, these data suggest that most cell lines are insensitive to the majority of tested drugs (~85%, Fig. 1a, b). Characterizing such insensitive trends with a sigmoid model meant for sensitive cell lines (that is, half-maximum inhibitory concentration, IC50) may lead to incorrect dataset consistency conclusions.
Figure 1. Consistency between pharmacological data in CCLE and CGP.
a, Slope (ms; left) or area under the curve (AUCs; right) of the dose–response curves for all overlapping drug/cell line pairs (2,520) in CCLE and CGP, considering only the shared dose range (denoted by subscript s). All ms and AUCs values were normalized based on the respective drug dose range, to facilitate comparison across drugs (see Supplementary Methods). Colour indicates density of dots. The black dashed line is x = y. In example dose–response curves, stars represent the shared dose range. b, Relationship between ms and AUCs for each database (inset m and AUC defined with the entire dose range as opposed to the shared dose range). The SVM classifier decision boundary divides the plot into sensitive and insensitive drug/cell line pairs, as indicated by the black dashed line. Slope and y-intercept of boundary line for CCLEs: m = −1.32, b = −0.01; CGPs: m = −1.31, b = −0.06. Colour of dots indicates the mean of the binary classifications from eight manual curators; blue indicates a unanimous sensitivity rating, green a very uncertain rating, and red a unanimous insensitivity rating. c, Consistency (left) and inconsistency (right) of classification methods broken down by drug. Far left plot shows manual curation consistency between CCLE and CGP. Middle left plot shows consistency between the manual curation data from CCLE and the CCLE SVM classifier. Middle right plot shows consistency between the manual curation data from CGP and the CGP SVM classifier. Far right plot shows consistency between the CCLE SVM classifier used to classify CGP data and the CGP SVM classifier used to classify CCLE data. Colour indicates percentage consistency as denoted by the colour bar. Numbers denote number of observations, black for consistent, white for inconsistent. d, Inconsistent drug/cell line pairs based on manual curation results. Histograms bin the Euclidian distance between each discrepantly classified drug/cell line pair (that is, called sensitive in one database and insensitive in the other) and the decision boundary (black dashed line) in the AUCs versus ms plots for CCLE (left) or CGP (right). In inset, coloured dots indicate drug/cell line pairs that were classified discrepantly in CCLE and CGP. Colour corresponds to density of dots. Black dashed line indicates the decision boundary for the SVM classifier. Grey dashed lines indicate a Euclidian distance of 0.1 from the decision boundary in either direction e, IC50 values from all sensitive cell line/drug combinations as determined by SVM classifier in CCLE or CGP. The black dashed line is x = y. f, IC50 values from all sensitive cell line/drug pairs (same as in Fig. 1e) stratified by drug, for drugs having at least 5 points. All correlation coefficients are Pearson.
To evaluate consistency of sensitivity classification between the two studies, we first asked eight people to curate binary sensitivity manually (all dose–response curves and their manually curated classification results are provided in the Supplementary Information). For manual curation, only data from a single database within the shared dose range was presented on each plot, and the order of plot presentation was randomized with respect to the study, the drug, and the cell line for each curator (see Extended Data Figs 1 and 2). Using the manual curation results, we built a separate support vector machine (SVM) classifier for each study with ms and AUCs as predictors (Fig. 1b). Both SVMs performed well (Fig. 1c, middle two plots), and the decision boundaries are independently similar for CCLE and CGP (Fig. 1b, black dashed line). These SVM classifiers also seem to parse data derived from the full (not shared) range of drug doses effectively (Fig. 1b; insets; m and AUC without subscript s), which may be important for future, database-specific analyses.
The manual curation data along with the SVM classifiers allowed evaluation of consistency between CCLE and CGP in terms of binary sensitivity classification (Fig. 1c). Comparison of manual curation results shows high (~88%) and statistically significant consistency between the two studies overall (Cohen’s kappa (κ) = 0.53±0.025), and for most individual drugs (Fig. 1c, far left). Using the CCLE SVM to classify CGP data, and vice versa (Fig. 1c, far right), also yielded high and statistically significant consistency (88%, κ = 0.55±0.025). These results strongly suggest that drug dose–response data in the CCLE and CGP can be considered consistent when used to classify binary sensitivity.
The drugs 17-AAG, paclitaxel and TAE684 account for 48% of the inconsistent drug/cell line pairs. We hypothesized that most of these and other inconsistent drug/cell line pairs would be located near the SVM decision boundary. The primary reason is because this boundary necessarily travels through the region of AUCs–ms space where determining binary sensitivity is the most challenging for manual curators (Fig. 1b, cyan to yellow dots denote uncertainty among curators). If true, then this would imply that a main factor driving the observed inconsistency is self-induced: imposing a strict cutoff. Indeed, most such inconsistent points are located close to the decision boundary; for CCLE 53% of the inconsistent points are within 0.1 distance units from the decision boundary, and 51% for CGP (Fig. 1d). Manual inspection of these inconsistent binary classification cases also supports this interpretation (Supplementary Data 1). We do observe some strongly inconsistent drug cell/line pairs (for example, Fig. 1a inset-middle, and Supplementary Data 1), but these are relatively rare, and are highly likely to be located far from a decision boundary. These results suggest that inconsistency between the two studies on the level of binary classification is, to a large extent, a result of the information loss associated with collapsing a two-dimensional continuous description of drug sensitivity onto a single binary variable. Thus, we propose that drug sensitivity is better described as a spectrum (AUC and m) than as a binary classification.
We next re-calculated and compared IC50 data only from drug/cell line pairs determined to be sensitive in either CCLE or CGP by the SVM classifier (another requirement was the existence of a non-extrapolated IC50 value). We found good correlation between the two studies overall (Fig. 1e; ρ = 0.69, P < 0.0001). However, stratification by drug generally yields poor IC50 correlations (Fig. 1f). Thus, caution should be taken for inference of IC50 values for specific cell line/drug combinations from CCLE and CGP, despite consistency on the level of slope, area under the curve, and binary sensitivity classification. Haibe-Kains et al.3 stratified IC50 by drug for sensitive and insensitive lines (IC50 values for insensitive lines are unreliable), which contributed to their conclusion of inconsistency.
We conclude that the drug dose–response data in CCLE and CGP are acceptably consistent for most cases. Furthermore, we made no attempts to remove potentially suspect dose–response data, but doing so in future efforts could further facilitate data usability. That the two studies are this consistent is quite remarkable, given the different viability assays used, as well as inescapable confounding factors such as cell confluency, clonal variations, genomic drift, different drug suppliers/batches, laboratories/equipment and serum composition. This suggests that the measured genomic and gene expression parameters may provide a robust cellular context that dictates drug sensitivity.
Methods
For each drug/cell line pair found in both CCLE and CGP, we calculated the slope and AUC of each dose–response curve (percentage cell viability versus log10 drug dose) only in the shared dose range. These values were normalized to account for different dose ranges used by each drug. One CCLE point and one CGP point defined boundaries of the shared dose range to maximize data coverage. IC50 values were calculated as the drug concentration needed to reach 50% cell viability (using a fit to a sigmoid response model) if within the shared dose range (see Supplementary Methods). All scripts and data needed to reproduce the figures, including the MATLAB code, are provided in Supplementary Data 2.
Supplementary Material
Extended Data
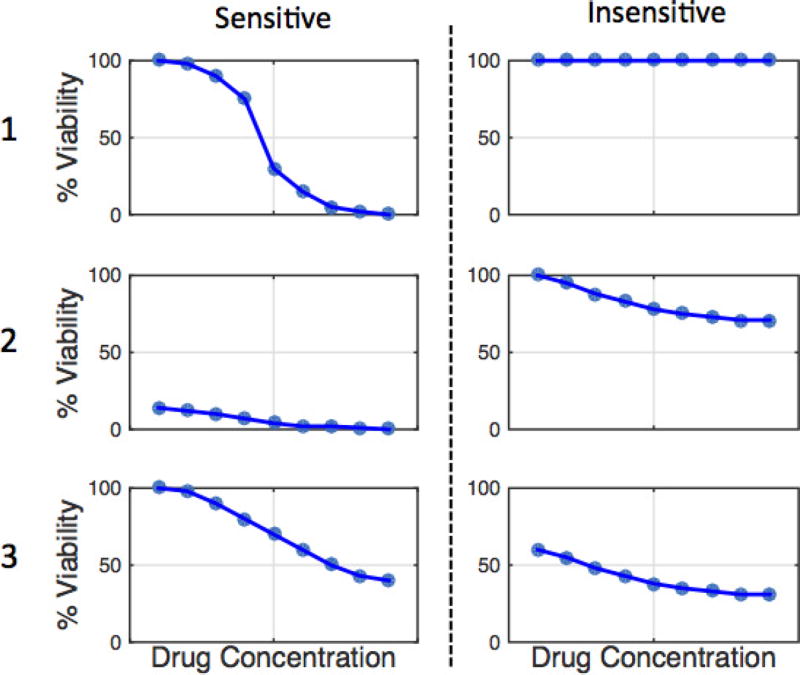
Extended Data Figure 1. Examples of typical sensitive versus insensitive dose–response curves.
This document was given to manual curators as example dose–response curves. These idealized data represent various dose–response curves one might encounter in CCLE and/or CGP and indicate how they should be classified.
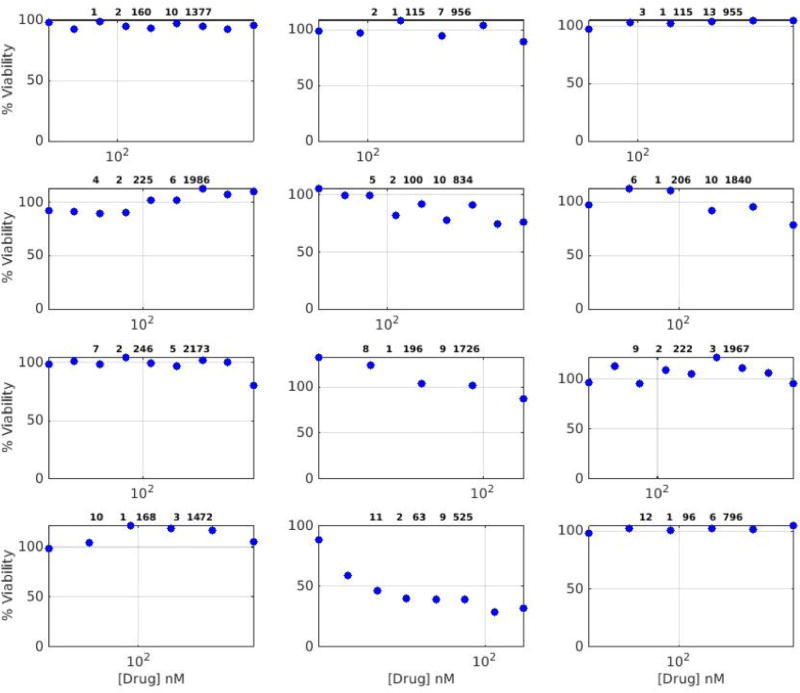
Extended Data Figure 2. Examples of what the manual curators received.
This is one page, as an example, from the data given to manual curators, which they were instructed to rate as either sensitive or insensitive.
Footnotes
Supplementary Information is available in the online version of the paper.
Author Contributions M.R.B. conceived of the study. M.B. and M.R.B. performed the analyses and wrote the paper. M.S.D. prepared CCLE and CGP data for analysis and performed preliminary analyses. E.A.R., E.C., H.Y.H., D.C.J., G.R.S., A.D.S., S.S.S. and T.V.T. served as manual curators.
Competing Financial Interests Declared none.
References
- 1.Barretina J, et al. The Cancer Cell Line Encyclopedia enables predictive modelling of anticancer drug sensitivity. Nature. 2012;483:603–607. doi: 10.1038/nature11003. [DOI] [PMC free article] [PubMed] [Google Scholar]
- 2.Garnett MJ, et al. Systematic identification of genomic markers of drug sensitivity in cancer cells. Nature. 2012;483:570–575. doi: 10.1038/nature11005. [DOI] [PMC free article] [PubMed] [Google Scholar]
- 3.Haibe-Kains B, et al. Inconsistency in large pharmacogenomic studies. Nature. 2013;504:389–393. doi: 10.1038/nature12831. [DOI] [PMC free article] [PubMed] [Google Scholar]
Associated Data
This section collects any data citations, data availability statements, or supplementary materials included in this article.


