

Abstract
Background
Endothelial progenitor cells (EPCs) are attenuated, both in number and functionality, in animal models of chronic cardiovascular and metabolic disorders. This effect has subsequently been linked to the aggravation of long-term morbidity and mortality associated with such disorders. The objective was to examine EPC number and survival in chronic diabetic vs nondiabetic patients in conjunction with the examination of their redox, inflammatory, and antioxidant defense system (Nrf2 genes) status in serum and visceral fat.
Methods
Visceral adipose tissue from diabetic and nondiabetic patients undergoing coronary artery bypass graft surgery was analyzed for Nrf2-dependent genes. Oxidative stress was evaluated using thiobarbituric acid-reactive substance assay (TBARS). Peripheral blood, collected 1 day prior to surgery, was evaluated for inflammatory cytokines and EPCs.
Results
When compared with controls (P < 0.05), results of the thiobarbituric acid-reactive substance assay were higher in diabetic patients. Although Nrf2-dependent antioxidant proteins (thioredoxin-1 [Trx-1], nicotinamide adenine dinucleotide phosphate [NAD(P)H] qui-none oxidoreductase [NQO1], glutathione S-transferase [GST]) were upregulated, heme oxygenase (HO-1) and adiponectin protein expression were lower in the diabetic group (P < 0.05). Serum levels of bilirubin were lower (P < 0.005) while the levels of inflammatory cytokines were higher in diabetic patients (P < 0.05). EPC levels and their colony forming units were significantly lower (P < 0.05) with reduced viability in diabetic patients as compared with nondiabetic patients.
Conclusions
These results demonstrate for the first time that in diabetic patients, there is an inadequate heme oxygenase-adiponectin axis response, which could compromise the compensatory antioxidant and anti-inflammatory effects consequently contributing toward EPC dysfunction in these patients.
Diabetes mellitus (DM) is characterized by the development of widespread vascular complications that are responsible for most of the morbidity and mortality associated with the disease. These complications are manifested as endothelial dysfunction and cell death with hypertension, atherosclerotic coronary artery, and peripheral obstructive vascular and cerebrovascular diseases. Type 2 diabetes is an important cardiovascular (CV) risk factor.1 Studies have suggested that an increase in oxidative stress is the main metabolic abnormality involved in the development of diabetic complications.2 Endothelial progenitor cells (EPCs) are bone marrow cells that have the capacity to migrate to the peripheral circulation and to differentiate into mature endothelial cells. EPCs play a significant role in the re-endothelialization and neovascularization of the injured endothelium.3 EPC migration, differentiation to a mature endothelial phenotype, adhesive properties,3 the capacity to proliferate, and to incorporate into vascular structures are all impaired by diabetes.4 Several clinical conditions characterized by both increased inflammation and oxidative stress, such as DM, are associated with a reduced number and impaired functionality of EPCs.5 Hyperglycemia can increase reactive oxygen species (ROS) production in many cell lines, including EPCs.6 Remnant-like lipoproteins (RLPs), the lipolytic products of triglyceride-rich lipoproteins have been reported to reduce EPC function by increasing oxidative stress and reducing nitric oxide synthase activity.7
In mammalian tissues, the transcription factor, Nrf2, is the master regulator of cellular antioxidant defenses. Nicotinamide adenine dinucleotide phosphate (NAD[P]H) quinone oxidoreductase (NQO1), glutathione S-transferase (GST), heme oxygenase-1 (HO-1), and thioredoxin-1 (Trx-1) are among the well-studied Nrf2 target genes that are upregulated through the antioxidant response regulatory element in response to oxidative stress.8 Activation of Nrf2 by sulforaphane suppressed hyperglycemia-induced ROS and metabolic dysfunction in human microvascular endothelial cells.9 One important Nrf2-target gene, HO-1, is viewed as playing an increasingly important role in cellular protection.8 HO-1 was found to protect against oxidative insult in CV diseases and diabetes.10 The protective effects of HO-1 arise from its capacity to increase degradation of the heme moiety from destabilized heme proteins and to generate biliverdin and bilirubin, which possess potent antioxidant properties and are cytoprotective in the CV system.11 Furthermore, HO-1 gene expression has been shown to protect against ischemia and reperfusion and to prevent vascular dysfunction in experimental diabetes.12 HO-1 has also potent anti-inflammatory functions but its mechanism of action is not fully understood.13
Adiponectin is a circulating adipose tissue-derived a hormone that is downregulated in obese individuals. The HO-1 system has also been shown to attenuate dysfunctional adipogenesis and promote healthy adipocyte function including the enhancement of adiponectin synthesis and release.14 Experimental studies show that adiponectin plays a protective role in the development of insulin resistance, atherosclerosis, and inflammation.15
We have recently reported the impaired EPC function and recruitment in diabetic rats amenable to rescue via HO-1 induction by treatment with cobalt protoporphyrin.16 This protective effect of HO-1 induction was accompanied by the stimulation of adiponectin synthesis and release from adipose tissues. In light of this evidence, the current study was to characterize the long-term effects of glucose control on EPC survival in diabetic vs nondiabetic patients. We report here that EPC function and survival negatively correlates with the circulating levels of HbA1c (an index of long-term glucose control). This effect of chronic hyperglycemia on EPC function is accompanied by a systemic inflammatory response along with the suppression of the HO-1 adiponectin axis, thus reducing the antioxidant cellular response.
Methods
Patients
The experimental group comprised 15 diabetic (type 2) and 15 nondiabetic patients undergoing coronary artery bypass graft surgery (CABG). In both groups only patients currently treated with statins were included. Contraindications to inclusion in both groups were anemia (hemoglobin < 10 g/dL), renal insufficiency (creatinine ≥ 2.5 mg/dL), insulin treatment, history of an acute coronary syndrome (ACS) or revascularization in the past 3 months, any type of malignancy, or hematologic disorder. The diabetic groups were diagnosed with diabetes type 2 at least 5 years prior to the study and were treated with the following medications: Glucophage (Bristol-Myers Squibb, Princeton, NJ) or Gluben (Dexxon, Or Akiva, Israel). The study was approved by the Investigational Review Board (Ethics Committee) of the Rabin Medical Center, Israel, and all subjects signed a written informed consent form.
Tissue collection from coronary artery disease subjects
Human visceral adipose tissue was collected from coronary artery disease (CAD) patients undergoing coronary artery bypass graft surgery. Tissue was frozen immediately upon removal.
Lipid peroxidation
Protein was extracted from adipose tissue by glass-on-glass homogenization in Mueller buffer (50 mM HEPES [pH 7.4], 0.1% Triton X-100, 4 mM ethylene glycol tetraacetic acid, 10 mM ethylenediaminetetraacetic acid, 15 mM Na4P2O7 *H2O, 100 mM _-glycerophosphate, 25 mM NaF, and double-distilled H2O), protease inhibitor cocktail, phosphatase inhibitor cocktail 1 and 2 (Sigma, St Louis, MO) and double-distilled H2O. Samples were centrifuged at 13,000g for 10 minutes, and the supernatant was stored at −70°C. Thiobarbituric acid-reactive substance assay (TBARS) production was measured according to the manufacturer's instructions using a TBARS assay kit (Cayman Chemical Company, Ann Arbor, MI).
mRNA isolation and real-time PCR quantification
Total RNA was isolated using Trizol (Invitrogen, Carlsbad, CA) according to the manufacturer's instructions. Equal amounts of RNA (1 μg) was reverse-transcripted into cDNA using the Transcriptor First Strand cDNA Synthesis Kit (Roche, Branford, CT). The quantitative real-time (qRT) polymerase chain reaction (PCR) was performed with the TaqMan gene expression assay on an ABI Prism 7900 sequence analyzer according to the manufacturer's recommended protocol (Applied Biosystems, Foster City, CA). Each reaction was run in triplicate. The comparative threshold cycle (CT) method was used to calculate the amplification fold as specified by the manufacturer. A value of 10 ng of reverse-transcribed RNA samples was amplified by using the TaqMan Universal PCR Master Mix and TaqMan gene expression assays (ID Hs01055564_m1 for human BMP-2, ID Hs00231692_m1 for RUNX2, ID HS99999901_s1 for 18S as an endogenous control; Applied Biosystems).
Western blot analysis
Frozen visceral adipose tissues were pulverized under liquid nitrogen and placed in a homogenization buffer and homogenates were centrifuged at 27,000g for 10 minutes at 4°C. The supernatant was isolated and protein levels were determined by immunoblotting with antibodies against HO-1 (Stressgen Biotechnologies Corp, Victoria, BC), Trx-1, NQO1, GST, and adiponectin antibodies were obtained from Cell Signaling Technology, Inc (Beverly, MA). Immunoblotting was performed as previously described.16
Blood samples
One day before surgery, after overnight fasting, venous blood was drawn from an antecubital vein for serum levels of inflammatory cytokines and EPC testing (blood drawn in heparinized tubes). Blood samples for HbA1c, cholesterol, high-density lipoprotein (HDL), low-density lipoprotein (LDL), triglycerides, and bilirubin were processed within 1 hour of blood collection, according to the manufacturer's protocol.
Inflammatory cytokines and bilirubin
Serum samples frozen at −20°C for tumour necrosis factor (TNF)-α, monocyte chemotactic protein-1 (MCP-1), interleukin (IL)-6 were determined using enzyme-linked immunosorbent assay (ELISA) kits (Bender Medsystems, Burlingame, CA), according to the manufacturer's protocol.
Circulating EPC level and function
Circulating EPC levels were quantified by the measurement of surface markers—vascular endothelial growth factor receptor 2 (VEGFR-2), cluster of differentiation (CD)34, and CD133 using flow cytometry. Functional aspects of EPCs were evaluated by 3-(4,5-dimethylthiazol-2-yl)-2,5-diphenyltetrazolium bromide (MTT) assays of the cultured cells after 7 days of culture.
Isolation of mononuclear cells and EPC colony formation
Peripheral mononuclear cells (PMNCs) were fractionated using Ficoll density-gradient centrifugation. Isolated PMNCs were resuspended with Medium 199 (Invitrogen, Carlsbad, CA) supplemented with 20% fetal calf serum (Gibco BRL Life Tech, Gaithersburg, MD). Isolated cells were resuspended in Medium 199 and plated on 6-well plates coated with human fibronectin at a concentration of 5 × 10⁶ cells per well. After 48 hours, the nonadherent cells were collected and replated onto fibronectin-coated 24-well plates (106 cells per well). EPC colonies were counted using an inverted microscope 7 days after plating. An EPC colony was defined as a cluster of at least 100 flat cells surrounding a cluster of rounded cells, as previously described.17 A central cluster alone without associated emerging cells was not counted as a colony. To confirm endothelial cell lineage, indirect immunostaining of randomly selected colonies was performed with antibodies directed against VEGFR-2, CD31 (Becton Dickinson, Franklin Lakes, NJ) and Tie-2 (Santa Cruz Biotechnology, Paso Robles, CA). Results are expressed as the mean number of colony-forming units (CFUs) per well.
Flow cytometry
Aliquots of PMNCs were incubated with monoclonal antibodies against VEGFR-2 (FITC labelled) (R&D, Minneapolis, MN (CD45-CYT5.5 (Dako, Glostrup, Denmark) and either CD133 (PE-labelled) (Miltenyi Biotech, Auburn, CA) or CD34 (PE-labelled) (Miltenyi Biotech). Isotype-identical antibodies were used as controls. After incubation, cells were washed with phosphate-buffered saline and analyzed with a flow cytometer (FACS Calibur; Becton Dickinson, Chicago, IL). CD34 or CD133-positive cells were examined for VEGFR-2 expression. Analyses were performed in duplicate. Results are presented as the percentage of PMNCs (after selection for CD45+ and exclusion of debris) coexpressing either VEGFR-2 and CD133, or VEGFR-2 and CD34.
MTT assay
To evaluate the viability of cultured EPCs in randomly selected patients in each group, we performed the MTT assay. MTT measures mitochondrial activity in living cells. After 7 days of culture, 1 mg/mL MTT (Sigma) was added to the EPC medium culture and incubated for an additional 3–4 hours. After incubation, the medium was removed and the cells were solubilized in isopropanol as previously described.17
Statistical analysis
EPC parameter comparison between the 2 groups were performed by Wilcoxon matched-pairs signed-rank, 2-tailed test. The MTT comparisons were performed in subgroups and were compared by Wilcoxon nonmatched test. Other parameters in the study were performed by the paired Student t test (2-tailed). The analyses were performed using SPSS version 15 statistical software (SPSS Inc, Chicago, IL) and P < 0.05 was considered statistically significant.
Results
Patient characteristics
Clinical characteristics and current medications were similar between the 2 experimental groups (diabetic and nondiabetic patients) with the exception that HbA1c (P < 0.002; Table 1), blood sugar (P = 0.005; Table 1) and bilirubin levels (P < 0.005; Table 1) were lower in diabetic patients.
Table 1. Patient characteristics.
| Nondiabetes (n = 15) | Diabetes (n = 15) | |
|---|---|---|
| Age (y) | 56.5 ± 10.4 | 64.1 ± 10.5 |
| Female, n (%) | 2 (13) | 3 (20) |
| Body mass index* | 27.1 ± 2.74 | 28.9±5.48 |
| Hypertension, n (%) | 10 (67) | 13 (87) |
| Current smoker, n (%) | 4 (27) | 6 (40) |
| CRP (nmol/L) | 0.57 ± 0.16 | 0.44 ± 0.14 |
| Blood glucose (mmol/L) | 9.22 ± 0.935† | 5.17 ± 0.715 |
| HgA1C, % (proportion of total hemoglobin) | 7.78 ± 0.9 (0.077)‡ | |
| Triglycerides (mmol/L) | 2.21 ± 0.73 | 1.64 ± 0.41 |
| Total cholesterol (mmol/L) | 4.62 ± 0.77 | 4.13± 0.72 |
| HDL cholesterol (mmol/L) | 1.11 ± 0.18 | 1.08 ± 0.28 |
| LDL cholesterol (mmol/L) | 2.17 ± 0.56 | 2.63 ± 0.67 |
| Bilirubin (μmol/L) | 9.91 ± 1.5§ | 16.24 ± 2.71 |
CRP, C-reactive protein; HDL, high-density lipoprotein; HgA1C, glycosylated hemoglobin; LDL, low-density lipoprotein.
Body mass index calculated as weight (kg)/height (m2)
P = 0.001.
P = 0.002.
P < 0.005.
Effects of diabetes on mRNA expression levels of Nrf2-dependent genes
Nrf2 is the principal regulator of antioxidant defense enzymes and responds rapidly under conditions of altered redox homeostasis. PCR analysis of visceral adipose tissue extracts revealed a significant increase in Nrf2-dependent genes including Trx-1, GST, NQO1, and HO-1. These results demonstrate that adipose tissues of diabetic patients are under severe oxidative stress and the Nrf2-mediated antioxidant response is activated (P < 0.05; Fig. 1).
Figure 1.
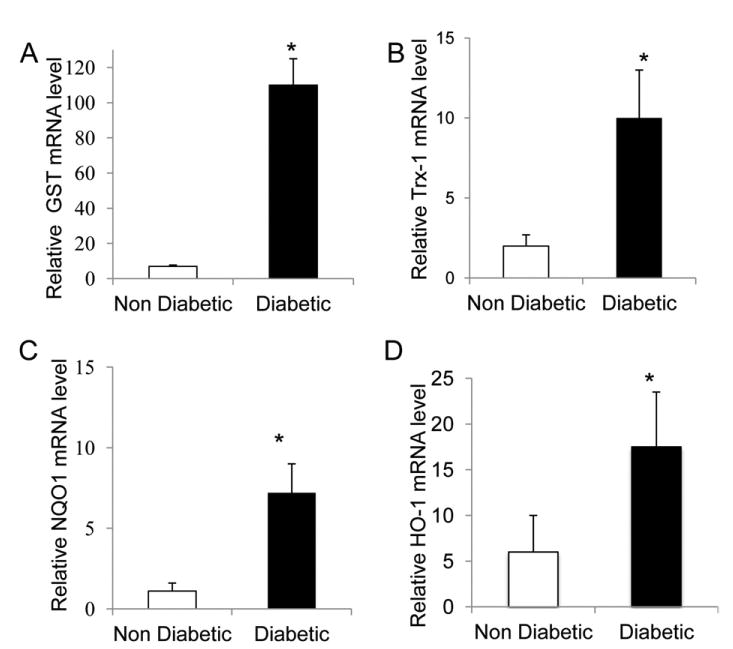
mRNA levels of Nrf2-dependent genes in adipose tissue from diabetic and nondiabetic subjects. The data presented are relative mRNA level normalized to β-actin mRNA level. The mRNA levels of (A) glutathioneS-transferase (GST), (B)thioredoxin-1 (Trx-1), (C) nicotinamide adenine dinucleotide phosphate (NAD[P]H) quinone oxidoreductase (NQO1), and (D) heme oxygenase (HO-1) were significantly higher in diabetic patients than in control subjects (*P < 0.05; n = 15 in each group).
The effects of diabetes on the protein expression of Nrf2-dependent genes in adipose tissue
Because mRNA of Nrf2-dependent genes was increased in the diabetic group, we evaluated the protein levels of these genes. In the diabetic patients the protein levels of Trx-1, GST, and NQO1 significantly increased (Fig. 2A-C, P < 0.05). In contrast, the levels of HO-1 protein expression showed a significant decrease in diabetic patients compared with the nondiabetic patients (P < 0.05; Fig. 2D).
Figure 2.
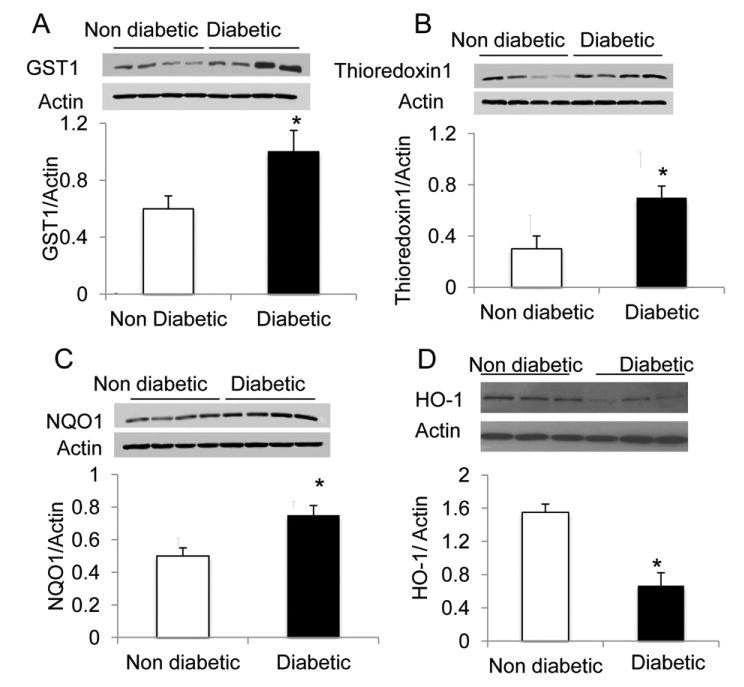
Representative Western blot of Nrf2 dependent genes in adipose tissue from different diabetic and nondiabetic patients. The protein levels of (B) thioredoxin-1 (Trx-1), (A) glutathione S-transferase (GST), and (C) nicotinamide adenine dinucleotide phosphate (NAD[P]H) quinone oxidoreductase (NQO1) were significantly higher in diabetic patients than in control subjects (A-C; *P < 0.05; n = 15 in each group), while (D) heme oxygenase (HO-1) protein levels in the diabetic patients were decreased (*P < 0.05; n = 15 in each group).
Effects of diabetes on adiponectin expression in visceral adipose tissue
Activation of the HO-1 system has been linked to downstream stimulation of adiponectin synthesis and release. Adiponectin in diabetic patients was significantly lower (3-fold) compared with that of nondiabetic patients (P < 0.005; Fig. 3).
Figure 3.
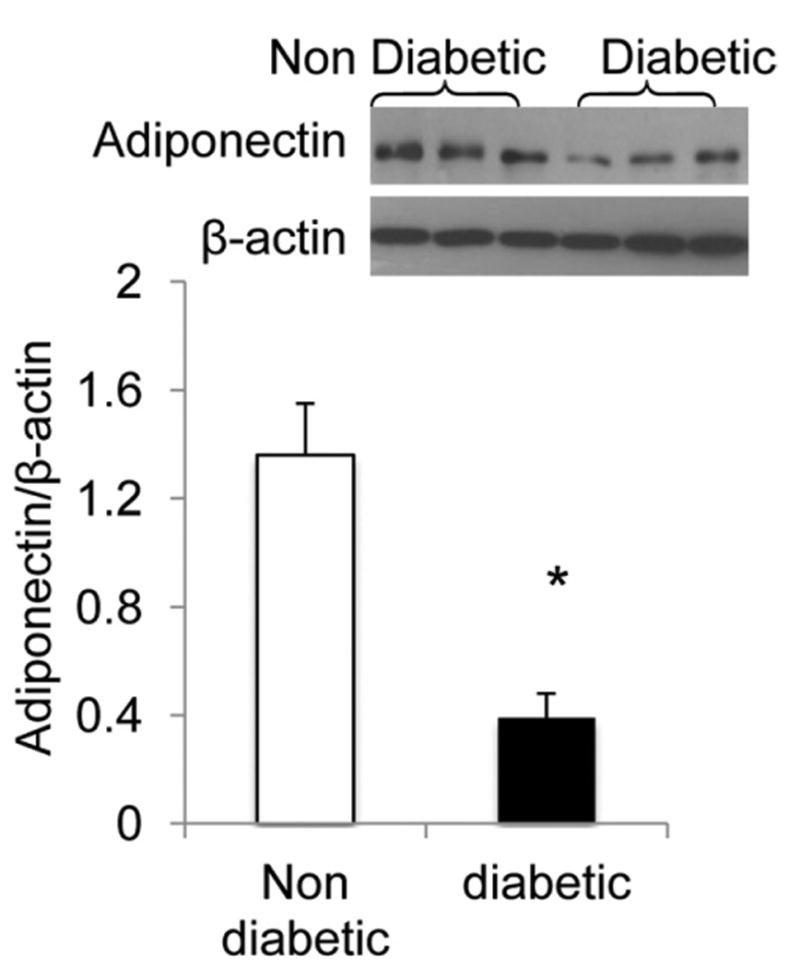
Representative Western blot of adiponectin in adipose tissue from different diabetic and nondiabetic patients. The analysis shows lower levels of protein in the diabetic patients (*P < 0.005; n =10 in each group).
Effects of diabetes on circulating levels of inflammatory cytokines
Lipid peroxidation in adipose tissue is shown in Figure 4, A. TBARS content of adipose tissue in diabetic patients was significantly higher (2.5-fold) compared with nondiabetic patients (P < 0.05; Fig. 4, A). Clinical and experimental data support a link between endothelial dysfunction and inflammation. We examined the levels of TNF-α, IL-6, and MCP-1 in the serum of the 2 groups and found that the serum levels of all 3 inflammatory cytokines were significantly higher in the diabetic patients compared with control subjects (2.1-, 1.9-, and 1.7-fold, respectively, P < 0.005; Fig. 4, B–D).
Figure 4.
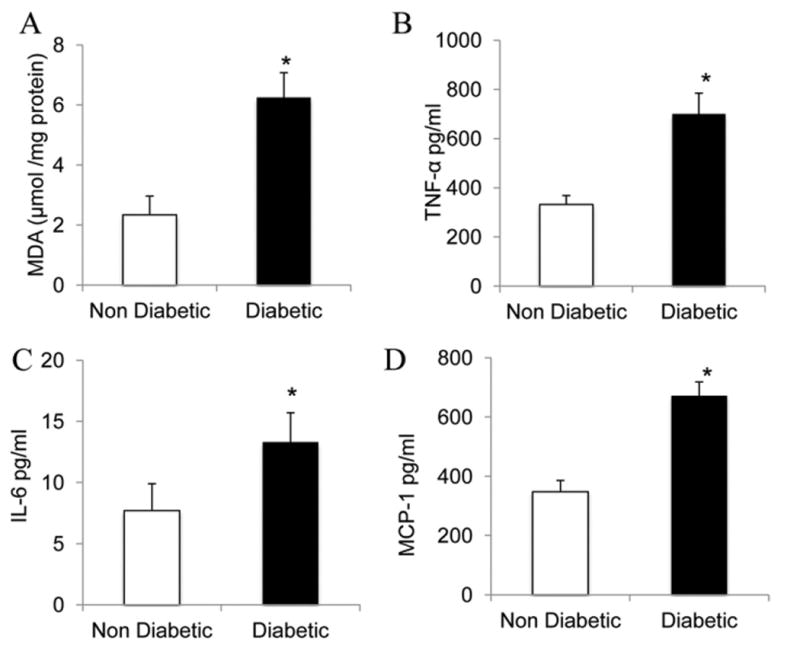
(A) Lipid peroxides in adipose tissue from diabetic and nondiabetic subjects. The thiobarbituric acid-reactive substance assay (TBARS) levels of adipose tissue are significantly higher in diabetic patients than in controls (P < 0.05; n = 15 in each group). (B-D) Enzyme-linked immunosorbent assay (ELISA) analysis for inflammatory cytokines in the serum of diabetic and nondiabetic subjects. The levels of (B) TNF-α, (C) IL-6, and (D) MCP-1 were higher in the diabetic patients group compared with the nondiabetic group (*P < 0.005; n = 10 in each group).
Effect of diabetes on circulating levels of EPCs
We examined the endothelial cell lineage, by indirect immunostaining of randomly selected colonies with antibodies directed against VEGFR-2, CD31, and Tie-2 confirming the endothelial cell lineage (Fig. 5, A). The number of circulating EPCs was assessed by flow cytometry (FACS Calibur, Becton Dickinson, Chicago, IL). Cells expressing EPC markers within the lymphocytic population, were significantly lower in diabetic patients compared with nondiabetic control subjects, reflecting lower levels of circulating EPCs (P < 0.05; Fig. 5, B). We did not find statistically significant correlations between the circulating levels of EPCs and the levels of the HbA1c in the diabetic patients.
Figure 5.
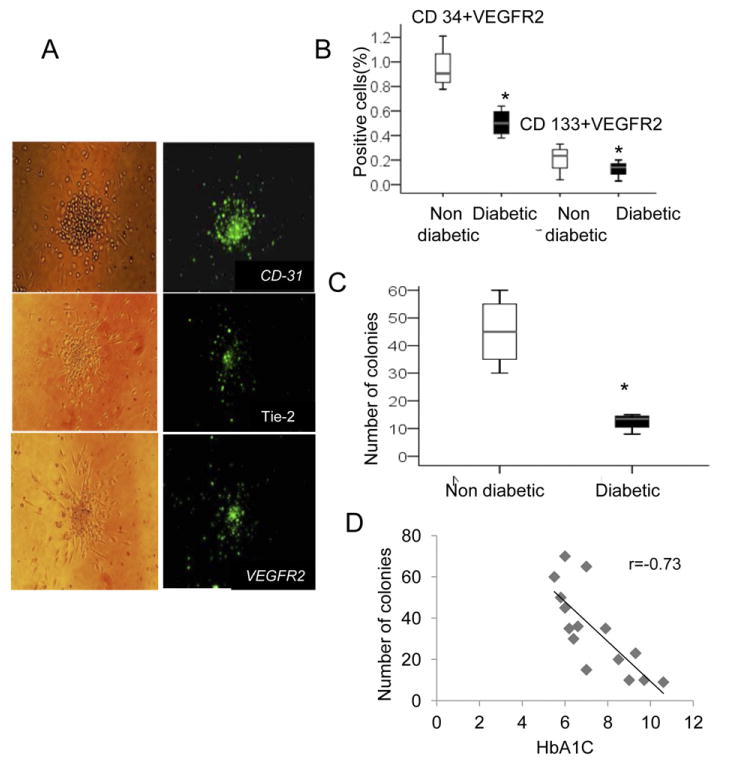
(A) Endothelial cell lineage: immunostaining of randomly selected colonies with antibodies directed against VEGFR-2, CD31, and Tie-2 confirming the endothelial cell lineage. (B) The proportion of peripheral mononuclear cells (PMNCs) that coexpressed VEGFR-2 and CD133, or VEGFR-2 and CD34: diabetic patients (n = 15) were compared with nondiabetic patients (n = 15). Diabetic patients had a lower proportion of cells that were VEGFR-2+CD133+ and a lower proportion of VEGFR-2+CD34+ cells than their controls, reflecting lower levels of circulating endothelial progenitor cells (EPCs) (*P < 0.05). (C) Quantification of EPC as number of colonies per well. Analysis of EPC colony-forming units (CFUs) after 7 days of culture among the diabetic patients group (n = 15) vs control group (n = 15). The number of CFUs per well was lower among the diabetic patients, (*P < 0.005). (D) Scatter plot of HbA1c and cell CFUs: the ability to form colonies in the diabetic patient was inversely correlated with HbA1c levels (P < 0.01; n = 15).
Effect of diabetes on EPC function and survival
The number of EPC CFUs after 7 days of culture was also lower (3-fold) among the diabetic patients compared with the control subjects (P < 0.005; Fig. 5, C). There was an inverse correlation in diabetic patients between the ability to form colonies and HbA1c levels (P < 0.01; Fig. 5, D).
Viability of the cells (MTT assay) was lower among diabetic patients compared with the control group (P < 0.01; Fig. 6, A). A strong inverse correlation between the viability of the colonies and HbA1c levels in the diabetic patient was observed (P < 0.005; Fig. 6, B).
Figure 6.
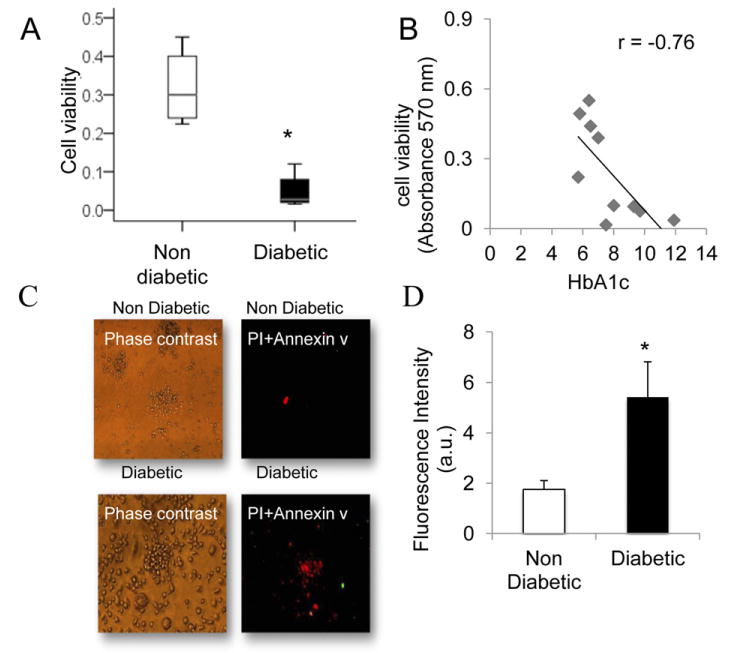
(A) Viability of the endothelial cells (3-[4,5-dimethylthiazol-2-yl]-2,5-diphenyltetrazolium bromide; MTT assay). The viability was lower among diabetic patients compared with the control group (*P < 0.01). MTT in 10 randomly selected patients in each group. (B) Scatter plot of HbA1c and cell viability. The viability of the diabetic patient colonies was inversely correlated with HbA1c levels (P < 0.01; n = 10). (C) Representative images by using Annexin V-FITC and propidium iodide (red) staining in EPC. Most of the diabetic patients' colonies were stained with PI indicating cell death. (D) Quantitative analysis of fluorescence intensity: the analysis was performed in randomly selected colonies using digital image analysis (magnification ×20) (4 independent experiments; *P < 0.01).
We used annexin V and propidium iodide (PI) staining to examine cell death in EPC colonies from diabetic and nondiabetic patients. PI and annexin V staining showed that most of the diabetic patient colonies were stained with PI, a marker of cell death (Fig. 6, C). Quantitative analysis of fluorescence intensity further confirmed the PI staining results (Fig. 6, D).
Discussion
We hereby demonstrate for the first time a negative linear correlation between EPC function and glycemic control (HbA1c). We also demonstrate that diabetic patients exhibit an inadequate HO-1 response to chronic inflammation and oxidative stress, which is accompanied by the inhibition of adiponectin synthesis and release.
Diabetes is a metabolic disorder characterized by chronic oxidative stress, higher serum levels of inflammatory cytokines, and by multisystem pathological complications.18 The increased oxidative stress in our diabetic patients, as seen by the elevated TBARS, appears to trigger a compensatory transcriptional upregulation of the Nrf2 genes, resulting in the downstream upregulation of antioxidant enzymes, with the exception of HO-1. HO-1 is activated and regulates cellular redox homeostasis in conditions of oxidative stress. However, studies in our laboratory19 have demonstrated the inhibition of HO-1 expression or HO-1 activity in conditions of increased oxidative stress. The present study establishes a similar effect of chronic oxidative stress on HO-1 expression, in samples taken from human diabetic patients. Although their HO-1 mRNA levels increased, this rise was not accompanied by a concomitant increase in protein levels. In addition, plasma bilirubin levels were lower, confirming that the HO-1 system is less active in diabetic patients. Although the exact mechanisms through which chronic oxidative stress attenuates HO-1 expression are not yet fully understood, its cellular activities cannot be overlooked. The attenuated HO-1 system will not only lead to deficient levels of biliverdin (BV) and carbon monoxide but will also lead to excess free heme. The accumulation of heme, due to its pro-oxidant and proinflammatory properties, contributes to an increase in free radical formation and cell injury.20 The levels of adiponectin, an adipocyte-specific plasma protein and HO-1 downstream target, was also reduced in the diabetic compared with the nondiabetic patient. Adiponectin further provides cellular defense against oxidative stress and reduces local and systemic inflammation via the activation of phosphorylated adenosine monophosphate-activated protein kinase-, protein kinase B-, and phosphorylated liver kinase B1-dependent signalling pathways.15 This pathophysiological inadequacy in HO-1 and adiponectin levels, strongly correlates with increased oxidative stress, stimulation of system-wide inflammation, and deficient cellular repair response. This chronic imbalance could favour apoptotic pathways and re- tard endothelial repair, as exemplified by the reduction in the number and activity of EPCs in these patients.
Hyperglycemia can increase ROS production in many cell lines, including EPCs.6 The HO-1 system has also been shown to increase circulating bone marrow-derived EPCs, thus promoting vascular repair via re-endothelialization.21 The proportion of cells coexpressing VEGFR-2, CD133, and CD34 was lower in the diabetic group compared with control subjects. Although the glucose level in the medium was normal, the EPC functional assays demonstrated a reduction in the function in diabetic patients. The ability to form colonies and the viability of the colonies in the diabetic patients was inversely correlated with HbA1c levels. There were no statistically significant correlations between the circulating levels of EPCs and the levels of the HbA1c in the diabetic patients. Thus, it seems that glycemic control affects the function and the viability of the EPCs but not the quantity. The mechanism contributing to the reduction of circulating EPCs and their function in diabetes is still unknown; however, it may be due to an increase in oxidative stress. It is noteworthy that the viability of the diabetic EPC colonies was elevated by the induction of HO-1 gene expression which led to increased adiponectin levels in rats.16 Several studies have suggested that hypoadiponectinemia may contribute to the depression of EPC levels that are observed in patients with obesity-related CV disorders. In the present study, lower levels of adiponectin in the adipose tissue of diabetic patients compared with nondiabetic patients were demonstrated. The activation of HO-1 which led to an increase in adiponectin levels in adipose tissue may provide adequate protection against oxidative stress, which will lead to an increase EPC number and viability.
In conclusion, the present study demonstrates that chronic hyperglycemia in ischemic patients with poor glycemic control correlates inversely with EPC function. This negative correlation exists in an oxidative, inflammatory environment where the prime cellular defense (ie, HO-1 and adiponectin) against such events is significantly inadequate. Insufficient activation of the HO-1 adiponectin axis, in visceral adipose tissues, has the potential to further enhance oxidative stress and predispose to tissue hypoxia. These pathophysiological abnormalities contribute toward a systemic redox and inflammatory imbalance, which in turn may precipitate EPC dysfunction. Nonfunctional EPCs retard the vascular repair process and could further contribute toward diabetes-associated vascular complications. Whereas strict glycemic control is desirable to enhance vascular endothelial repair and to avoid diabetic microvascular complications, it is not clinically achievable in every diabetic patient. In light of current evidence of impaired EPC function associated with the inhibition of the HO-1 adiponectin axis, phar-macotherapeutic modalities aimed toward the stimulation of this axis could provide a conducive microenvironment for enhanced EPC function and survival, thus contributing toward the prevention of long-term microvascular complications in patients with diabetes.
Acknowledgments
This work was performed in partial fulfilment of the requirements for a PhD degree of Yossi Issan, Sackler Faculty of medicine, Tel Aviv University, Israel.
Funding Sources: This work was funded by the Hamer Fund at Tel Aviv University Medical School, Tel Aviv, Israel, and the Young Investigator Fund at Rabin Medical Center, Petah Tikva, Israel.
Footnotes
Disclosures: The authors have no conflicts of interest to disclose.
References
- 1.Leiter LA, Fitchett DH, Gilbert RE, et al. Identification and management of cardiometabolic risk in Canada: a position paper by the cardiometabolic risk working group (executive summary) Can J Cardiol. 2011;27:124–31. doi: 10.1016/j.cjca.2011.01.016. [DOI] [PubMed] [Google Scholar]
- 2.Xu J, Zou MH. Molecular insights and therapeutic targets for diabetic endothelial dysfunction. Circulation. 2009;120:1266–86. doi: 10.1161/CIRCULATIONAHA.108.835223. [DOI] [PMC free article] [PubMed] [Google Scholar]
- 3.Urbich C, Dimmeler S. Endothelial progenitor cells: characterization and role in vascular biology. Circ Res. 2004;95:343–53. doi: 10.1161/01.RES.0000137877.89448.78. [DOI] [PubMed] [Google Scholar]
- 4.Fadini GP, Schiavon M, Cantini M, et al. Circulating progenitor cells are reduced in patients with severe lung disease. Stem Cells. 2006;24:1806–13. doi: 10.1634/stemcells.2005-0440. [DOI] [PubMed] [Google Scholar]
- 5.Tepper OM, Galiano RD, Capla JM, et al. Human endothelial progenitor cells from type II diabetics exhibit impaired proliferation, adhesion, and incorporation into vascular structures. Circulation. 2002;106:2781–6. doi: 10.1161/01.cir.0000039526.42991.93. [DOI] [PubMed] [Google Scholar]
- 6.Sorrentino SA, Bahlmann FH, Besler C, et al. Oxidant stress impairs in vivo reendothelialization capacity of endothelial progenitor cells from patients with type 2 diabetes mellitus: restoration by the peroxisome proliferator-activated receptor-gamma agonist rosiglitazone. Circulation. 2007;116:163–73. doi: 10.1161/CIRCULATIONAHA.106.684381. [DOI] [PubMed] [Google Scholar]
- 7.Thorin E. Vascular disease risk in patients with hypertriglyceridemia: endothelial progenitor cells, oxidative stress, accelerated senescence, and impaired vascular repair. Can J Cardiol. 2011;27:538–40. doi: 10.1016/j.cjca.2011.03.014. [DOI] [PubMed] [Google Scholar]
- 8.Chan K, Han XD, Kan YW. An important function of Nrf2 in combating oxidative stress: detoxification of acetaminophen. Proc Natl Acad Sci U S A. 2001;98:4611–6. doi: 10.1073/pnas.081082098. [DOI] [PMC free article] [PubMed] [Google Scholar]
- 9.Xue M, Qian Q, Adaikalakoteswari A, et al. Activation of NF-E2-related factor-2 reverses biochemical dysfunction of endothelial cells induced by hyperglycemia linked to vascular disease. Diabetes. 2008;57:2809–17. doi: 10.2337/db06-1003. [DOI] [PMC free article] [PubMed] [Google Scholar]
- 10.Wang G, Hamid T, Keith RJ, et al. Cardioprotective and antiapoptotic effects of heme oxygenase-1 in the failing heart. Circulation. 2010;121:1912–25. doi: 10.1161/CIRCULATIONAHA.109.905471. [DOI] [PMC free article] [PubMed] [Google Scholar]
- 11.Hill-Kapturczak N, Chang SH, Agarwal A. Heme oxygenase and the kidney. DNA Cell Biol. 2002;21:307–21. doi: 10.1089/104454902753759726. [DOI] [PubMed] [Google Scholar]
- 12.Kruger AL, Peterson S, Turkseven S, et al. D-4F induces heme oxygenase-1 and extracellular superoxide dismutase, decreases endothelial cell sloughing, and improves vascular reactivity in rat model of diabetes. Circulation. 2005;111:3126–34. doi: 10.1161/CIRCULATIONAHA.104.517102. [DOI] [PubMed] [Google Scholar]
- 13.Yet SF, Melo LG, Layne MD, Perrella MA. Heme oxygenase 1 in regulation of inflammation and oxidative damage. Methods Enzymol. 2002;353:163–76. doi: 10.1016/s0076-6879(02)53046-9. [DOI] [PubMed] [Google Scholar]
- 14.Kim DH, Vanella L, Inoue K, et al. Epoxyeicosatrienoic acid agonist regulates human mesenchymal stem cell-derived adipocytes through activation of HO-1-pAKT signaling and a decrease in PPARgamma. Stem Cells Dev. 2010;19:1863–73. doi: 10.1089/scd.2010.0098. [DOI] [PMC free article] [PubMed] [Google Scholar]
- 15.Shibata R, Sato K, Pimentel DR, et al. Adiponectin protects against myocardial ischemia-reperfusion injury through AMPK- and COX-2-dependent mechanisms. Nat Med. 2005;11:1096–103. doi: 10.1038/nm1295. [DOI] [PMC free article] [PubMed] [Google Scholar]
- 16.Sambuceti G, Morbelli S, Vanella L, et al. Diabetes impairs the vascular recruitment of normal stem cells by oxidant damage, reversed by increases in pAMPK, heme oxygenase-1, and adiponectin. Stem Cells. 2009;27:399–407. doi: 10.1634/stemcells.2008-0800. [DOI] [PMC free article] [PubMed] [Google Scholar]
- 17.Lev EI, Leshem-Lev D, Mager A, et al. Circulating endothelial progenitor cell levels and function in patients who experienced late coronary stent thrombosis. Eur Heart J. 2010;31:2625–32. doi: 10.1093/eurheartj/ehq184. [DOI] [PubMed] [Google Scholar]
- 18.Desfaits AC, Serri O, Renier G. Normalization of plasma lipid peroxides, monocyte adhesion, and tumor necrosis factor-alpha production in NIDDM patients after gliclazide treatment. Diabetes Care. 1998;21:487–93. doi: 10.2337/diacare.21.4.487. [DOI] [PubMed] [Google Scholar]
- 19.Kim DH, Burgess AP, Li M, et al. Heme oxygenase-mediated increases in adiponectin decrease fat content and inflammatory cytokines tumor necrosis factor-alpha and interleukin-6 in Zucker rats and reduce adipogenesis in human mesenchymal stem cells. J Pharmacol Exp Ther. 2008;325:833–40. doi: 10.1124/jpet.107.135285. [DOI] [PubMed] [Google Scholar]
- 20.Abraham NG, Tsenovoy PL, McClung J, Drummond GS. Heme oxygenase: a target gene for anti-diabetic and obesity. Curr Pharm Des. 2008;14:412–21. doi: 10.2174/138161208783597371. [DOI] [PubMed] [Google Scholar]
- 21.Wu BJ, Midwinter RG, Cassano C, et al. Heme oxygenase-1 increases endothelial progenitor cells. Arterioscler Thromb Vasc Biol. 2009;29:1537–42. doi: 10.1161/ATVBAHA.109.184713. [DOI] [PubMed] [Google Scholar]