Abstract
Glycomics and glycoproteomics analyses by mass spectrometry require efficient front-end separation methods to enable deep characterization of heterogeneous glycoform populations. Chromatography methods are generally limited in their ability to resolve glycoforms using mobile phases that are compatible with online liquid chromatography–mass spectrometry (LC-MS). The adoption of capillary electrophoresis–mass spectrometry methods (CE-MS) for glycomics and glycoproteomics is limited by the lack of convenient interfaces for coupling the CE devices to mass spectrometers. Here, we describe the application of a microfluidics-based CE-MS system for analysis of released glycans, glycopeptides and monosaccharides. We demonstrate a single CE method for three different modalities, thus contributing to comprehensive glycoproteomics analyses. In addition, we explored compatible sample derivatization methods. We used glycan TMT-labeling to improve electrophoretic migration and enable multiplexed quantitation by tandem MS. We used sialic acid linkage-specific derivatization methods to improve separation and the level of information obtained from a single analytical step. Capillary electrophoresis greatly improved glycoform separation for both released glycans and glycopeptides over that reported for chromatography modes more frequently employed for such analyses. Overall, the CE-MS method described here enables rapid setup and analysis of glycans and glycopeptides using mass spectrometry.
Graphical Abstract
With improvements in mass spectrometer speed, sensitivity, analysis time, and depth, effectiveness of omics characterizations depends largely on front-end separation methods.1 Liquid chromatography (LC) remains the preferred separation mode for online interface with mass spectrometry (MS), due to mature interfaces, solvent compatibility and a variety of available chromatography modes. Glycosylation increases the number of molecular forms of proteins (proteoforms) and thus the complexity of a biological sample. We and others have investigated the utility of online reversed phase LC-MS for analysis of glycopeptides.2–11 One of the principal limitations to this approach is that the glycoforms for a given glycopeptide elute over a narrow retention time window. Thus, the number of precursor ions that can be isolated and analyzed by tandem MS is considerably less than the number of glycopeptide glycoforms present. There is clear need for online separation of glycopeptide glycoforms prior to entering the MS source to maximize the number of tandem mass spectra acquired.
CE offers high peak capacity for glycoform resolution because the separation is based on charge, size, and shape.12–15 In contrast to LC and nano-LC, CE systems have lacked convenient interfaces for mass spectrometers, and this situation has limited their utilization for applications in large-scale glycomics and glycoproteomics studies. Due to recent developments in technology, microfluidic CE systems with integrated nanoelectrospray ionization interfaces are commercially available for easy coupling to mass spectrometers.16–18 The compact scale of these CE devices improves sensitivity and facilitates analysis of small sample quantities.
As stated above, a key factor affecting the implementation of CE-MS to biomolecule analysis has been the development of interfaces for mass spectrometry coupling. One challenge has been the low liquid flow-rates in CE that are insufficient for ESI. Introduction of a coaxial sheath liquid by Smith and coworkers provided for mixing of a sheath liquid with CE effluent to increase overall flow rates, thereby enabling online coupling of CE to a mass spectrometer.19 The sheath flow interface is easy to implement but suffers from low sensitivity due to sample dilution and chemical noise from the sheath liquid. Sheathless-flow interfaces were also developed around the same time20 and modified versions of this interface were later introduced;21,22 however, they suffered from problems in spray-stability and reproducibility. A liquid-junction interface, implemented by many groups, enables partial disconnection of the CE and ESI components. This makes it possible to optimize CE and ESI individually because the flows from the two components are combined at a junction to produce a stable electrospray.23–26
The use of bare fused-silica capillaries compromises separation efficiencies due to interactions with the analyte.27 It also deteriorates migration time reproducibility, which is critical to proteomics analyses. To prevent such interactions, the use of surface coatings is common.28 A number of groups have evaluated a polyamine-based coating, PolyE-323, that adheres to glass through ionic interactions with silanol groups and produces a net positive charge on the coated surfaces under neutral to acidic conditions.17,29 The authors reported efficient separation for tryptic peptides using capillaries with this coating. The coating also provided a stable anodal electro-osmotic flow (EOF), thus, enabling stable ESI on the microfluidic device. Therefore, a variety of neutral or positively charged coatings have been explored to counteract unfavorable surface interactions for proteomics applications.30–32 These coatings include a monoquaternarized piperazine compound, polybrene-poly(vinyl sulfonate) and an N-methylpolyvinylpyridinium cationic polymer.
CE was widely adopted for glycan analysis after its coupling to a laser-induced fluorescence detector (LIF). This method requires derivatization of the glycans with a fluorophore, with aminiopyrene trisulfolane (APTS) being the most commonly used tag.33–35 Optical detection allows identification only of molecules for which standard migration times have been determined. Gennaro and colleagues evaluated aminonapth-thalene trisulfolane (ANTS) as a derivatization reagent for CE-MS of glycans, along with a low molarity (20 mM) 6-aminocaproic acid CE separation buffer.36 APTS and ANTS both impart negative charge to the labeled glycans and make negative ion mode analyses more efficient by improving ionization efficiencies.33,36,37 Gennaro and Salas–Solano demonstrated the use of online CE-LIF-MS for APTS-labeled glycans on a CE system with PVA-coated capillaries and a running buffer of 40 mM aminocaproic acid and 0.02% hydroxypropylmethylcellulose.38
Monosaccharide analysis is performed commonly using gas chromatography–mass spectrometry (GC-MS). This method requires derivatization (generally peralkylation) of monosaccharides to generate hydrophobic derivatives that can be resolved by gas chromatography.39 Partially methylated alditol acetates can be used for linkage analysis by GC-MS.40 Isobaric monosaccharides are differentiated based on the retention time differences measured for purified standards. A method for monosaccharide analysis using CE was developed by Guttman, who has described the separation of APTS-labeled monosaccharides and AMAC-labeled sialic acids coupled with LIF detection.41 This setup used 25 mM lithium tetraborate buffer in the separation channels. This method has been adopted by many laboratories but employs buffers incompatible with mass spectrometry.
Guttman also described sample preparation and separation methods using CE with optical detection for analysis of oligosaccharides.33–35,42,43 These methods are also incompatible with mass spectral analysis due to their running buffers. More recently, a study described the characterization of N- and O-linked glycopeptides from human erythropoietin using CE-MS.44 This study utilized bare fused-silica capillaries with an electrolyte solution containing a mixture of acetic and formic acid, with 50% isopropanol used for sheath flow. Váradi et al. used isotopically coded 2-aminobenzamide for glycan labeling and analysis by CE-MS. This method enabled duplex analysis of glycan samples.45 The aminoxy TMT (tandem mass tag) reagents have been used for efficient labeling and multiplexing of glycans in CE-MS/MS experiments.46,47 This reagent facilitates fast and efficient labeling of glycans with minimal postlabeling cleanup required and enables straightforward tandem-MS based quantification and sample multiplexing.
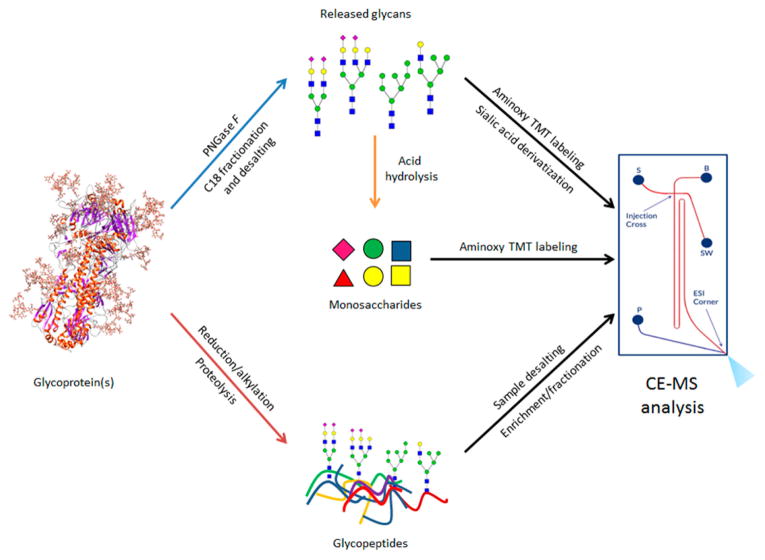
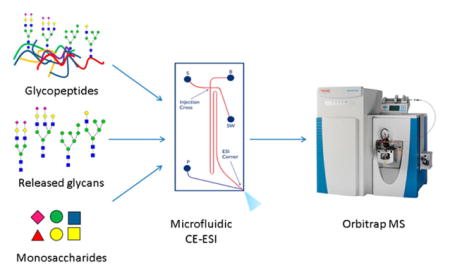
The CE-MS setup used in this work integrates a microfluidic separation system with a nanoESI source on a single piece of hardware17 that works as a removable interface for mass spectrometers. As shown in the schematic in Figure 1, sample injection, background electrolyte, and ESI solution are controlled independently in a manner similar to the liquid-junction interface described above. The microfluidic setup minimizes gaps, dead volume, sample dilution, and band broadening to maintain speed and sensitivity in analyses. The separation capillary surfaces are coated with an aminopropyl silane reagent to minimize EOF, as described previously.48
Figure 1.
Overview of workflow for analysis of monosaccharides, oligosaccharides and glycopeptides using microfluidic CE-ESI-MS. Chip schematic on the right shows sample reservoir “S”, background electrolyte resevoir “B”, ESI pump “P”, and sample waste “SW”.
We developed a CE-MS method for analysis of monosaccharides, oligosaccharides and glycopeptides to enable comprehensive glycoprotein analysis. Our method uses the same electrophoresis solutions for all three compound classes, greatly simplifying the task of glycoprotein characterization. We used the aminoxy TMT regent (Figure S-1) to improve electrophoretic migration of neutral saccharides and to enable multiplexing in tandem-MS experiments. We also used a sialic acid derivatization method to prevent interaction of the negatively charged carboxyl groups with the positively charged capillary surface coating and discriminate sialic acid linkages. In summary, we present a CE-MS method using a convenient mass spectrometry interface for glycan, monosaccharide, and glycopeptide analysis.
MATERIALS AND METHODS
All experiments were performed on a ZipChip capillary electrophoresis-electrospray ionization interface (CE-ESI; 908 Devices, Boston, MA), using a high-resolution chip with capillary length 22 cm, coupled to a Q-Exactive Plus mass spectrometer (Thermo Scientific, San Jose, CA). A CE voltage of 20 kV was applied with a shield potential set at 500 V. ESI voltage varied between 2200 and 2700 V for the different samples and chips. A background electrolyte (BGE) and ESI solution containing 50% methanol, 48% water, and 2% formic acid was used for all experiments. Pressure-assisted CE, a feature of the CE-MS interface, was used for oligosaccharide sample analysis to decrease analysis times. Pressure-driven injection allows transient isotachophoresis for the analyte but dilutes the sample solution in cases where low sample volumes are loaded in the sample well. All MS data were acquired in the positive-ion mode. Released glycans and monosaccharides were derivatized with aminoxy-TMT (the structure and derivatization scheme are shown in Figure S-1) prior to analysis. Sialic acid derivatization was performed using the method described by Reiding and co-workers.49 Details of sample preparation and CE-MS data acquisition have been provided in the Supporting Information.
Data Analysis
Data were analyzed manually with Thermo XCalibur data analysis software and using in-house data analysis tools for generation of extracted ion electropherograms (EIEs), as described in the Supporting Information.
RESULTS AND DISCUSSION
N-Glycan Analysis
Zhong et al. have shown the utility of aminoxy-TMT tags in quantitative analysis of released glycans by CE-MS.46 The TMT tags also improve ionization efficiency and, thus, the sensitivity of sialylated glycans in the positive-ion mode. The aminoxy TMT group imparts a positive charge to labeled neutral glycans in acidic buffers, thereby enabling electrophoretic migration. Further, TMT-based multiplexing has been shown to provide robust quantitative results for paired glycomics samples in both LC-MS and CE-MS.46,47 We therefore used aminoxy-TMT labeling for analyses of released glycans by CE-MS.
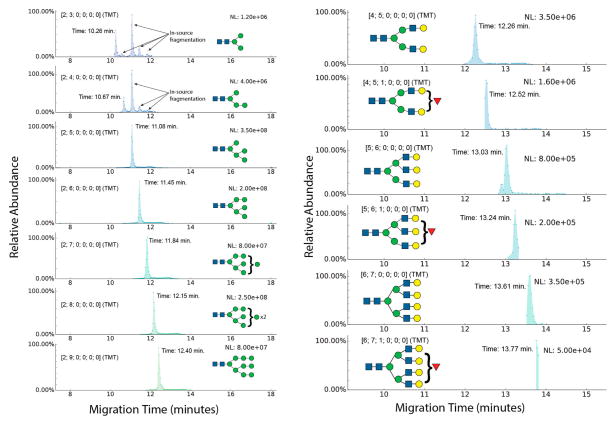
The migration and separation of neutral glycans appeared to depend on the size and number of monosaccharide units, as shown in EIEs in Figure 2 for pauci- and high-mannose N-glycans (left panel) observed from a sample consisting of a mixture of released glycans from human ribonuclease B, human transferrin, and human alpha-1-acid glycoprotein (AGP). The EIEs for asialo complex-type glycans in the mixture are shown in the right panel. Glycan compositions are reported as [HexNAc; Hex; dHex; Total NeuAc; Esterified NeuAc; lactonized NeuAc] in the text and figures. The migration times for each glycan are indicated in the figures. Figures S-5 and S-6 show overlaid EIEs for high mannose and asialo complex-type glycans, respectively. Migration for high-man-nose-type N-glycans shows a clear correlation with increasing size; however, multiple peaks are observed for paucimannose glycans (HexNAc2Hex3–4) [2;3;0;0;0;0] – [2;4;0;0;0;0]. The earliest migrating peaks indicate the existence of these two glycans in solution prior to the CE-MS analysis. In addition, the data show that [2;3;0;0;0;0] and [2;4;0;0;0;0] EIEs contain signal from MS-induced breakdown products of larger high-mannose type glycans. MS-induced breakdown products in the EIEs for larger glycans also exist but are difficult to visualize due to the scale of the Y-axis and the presence of data-dependent tandem MS, which decreases the number of data points per electropherogram. Therefore, EIEs for larger glycans have been plotted from a different experiment where only MS1 was acquired and the Y-axis has been zoomed-in to enable better visualization (shown in Figure S-4).
Figure 2.
Neutral glycans-stacked EIEs showing pauci- and high-mannose N-glycans (left panel) and complex-type asialo N-glycans (right panel) from a mixture of released glycans from bovine RNaseB human transferrin and human AGP. Glycan compositions are represented as [HexNAc; Hex; dHex; total NeuAc; esterified NeuAc; lactonized NeuAc]. For ease of visualization, putative topologies for identified glycan compositions have been shown using the Consortium for Functional Glycomics glycan representation scheme.50
The extracted mass spectra showed protonated analyte ions with varying degrees of ammoniated, sodiated, and potassiated ions forming (see Figure S-8) due to presence of ammonium acetate in the sample loading solution and other salts that may be present in the sample matrix or introduced from sample preparation. The abundances of adducted ions ranged from 5 to 20% abundance relative to protonated ions and generally decreased with the size of the glycan. The EIEs were plotted for protonated ions only. Complex-type asialo glycans showed similar increasing migration times with added monosaccharide units and branching. The right panel in Figure 2 shows EIEs for bi-, tri-, and tetra-antennary complex-type N-glycan compositions, with or without a fucose residue.
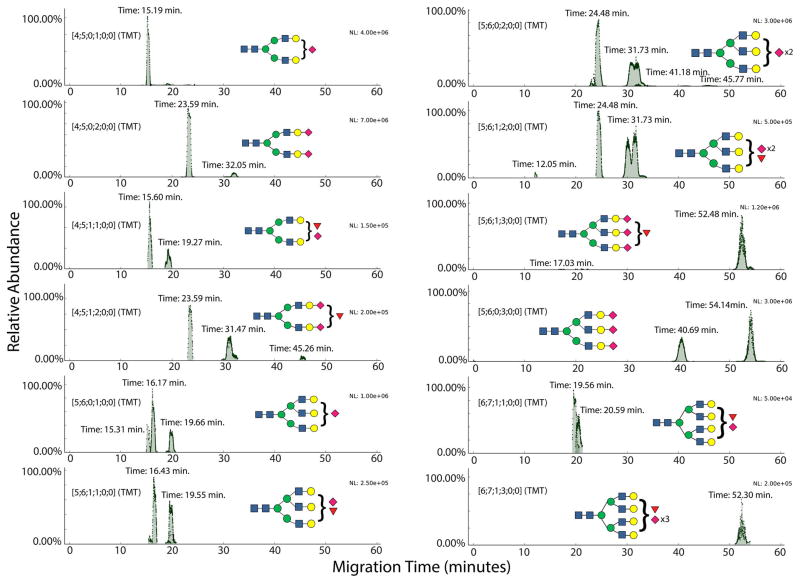
We next analyzed the behavior of N-glycans containing neuraminic acids (NeuAc) in their compositions. Figure 3 shows stacked EIEs for sialylated glycan compositions, with a TMT label on the reducing end. While neutral glycans migrated through the separation capillary within the first 15 min of the CE-MS run, their sialylated counterparts migrated more slowly. The retardation of sialylated glycoforms was proportional to the number of sialic acids present in the glycan compositions. Additionally, we detected split peaks or multiple peaks for multiply sialylated glycoforms. For compositions including [5;6;0;3;0;0], migration time differences between peaks were as high as 14 min. While CE has been shown to resolve isomeric glycans, such large differences in migration times for the same glycan composition were not expected.46 We hypothesized that the increased migration times and elution in multiple peaks was related to a combination of increased glycan net negative charge, increased hydrodynamic radius, and nonspecific interactions of acidic glycans with the positively charged capillary coating. To demonstrate the effect of number of sialic acids on migration times, overlaid extracted ion traces have been presented in Figure S-7; the EIEs have been color-coded to reflect the number of NeuAc in glycan compositions.
Figure 3.
Sialylated glycans: EIEs showing sialylated N-glycans with underivatized sialic acids, from human transferrin and AGP. Glycan compositions are represented as [HexNAc; Hex; dHex; total NeuAc; esterified NeuAc; lactonized NeuAc].
Methyl esterification stabilizes sialic acids for MALDI- and LC-MS analyses.40,41 Recently, Wuhrer and colleagues described a MALDI-MS method for analysis of sialylated glycoforms by sialic acid stabilization that allows facile discrimination of sialic acid linkages by ethyl esterification.49 Using this approach, α-2,6-linked NeuAc residues are esterified and α-2,3-linked NeuAc form cyclic lactones. To eliminate any nonspecific interactions of the sialylated glycoforms, we employed their ethyl esterification strategy to derivatize the NeuAc residues.
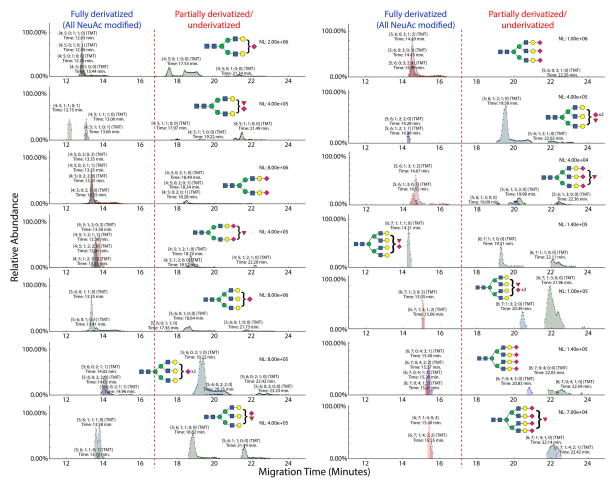
The ethyl-esterification step allowed us to track the migration characteristics of TMT-labeled glycans without the influence of the sialic acid carboxyl groups. We identified N-glycans with completely and partially derivatized sialic acids, as shown in Figure 4. As expected, fully derivatized N-glycans shifted to migration times of 17 min or less, while populations of partially derivatized glycans with one or more sialic acids left underivatized eluted in multiple peaks with longer migration times. Additionally, the mass shifts induced by ethyl esterification versus lactonization allowed characterization of sialic-acid linkages.
Figure 4.
Derivatized sialylated glycans: EIEs showing sialylated N-glycans with derivatized sialic acids, from human transferrin and AGP. Glycan compositions are represented as [HexNAc; Hex; dHex; total NeuAc; esterified NeuAc; lactonized NeuAc].
In most cases, the differently linked sialosides displayed the same electrophoretic mobility. In some cases, migration times of different compositions overlapped. For example, [4;5;1;2;0;2], overlapped with [4;5;1;2;1;1] and [4;5;1;2;2;0]. A relatively wide, bimodal peak was also observed for [5;6;1;1;1;0], indicating isomer separation. Peak shoulders and tailing were also observed for sialylated glycans with unoccupied nonreducing end Gal residues. It thus appears that NeuAc positional isomers exist on these glycans. The presence of abundant underivatized glycans necessitates the improvement of derivatization method to achieve higher efficiency. Several methods for sialic acid derivatization have been published, indicating that this is an ongoing and challenging problem.49,51–64
Glycopeptide Analysis
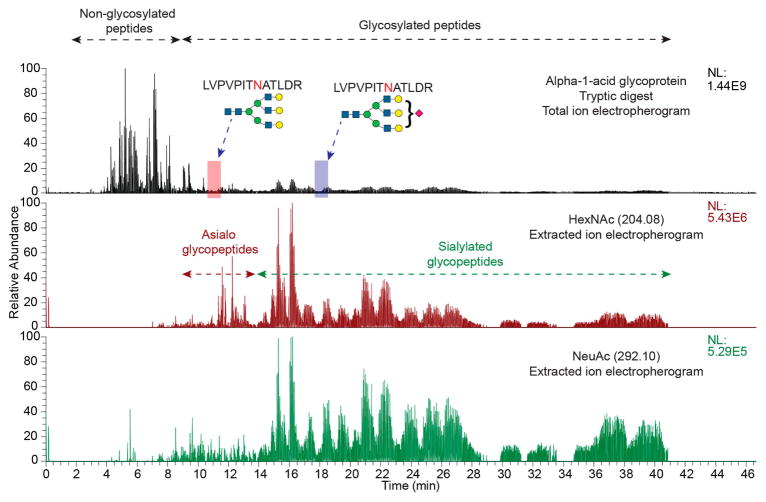
Capillary electrophoresis separates analytes based on both charge and size. The size of glycans on peptide backbones has a significant influence on their electrophoretic mobilities. Thus, glycosylated peptides migrate more slowly through the separation capillary compared to their nonglycosylated counterparts.44 α-1-Acid glycoprotein contains five glycosylation sites with a wide-ranging distribution of complex-type N-glycans.65,66,5,6 In addition, the protein has two isoforms that add variability in protein sequence in the region spanning the glycosylation sites. This allowed us to generate and study the migration characteristics of a variety of peptide backbone sequences with combinations of glycoforms using a tryptic digest of human AGP. Figure 5 shows a total-ion electropherogram (TIE) for an AGP tryptic digest stacked over the EIEs for oxonium ions indicating presence of HexNAc (middle) and NeuAc (bottom) on the precursor ions selected for tandem MS. As indicated by the overlay of oxonium ions, the non-glycosylated peptides in an AGP tryptic digest elute in the first 10 min, while the majority of glycosylated peptides elute after 8 min. All the peaks selected using data-dependent acquisition of tandem mass spectra after 8 min migration time were glycopeptides. The migration positions for two glycoforms of the peptide LVPVPITNATLDR are indicated in the TIE. Figures S-2 and S-3 show HCD tandem mass spectra confirrming the assignments. Note that addition of a single sialic acid resulted in a migration time difference of more than 5 min between the two glycoforms. Overall, most glycosylated peptides with neutral (asialo) glycans appeared prior to 14 min, while the sialylated glycoforms were slower migrating.
Figure 5.
Total ion electropherogram of a tryptic digest of AGP, analyzed by CE-MS, overlaid with extracted ion electropherograms for oxonium ions corresponding to HexNAc (m/z 204.08) and NeuAc (m/z 292.10), showing migration characteristics of glycosylated and non-glycosylated peptides.
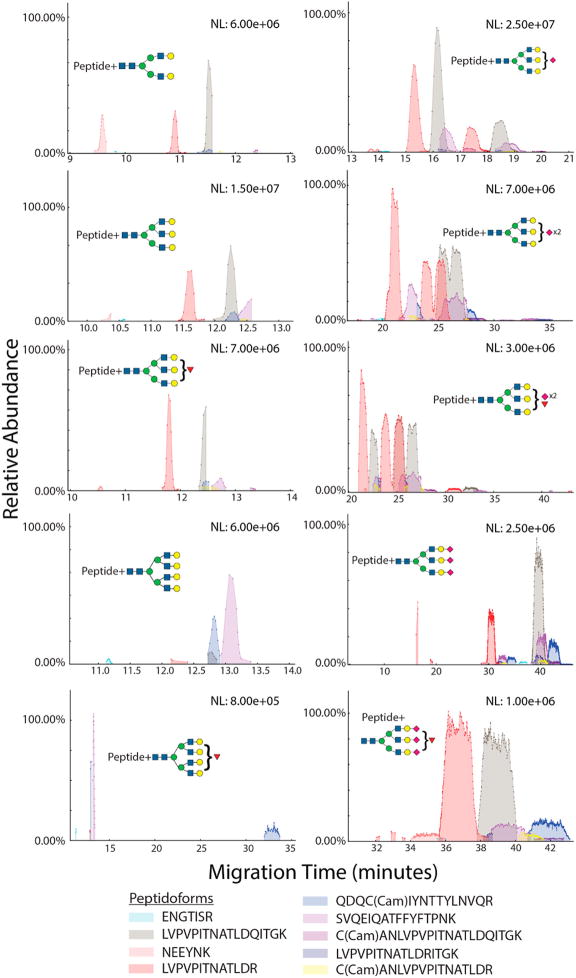
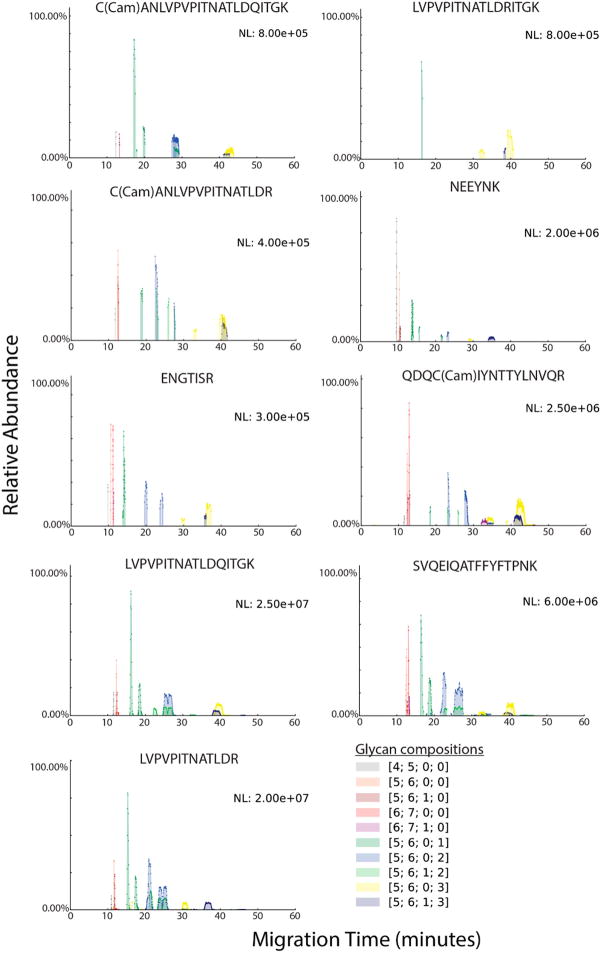
In a manner similar to the released glycans, glycopeptide migration through the separation capillary depended on size. Figure 6 compares the migration profiles of glycopeptides according to peptide backbone by overlaying different peptide backbones with the same glycan composition on the same plot. Figure 7 compares the overlaid migration profiles of glycopeptides with the same peptide backbone but different glycoforms. The individual EIEs for the glycopeptides are shown in Figure S-12, along with the migration time for each glycopeptide. Migrations times increased with both the peptide length and the glycan size. Further, the trend in migration of neutral vs sialylated glycoforms, as seen in released glycans, persisted in glycopeptides. All asialo glycopeptides had migration times of 15 min or less. With an increase in the number of sialic acids, broader and multiple peaks were observed. While these factors increase the density of the data, the overall separation of different glycoforms is useful for deeper characterization of site-specific glycan microheterogeneity. The value of this separation will become more apparent for complex biological samples where multitudes of glycosylated peptides and their numerous glycoforms are present. Although CE separates nonglycosylated peptides from glycosylated peptides, employment of a prior enrichment step such as HILIC would greatly enhance the loading capacity and allow better use of the instrument speed and dynamic range.
Figure 6.
Glycopeptide migration by peptide backbone. Each electropherogram overlays the extracted ion trace for the same glycoform linked to a different peptide backbone. “Cam” stands for cysteine carbamidomethylation. Glycan topologies shown are speculative.
Figure 7.
Glycopeptide migration by glycan composition. Each electropherogram overlays the extracted ion trace for a different glycan composition linked to the same peptide backbone. “Cam” stands for cysteine carbamidomethylation. Glycan compositions are represented as [HexNAc; Hex; dHex; NeuAc].
To eliminate the effects of sialylated glycoforms on migration times, we also explored derivatization schemes similar to those used for released glycans. The Wuhrer group has reported a derivatization method for sialic acid stabilization and linkage discrimination in glycopeptide MALDI-MS, similar to their ethyl esterification procedure which we used for glycan derivatization.57 This reaction converts α-2,6 linked sialic acid to dimethylamide, and α-2,3 linked sialic acid to a cyclic lactone with the adjacent galactose. We explored this derivatization method for CE-MS of sialylated glycopeptides from AGP. Although it did stabilize the sialic acids and decrease migration times (Figure S-9), the reaction introduced multiple modifications along the peptide backbone. This, combined with ammonium adduction from the ammonium acetate present in the stacking buffer, divided the signal from each glycopeptide into many channels, lowering the overall signal-to-noise ratio and making it extremely difficult to identify the glycopeptide compositions (see Figure S-10). This derivatization scheme necessitated the use of an additional HILIC-enrichment or cleanup step prior to CE-MS analysis because the reagents used for the derivatization were not soluble in aqueous solvents, and thus could not be removed via reversed-phase cleanup. To simplify the analysis, data were acquired using transferrin tryptic glycopeptides, which have only two glycosylation sites and a narrow glycoform distribution.5,67 Methyl esterification of the glycopeptides using the method of Powell and Harvey was also attempted.51 A few methyl esterified glycopeptides could be identified by de novo sequencing of the peptide backbone, but the problem of multiple backbone modifications persisted (see Figure S-10).
Monosaccharide Analysis
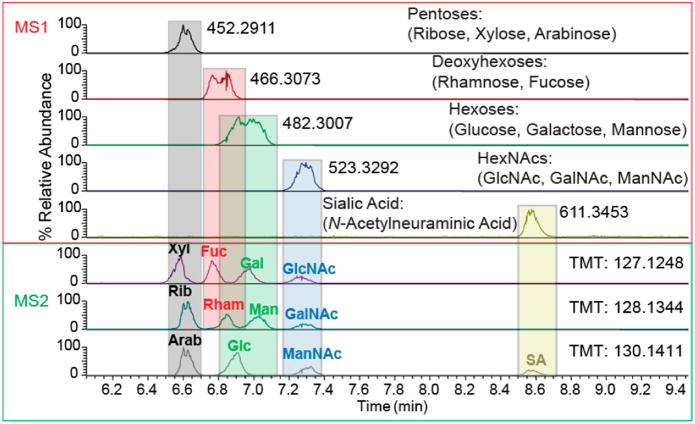
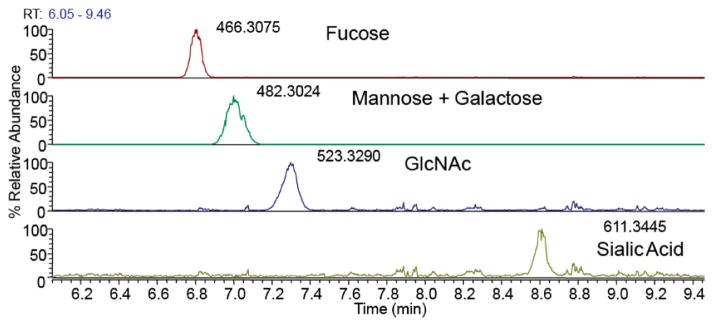
Monosaccharide analysis provides insight into the overall variety of saccharide constituents in a sample. The monosaccharide compositions of unknown samples are identified and quantitated based on the retention/migration times of standards. Following analysis of the standard monosaccharide pools that had been derivatized with aminoxy TMT-127, TMT-128, or TMT-130, for which the results are shown in Figure 8, a mixture of monosaccharides, obtained from AGP by acid hydrolysis and derivatized with TMT-127, were analyzed by CE-MS. The monosaccharide identities were assigned using a table of migration times established for standard monosaccharides, as shown in Figure 9. As expected, AGP monosaccharides included fucose, mannose, galactose, N-acetyl glucosamine, and sialic acid. The peak apex and peak width corresponding to hexoses indicated the presence of mannose and galactose, but no glucose (see Figure S-11).
Figure 8.
Monosaccharide standards multiplexed using three aminoxy TMT reagents to enable identification of isomers on the basis of CE migration and tandem MS.
Figure 9.
Extracted ion electropherograms for monosaccharides derived from AGP.
This workflow for monosaccharide analysis allows easy estimation of the monosaccharide composition of a sample. Even though some the HexNAc monosaccharide isomers are incompletely resolved by CE, using our testing conditions, baseline separation was achievable between the pentoses, deoxyhexoses, hexoses, HexNAcs, and the sialic acid. With the exception of the HexNAcs, separation was broad enough and the retention time is reproducible, such that each monosaccharide can be identified when compared to a standard mix. The use of TMT multiplexing offers the flexibility to develop this method to provide a better monosaccharide identity. For example, internal standards could be included in the analyte, which are labeled with a different TMT-tag to not only provide internal RT calibrants, but enable the possibility of quantification. Similarly, this method could be developed further to compare N-glycan monosaccharide compositions, and O-glycan compositions within the same protein sample, by differential release of O- and N-glycans, labeling with different TMT-tags and analyzing simultaneously to have a quantifiable comparison. The ease of TMT-labeling and high-throughput capability of CE-MS makes monosaccharide analysis accessible to most with basic laboratory equipment.
CONCLUSIONS
The ZipChip CE-ESI device allowed easy interfacing of the CE separation capabilities with mass spectral detection. The integrated sprayer obviated the need for complex ESI source setups on CE-MS systems and delivered stable nanoESI for all experiments. Our methods utilized the same mass spectrometer friendly buffer system for glycopeptides, released glycans and monosaccharides. We showed that the same CE conditions allow analysis of three different analyte classes, thus, eliminating the need for switching among different CE methods and capillary chemistries. The CE device delivered rapid separation and sensitive detection of oligosaccharides, with the sialic acid derivatization procedure allowing identification of sialic acid linkages.
Aminoxy TMT reagent was used to fix a positive charge to improve electrophoretic migration of small, neutral glycans. This reagent has been shown to be useful for relative quantitation and multiplexing of biological samples.46,47 Sialylated glycoforms in oligosaccharides and glycopeptides that retained a negatively charged functional group under the experimental conditions appeared to interact with the coated capillary surface, thereby causing band broadening. We used chemical derivatization to neutralize the acidic monosaccharides and eliminate this interaction for both oligosaccharides and glycopeptides. This derivatization induced linkage-specific mass-shifts for sialylated glycans, which were used for linkage-discrimination in complex mixtures. All sialic acid derivatized oligosaccharides eluted in less than 20 min, considerably reducing analysis times over commonly used LC modes. Glycopeptides in tryptic digests of glycoproteins were well-separated from non-glycosylated peptides, thereby reducing the need for enrichment prior to mass spectrometry analysis. Glycopeptide glycoforms were resolved based on glycan size and composition showing glycoform resolution much higher than observed using liquid chromatography separation.
Monosaccharide standards were derivatized using TMT tags and analyzed using CE-MS to establish migration times, followed by analysis of monosaccharides derived from a standard glycoprotein. Isomeric monosaccharide standards were multiplexed using TMT to generate different reporter ions allowing discrimination between co-migrating isobars. Different types of monosaccharides found on mammalian N-glycans were easily separated.
Glycopeptide separation by CE-MS opens avenues for improved resolution and analysis of these analytes in complex biological samples. While separation of glycopeptides from peptides obviates the need for pre-enrichment, an added enrichment step would increase loading capacity of glycopeptides and enable better tandem MS of low-abundance glycoforms.
The development of newer capillary coatings will increase compatibility with acidic analytes and improvements in hardware and availability of reversed polarity will enable analysis of acidic oligosaccharides and other polyanionic compounds. Because the separation mechanism is orthogonal to commonly used chromatography modes, our CE-MS method is an attractive separation mode to combine with offline chromatographic fractionation.
Supplementary Material
Acknowledgments
The content is solely the responsibility of the authors and does not necessarily represent the official views of the National Institutes of Health (NIH). This work was funded by NIH Grants P41GM104603 and S10OD021651. Thermo-Fisher Corporation provided access to the Q-Exactive Plus mass spectrometer. The authors declare no conflicts of interest with 908devices Inc. We thank 908 Devices Inc. for providing a loan of the ZipChip integrated capillary electrophoresis-electrospray chip. We thank Dr. Erin Redman and Dr. J. Scott Mellors for helpful advice.
Footnotes
Notes
The authors declare no competing financial interest.
The Supporting Information is available free of charge on the ACS Publications website at DOI: 10.1021/acs.anal-chem.7b00875.
Detailed experimental methods; figures showing tandem MS of glycopeptides from CE-MS/MS; EIEs for migrating glycopeptides and monosaccharides; and derivatized sialylated glycopeptides (PDF).
References
- 1.Shishkova E, Hebert AS, Coon JJ. Cell Syst. 2016;3:321–324. doi: 10.1016/j.cels.2016.10.007. [DOI] [PMC free article] [PubMed] [Google Scholar]
- 2.Chandler KB, Pompach P, Goldman R, Edwards N. J Proteome Res. 2013;12:3652–3666. doi: 10.1021/pr400196s. [DOI] [PMC free article] [PubMed] [Google Scholar]
- 3.Dalpathado DS, Desaire H. Analyst. 2008;133:731. doi: 10.1039/b713816d. [DOI] [PubMed] [Google Scholar]
- 4.Hinneburg H, Stavenhagen K, Schweiger-Hufnagel U, Pengelley S, Jabs W, Seeberger PH, Silva DV, Wuhrer M, Kolarich D. J Am Soc Mass Spectrom. 2016;27:1–13. doi: 10.1007/s13361-015-1308-6. [DOI] [PMC free article] [PubMed] [Google Scholar]
- 5.Khatri K, Staples GO, Leymarie N, Leon DR, Turiák L, Huang Y, Yip S, Hu H, Heckendorf CF, Zaia J. J Proteome Res. 2014;13:4347–4355. doi: 10.1021/pr500506z. [DOI] [PMC free article] [PubMed] [Google Scholar]
- 6.Khatri K, Klein JA, Zaia J. Anal Bioanal Chem. 2017;409:607–618. doi: 10.1007/s00216-016-9970-5. [DOI] [PMC free article] [PubMed] [Google Scholar]
- 7.Khatri K, Klein JA, White MR, Grant OC, Leymarie N, Woods RJ, Hartshorn KL, Zaia J. Mol Cell Proteomics. 2016;15:1895–1912. doi: 10.1074/mcp.M116.058016. [DOI] [PMC free article] [PubMed] [Google Scholar]
- 8.Pompach P, Chandler KB, Lan R, Edwards N, Goldman R. J Proteome Res. 2012;11:1728–1740. doi: 10.1021/pr201183w. [DOI] [PMC free article] [PubMed] [Google Scholar]
- 9.Rebecchi KR, Wenke JL, Go EP, Desaire H. J Am Soc Mass Spectrom. 2009;20:1048–1059. doi: 10.1016/j.jasms.2009.01.013. [DOI] [PubMed] [Google Scholar]
- 10.Zacharias LG, Hartmann AK, Song E, Zhao J, Zhu R, Mirzaei P, Mechref Y. J Proteome Res. 2016;15:3624–3634. doi: 10.1021/acs.jproteome.6b00429. [DOI] [PMC free article] [PubMed] [Google Scholar]
- 11.Yu CY, Mayampurath A, Zhu R, Zacharias L, Song E, Wang L, Mechref Y, Tang H. Anal Chem. 2016;88:5725–5732. doi: 10.1021/acs.analchem.5b04858. [DOI] [PMC free article] [PubMed] [Google Scholar]
- 12.Balaguer E, Neusüss C. Anal Chem. 2006;78:5384–5393. doi: 10.1021/ac060376g. [DOI] [PubMed] [Google Scholar]
- 13.Chen FTA, Dobashi TS, Evangelista RA. Glycobiology. 1998;8:1045–1052. doi: 10.1093/glycob/8.11.1045. [DOI] [PubMed] [Google Scholar]
- 14.Kohl FJ, Sánchez-Hernández L, Neusüß C. Electrophoresis. 2015;36:144–158. doi: 10.1002/elps.201400368. [DOI] [PubMed] [Google Scholar]
- 15.Mechref Y, Muzikar J, Novotny MV. Electrophoresis. 2005;26:2034–2046. doi: 10.1002/elps.200410345. [DOI] [PMC free article] [PubMed] [Google Scholar]
- 16.Chambers AG, Mellors JS, Henley WH, Ramsey JM. Anal Chem. 2011;83:842–849. doi: 10.1021/ac102437z. [DOI] [PMC free article] [PubMed] [Google Scholar]
- 17.Mellors JS, Gorbounov V, Ramsey RS, Ramsey JM. Anal Chem. 2008;80:6881–6887. doi: 10.1021/ac800428w. [DOI] [PMC free article] [PubMed] [Google Scholar]
- 18.Redman EA, Batz NG, Mellors JS, Ramsey JM. Anal Chem. 2015;87:2264–2272. doi: 10.1021/ac503964j. [DOI] [PubMed] [Google Scholar]
- 19.Smith RD, Olivares JA, Nguyen NT, Udseth HR. Anal Chem. 1988;60:436–441. [Google Scholar]
- 20.Olivares JA, Nguyen NT, Yonker CR, Smith RD. Anal Chem. 1987;59:1230–1232. [Google Scholar]
- 21.Fang L, Zhang R, Williams ER, Zare RN. Anal Chem. 1994;66:3696–3701. [Google Scholar]
- 22.Mazereeuw M, Hofte Ajp, Tjaden Ur, van der Greef J. Rapid Commun Mass Spectrom. 1997;11:981–986. [Google Scholar]
- 23.Foret F, Zhou H, Gangl E, Karger BL. Electrophoresis. 2000;21:1363–1371. doi: 10.1002/(SICI)1522-2683(20000401)21:7<1363::AID-ELPS1363>3.0.CO;2-U. [DOI] [PubMed] [Google Scholar]
- 24.Settlage RE, Russo PS, Shabanowitz J, Hunt DF. J Microcolumn. 1998 Sep;10:281–285. [Google Scholar]
- 25.Severs JC, Smith RD. Anal Chem. 1997;69:2154–2158. doi: 10.1021/ac9611226. [DOI] [PubMed] [Google Scholar]
- 26.Wachs T, Sheppard RL, Henion J. J Chromatogr, Biomed Appl. 1996;685:335–342. doi: 10.1016/s0378-4347(96)00176-4. [DOI] [PubMed] [Google Scholar]
- 27.Ramautar R, Heemskerk AAM, Hensbergen PJ, Deelder AM, Busnel JM, Mayboroda OA. J Proteomics. 2012;75:3814–3828. doi: 10.1016/j.jprot.2012.04.050. [DOI] [PubMed] [Google Scholar]
- 28.Huhn C, Ramautar R, Wuhrer M, Somsen GW. Anal Bioanal Chem. 2010;396:297–314. doi: 10.1007/s00216-009-3193-y. [DOI] [PubMed] [Google Scholar]
- 29.Ullsten S, Zuberovic A, Wetterhall M, Hardenborg E, Markides KE, Bergquist J. Electrophoresis. 2004;25:2090–2099. doi: 10.1002/elps.200305787. [DOI] [PubMed] [Google Scholar]
- 30.Catai JR, Toraño JS, de Jong GJ, Somsen GW. Electrophoresis. 2006;27:2091–2099. doi: 10.1002/elps.200500915. [DOI] [PubMed] [Google Scholar]
- 31.Elhamili A, Wetterhall M, Arvidsson B, Sebastiano R, Righetti PG, Bergquist J. Electrophoresis. 2008;29:1619–1625. doi: 10.1002/elps.200700737. [DOI] [PubMed] [Google Scholar]
- 32.Sebastiano R, Mendieta ME, Contiello N, Citterio A, Righetti PG. Electrophoresis. 2009;30:2313–2320. doi: 10.1002/elps.200800672. [DOI] [PubMed] [Google Scholar]
- 33.Guttman A, Pritchett T. Electrophoresis. 1995;16:1906–1911. doi: 10.1002/elps.11501601314. [DOI] [PubMed] [Google Scholar]
- 34.Guttman A, Chen FT, Evangelista RA, Cooke N. Anal Biochem. 1996;233:234–242. doi: 10.1006/abio.1996.0034. [DOI] [PubMed] [Google Scholar]
- 35.Suzuki H, Müller O, Guttman A, Karger BL. Anal Chem. 1997;69:4554–4559. doi: 10.1021/ac970090z. [DOI] [PubMed] [Google Scholar]
- 36.Gennaro LA, Delaney J, Vouros P, Harvey DJ, Domon B. Rapid Commun Mass Spectrom. 2002;16:192–200. doi: 10.1002/rcm.564. [DOI] [PubMed] [Google Scholar]
- 37.Sandra K, Devreese B, Van Beeumen J, Stals I, Claeyssens M. J Am Soc Mass Spectrom. 2004;15:413–423. doi: 10.1016/j.jasms.2003.11.003. [DOI] [PubMed] [Google Scholar]
- 38.Gennaro LA, Salas-Solano O. Anal Chem. 2008;80:3838–3845. doi: 10.1021/ac800152h. [DOI] [PubMed] [Google Scholar]
- 39.Morelle W, Michalski JC. Nat Protoc. 2007;2:1585–1602. doi: 10.1038/nprot.2007.227. [DOI] [PubMed] [Google Scholar]
- 40.Hellerqvist CG. Methods Enzymol. 1990;193:554–573. doi: 10.1016/0076-6879(90)93438-q. [DOI] [PubMed] [Google Scholar]
- 41.Guttman A. J Chromatogr A. 1997;763:271–277. doi: 10.1016/s0021-9673(96)00750-9. [DOI] [PubMed] [Google Scholar]
- 42.Olajos M, Hajós P, Bonn GK, Guttman A. Anal Chem. 2008;80:4241–4246. doi: 10.1021/ac8002598. [DOI] [PubMed] [Google Scholar]
- 43.Szabo Z, Guttman A, Rejtar T, Karger BL. Electrophoresis. 2010;31:1389–1395. doi: 10.1002/elps.201000037. [DOI] [PMC free article] [PubMed] [Google Scholar]
- 44.Giménez E, Ramos-Hernan R, Benavente F, Barbosa J, Sanz-Nebot V. Rapid Commun Mass Spectrom. 2011;25:2307–2316. doi: 10.1002/rcm.5114. [DOI] [PubMed] [Google Scholar]
- 45.Váradi C, Mittermayr S, Millán-Martín S, Bones J. Anal Bioanal Chem. 2016;408:8691–8700. doi: 10.1007/s00216-016-9935-8. [DOI] [PubMed] [Google Scholar]
- 46.Zhong X, Chen Z, Snovida S, Liu Y, Rogers JC, Li L. Anal Chem. 2015;87:6527–6534. doi: 10.1021/acs.analchem.5b01835. [DOI] [PMC free article] [PubMed] [Google Scholar]
- 47.Zhou S, Hu Y, Veillon L, Snovida SI, Rogers JC, Saba J, Mechref Y. Anal Chem. 2016;88:7515. doi: 10.1021/acs.analchem.6b00465. [DOI] [PMC free article] [PubMed] [Google Scholar]
- 48.Batz NG, Mellors JS, Alarie JP, Ramsey JM. Anal Chem. 2014;86:3493–3500. doi: 10.1021/ac404106u. [DOI] [PubMed] [Google Scholar]
- 49.Reiding KR, Blank D, Kuijper DM, Deelder AM, Wuhrer M. Anal Chem. 2014;86:5784–5793. doi: 10.1021/ac500335t. [DOI] [PubMed] [Google Scholar]
- 50.Raman R, Venkataraman M, Ramakrishnan S, Lang W, Raguram S, Sasisekharan R. Glycobiology. 2006;16:82R–90R. doi: 10.1093/glycob/cwj080. [DOI] [PubMed] [Google Scholar]
- 51.Powell AK, Harvey DJ. Rapid Commun Mass Spectrom. 1996;10:1027–1032. doi: 10.1002/(SICI)1097-0231(19960715)10:9<1027::AID-RCM634>3.0.CO;2-Y. [DOI] [PubMed] [Google Scholar]
- 52.Miura Y, Shinohara Y, Furukawa J, Nagahori N, Nishimura SI. Chem - Eur J. 2007;13:4797–4804. doi: 10.1002/chem.200601872. [DOI] [PubMed] [Google Scholar]
- 53.Bladergroen MR, Reiding KR, Hipgrave Ederveen AL, Vreeker GCM, Clerc F, Holst S, Bondt A, Wuhrer M, van der Burgt YEM. J Proteome Res. 2015;14:4080–4086. doi: 10.1021/acs.jproteome.5b00538. [DOI] [PubMed] [Google Scholar]
- 54.Che FY, Shao XX, Wang KY, Xia QC. Electrophoresis. 1999;20:2930–2937. doi: 10.1002/(SICI)1522-2683(19991001)20:14<2930::AID-ELPS2930>3.0.CO;2-X. [DOI] [PubMed] [Google Scholar]
- 55.Chen P, Werner-Zwanziger U, Wiesler D, Pagel M, Novotny MV. Anal Chem. 1999;71:4969–4973. doi: 10.1021/ac990674w. [DOI] [PubMed] [Google Scholar]
- 56.Gil GC, Iliff B, Cerny R, Velander WH, Cott KEV. Anal Chem. 2010;82:6613–6620. doi: 10.1021/ac1011377. [DOI] [PMC free article] [PubMed] [Google Scholar]
- 57.de Haan N, Reiding KR, Haberger M, Reusch D, Falck D, Wuhrer M. Anal Chem. 2015;87:8284–8291. doi: 10.1021/acs.analchem.5b02426. [DOI] [PubMed] [Google Scholar]
- 58.de Haan N, Reiding K, Wuhrer M. High-Throughput Glycomics and Glycoproteomics. In: Lauc G, Wuhrer M, editors. Methods in Molecular Biology. Springer; New York: 2017. pp. 49–62. [DOI] [PubMed] [Google Scholar]
- 59.Holst S, Heijs B, de Haan N, van Zeijl RJM, Briaire-de Bruijn IH, van Pelt GW, Mehta AS, Angel PM, Mesker WE, Tollenaar RA, Drake RR, Bovée JVMG, McDonnell LA, Wuhrer M. Anal Chem. 2016;88(88):5904–5913. doi: 10.1021/acs.analchem.6b00819. [DOI] [PubMed] [Google Scholar]
- 60.Liu X, Li X, Chan K, Zou W, Pribil P, Li XF, Sawyer MB, Li J. Anal Chem. 2007;79:3894–3900. doi: 10.1021/ac070091j. [DOI] [PubMed] [Google Scholar]
- 61.Neyra C, Paladino J, Le Borgne M. Carbohydr Res. 2014;386:92–98. doi: 10.1016/j.carres.2014.01.007. [DOI] [PubMed] [Google Scholar]
- 62.Nishikaze T, Tsumoto H, Sekiya S, Iwamoto S, Miura Y, Tanaka K. Anal Chem. 2017;89:2353–2360. doi: 10.1021/acs.analchem.6b04150. [DOI] [PubMed] [Google Scholar]
- 63.Ramya TNC, Weerapana E, Cravatt BF, Paulson JC. Glycobiology. 2013;23:211–221. doi: 10.1093/glycob/cws144. [DOI] [PMC free article] [PubMed] [Google Scholar]
- 64.Sekiya S, Wada Y, Tanaka K. Anal Chem. 2005;77:4962–4968. doi: 10.1021/ac050287o. [DOI] [PubMed] [Google Scholar]
- 65.Treuheit MJ, Costello CE, Halsall HB. Biochem J. 1992;283:105–112. doi: 10.1042/bj2830105. [DOI] [PMC free article] [PubMed] [Google Scholar]
- 66.Schmid K, Nimerg RB, Kimura A, Yamaguchi H, Binette JP. Biochim Biophys Acta, Protein Struct. 1977;492:291–302. doi: 10.1016/0005-2795(77)90080-0. [DOI] [PubMed] [Google Scholar]
- 67.Graham I, Williams J. Biochem J. 1975;145:263–279. doi: 10.1042/bj1450263. [DOI] [PMC free article] [PubMed] [Google Scholar]
Associated Data
This section collects any data citations, data availability statements, or supplementary materials included in this article.


