Abstract
A series of synthetic triterpenoid (TP) analogues of oleanolic acid are powerful inhibitors of cellular inflammatory processes such as the induction by IFN-γ of inducible nitric oxide synthase (iNOS) and of cyclooxygenase 2 in mouse macrophages. Here, we show that these analogues are also extremely potent inducers of the phase 2 response [e.g., elevation of NAD(P)H-quinone oxidoreductase and heme oxygenase 1], which is a major protector of cells against oxidative and electrophile stress. Moreover, like previously identified phase 2 inducers, the TP analogues use the antioxidant response element–Nrf2–Keap1 signaling pathway. Thus, induction of the phase 2 response and suppression of the iNOS induction was abrogated in nrf2–/– and keap1–/– mouse embryonic fibroblasts. The high potency of TP analogues in inducing the phase 2 response and blocking inflammation depends on the presence of activated Michael reaction (enone) functions at critical positions in rings A and C. The most potent TP doubles NAD(P)H–quinone oxidoreductase in murine hepatoma cells at 0.28 nM and has an IC50 for suppression of iNOS induction in primary mouse macrophages of 0.0035 nM. The direct interaction of this TP with thiol groups of the Keap1 sensor for inducers is demonstrated spectroscopically. The antiinflammatory and phase 2 inducer potencies of 18 TP are closely linearly correlated (r2 = 0.91) over 6 orders of magnitude of concentration. Thus, in addition to blocking inflammation and promoting differentiation, these TP exhibit another very important protective property: the induction of the phase 2 response.
Keywords: inflammation, Nrf2 Keap1, oxidative stress, phase 2 enzymes, NAD(P)H-quinone acceptor oxidoreductase
The antiinflammatory potencies of a series of triterpenoid (TP) analogues are very closely correlated with their potencies as inducers of phase 2 gene products that protect cells against electrophiles and oxidants. This unexpected correlation was disclosed as follows. We synthesized many analogues of oleanolic acid with the goal of maximizing antiinflammatory activity, guided by their ability to block the IFN-γ-dependent induction of inducible nitric oxide synthase (iNOS) in mouse macrophages (1–3). These studies showed that the presence of Michael acceptor groups at critical positions was essential not only for antiinflammatory activity, but also for inhibition of proliferation, promotion of differentiation, and induction of apoptosis in various cell lines (4–6). We had recognized previously that these structural features were also of central importance for induction of the phase 2 response (7, 8). Therefore, we undertook a structure–activity comparison of the phase 2 inducer potencies of these TP with their activities in suppressing inflammatory iNOS production.
Phase 2 genes code for a family of proteins that under excessive electrophile or oxidative stress are markedly up-regulated, thus providing a diverse and highly reliable response that detoxifies these stressors and ultimately enables the cell to survive these challenges. The following three components are essential for regulation of phase 2 genes (9–11): (i) antioxidant response elements (AREs), single or multiple copies of upstream regulatory regions on phase 2 genes; (ii) Nrf2, the principal transcription factor that heterodimerizes with small Mafs, binds to the ARE, and recruits the general transcriptional machinery; and (iii) actin-tethered Keap1, a cytosolic repressor that binds to Nrf2, retains it in the cytoplasm, and promotes its proteasomal degradation. Specific cysteine residues of Keap1 are the primary sensors that recognize inducers of phase 2 genes. Modification of these thiols by inducers results in conformational changes that render Keap1 unable to repress Nrf2. Consequently, Nrf2 activates the transcription of phase 2 genes.
Because inflammation is implicated in the etiology and pathogenesis of many human diseases, including cancer, identification of the molecular target(s) whereby TP exert their antiinflammatory and anticarcinogenic activities is critically important. In a search for potential molecular target(s), the TP 2-cyano-3,12-dioxooleana-1,9(11)-dien-28-oic acid (CDDO) was recently found to induce phase 2 genes, including heme oxygenase 1 (HO-1) and enzymes of glutathione synthesis (12). Induction of HO-1, an enzyme with antiinflammatory and antioxidant activities (13), was particularly robust (≈30-fold increases in mRNA). Ten years ago, we found that HO-1 is regulated by several chemically distinct classes of phase 2 enzyme inducers and that these inductions are mediated by the ARE (14). Very recently, we showed that induction of HO-1 by the synthetic TP depends partially on ARE and Nrf2.∥ Because CDDO and many other synthetic TP are Michael acceptors, could Keap1 be the sensor that reacts with TP to trigger the induction of phase 2 genes? We discovered a close correlation between the ability of TP to inhibit inflammation and to induce phase 2 enzymes. Both activities depend on the ARE–Nrf2–Keap1 signaling pathway. We also demonstrate the direct interaction of the most potent TP with purified recombinant Keap1.
Experimental Procedures
Cell Cultures. Cells were grown in 5% CO2 at 37°C in the following media supplemented with 10% FBS: α-MEM (Hepa1c1c7) (16), a mixture of equal volumes of DMEM and Hanks' F-12 medium (ARPE-19, Nrf2 fibroblasts) (17), Iscove's MEM (embryonic fibroblasts) (18), DMEM (RAW264.7), and RPMI medium 1640 (U937).
Assay for Induction of iNOS. RAW264.7 cells (5 × 10⁵ cells per well) and Nrf2+/+ and Nrf2–/– fibroblasts (105 cells per well) were plated in 96-well plates and incubated with TP and 10 ng/ml IFN-γ or with 10 ng/ml IFN-γ and 10 ng/ml TNF-α (R & D Systems) for 24 h. NO was measured as nitrite by the Griess reaction (19). In Fig. 3, assays were performed with primary mouse macrophages.
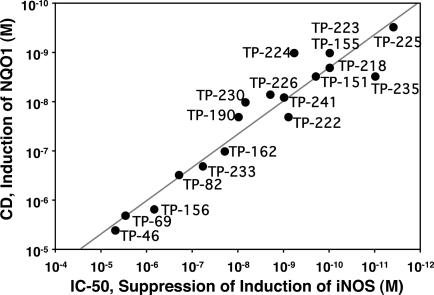
Fig. 3.
Correlation of potencies of 18 TP as inducers of NQO1 in Hepa1c1c7 murine hepatoma cells, expressed as CD values, and for suppression of iNOS induction by IFN-γ in primary mouse macrophages, expressed as IC50 values. The linear correlation coefficient is r2 = 0.91. TP-230 is the butyl ester of CDDO, TP-241 is the piperidyl amide derivative of CDDO, and TP-218 is the ethyl ester of CDDO. Other structures are shown in Fig. 1.
NAD(P)H-Quinone Acceptor Oxidoreductase (NQO1) Activity Assays. Enzyme activity of NQO1 cell lysates was determined in 96-well plates (16, 20). Cells (104 per well) were grown for 24 h and then exposed to serial dilutions of inducers for 48 h. The concentration required to double the specific activity of NQO1 (CD value) was used to quantify inducer potency.
Northern and Western Blots. RAW264.7 cells were incubated with 10 ng/ml IFN-γ and TP (Northern, 100 nM for 16 h; Western, 300 nM for 24 h). Total RNA was isolated with Trizol (Invitrogen) and prepared for blotting (19). Probes for iNOS and cyclooxygenase 2 (COX-2) were radiolabeled with [α-32P]dCTP by using random primers. Membranes were stripped and reprobed with a probe for GAPDH. For the Western blots, total cell lysates were subjected to SDS/PAGE, transferred to a membrane, and probed with iNOS, COX-2, and β-actin antibodies (Santa Cruz Biotechnology).
Binding of [3H]Dexamethasone 21-Mesylate ([3H]Dex-mes) to Keap1 and Competition by TP. DTT was removed from purified fully reduced dimeric Keap1 preparations by sequential gel filtration through two Sephadex G-25 columns (NAP-10, Amersham Pharmacia) equilibrated with 20 mM Tris·HCl/0.1 mM EDTA/0.005% Tween 20 (pH 8.0). Ten microliters of TP (in 50% acetonitrile) at each concentration was added to a 100-μl aliquot (35–40 pmol) of Keap1 and incubated for 20 min at 25°C. Then, 10-μl aliquots of [3H]Dex-mes (25 pmol, ≈500,000 cpm) were added, and incubation was continued for 60 min at 25°C. The reaction mixtures were applied to NAP-10 columns followed by 850 μl of buffer, and the protein was eluted with 900 μl of buffer and counted in 7-ml scintillation vials.
Binding of TP-225 to Keap1. Two microliters of TP-225 (freshly dissolved in acetonitrile) was added to 200 μl of 20 mM Tris·HCl/0.005% Tween 20 (pH 8.0; final concentration of TP, 12.5 μM). The UV spectrum was recorded by using a double-beam spectrophotometer. Then, 2 μl of DTT (final concentration 125 μM) was added, and the spectrum was recorded again. Similar experiments were performed with purified fully reduced Keap1, and the time course of the reaction was followed by the decrease in absorbance at 250 nm. For determination of the reaction stoichiometry, TP-225 was titrated in 2-μl aliquots from a stock solution of 150 μM into 8 μM Keap1 in the same buffer in a final volume of 200 μl.
Detection of Reactive Oxygen Species (ROS). U937 cells were treated with 10 nM TP for 24 h, incubated with 10 μM 2′,7′-dichlorodihydrofluorescein diacetate for 30 min, and then challenged with 250 μM tert-butyl hydroperoxide for 15 min (21). The mean fluorescence intensity of 104 cells was measured by flow cytometry with excitation at 480 nm and emission at 525 nm.
Treatment of ARPE-19 Cells with TP and Irradiation. ARPE-19 cells were plated (50,000 cells per well) in 24-well plates and grown for 24 h. Medium was then replaced with medium containing serial dilutions of TP. After further incubation for 24 h, cells were loaded with 25 μM all-trans-retinaldehyde for 2 h, exposed to UVA (340–400 nm) at an intensity of 310 mJ/cm2 per min for 15 min, and, finally, incubated for an additional 18 h. Cell survival was assessed by the 3-(4,5-dimethylthiazol-2-yl)-2,5-diphenyl tetrazolium bromide assay (17).
Results
Potencies of Synthetic TP in NQO1 and iNOS Suppression Assays: Structure–Activity Correlations. Two bioassays were used to correlate the chemoprotective and antiinflammatory activities of a large series of TP. The first was induction of the phase 2 enzyme NQO1 in the murine hepatoma cell line Hepa1c1c7 (16, 20). This assay accurately predicted the cancer chemoprotective activity of many compounds in animal models (16, 22). The second assay quantifies the ability of a TP to suppress the IFN-γ-dependent transcriptional activation of iNOS, by measuring the effects on either (i) the levels of iNOS mRNA and protein or (ii) the NO produced by iNOS with use of the Griess reaction.
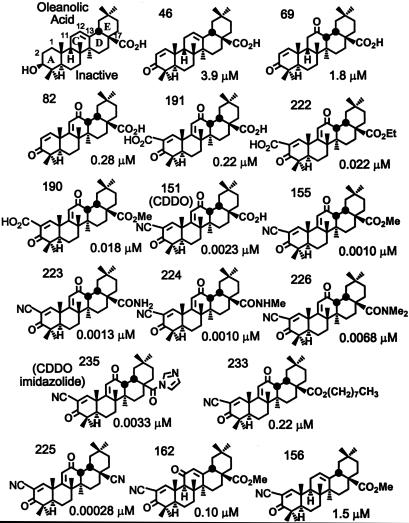
The potencies (CD values) of a large series of synthetic TP to induce NQO1 in Hepa1c1c7 murine hepatoma cells are shown in Fig. 1. The Michael reaction acceptor functionality is essential for inducer activity. Thus, the naturally occurring oleanolic acid that has no electrophile function is inactive; in contrast, introduction of 1-en-3-one functionality on ring A conferred significant inducer activity resulting in potencies in the low micromolar range (TP-46, CD = 3.9 μM; TP-69, CD = 1.8 μM). Inducer potency was further increased (≈10 times) by a second Michael functionality [9(11)-en-12-one] in the C ring (TP-82, CD = 0.28 μM). Although introduction of an electron-withdrawing carboxyl group at C-2 in ring A did not increase the potency (TP-191, CD = 0.22 μM), when the carboxyl group at C-17 was esterified as the methyl or ethyl ester, inducer potency was increased by another order of magnitude (TP-190, CD = 0.018 μM; TP-222, CD = 0.022 μM). Compounds in which an electron-withdrawing nitrile group that increased Michael reactivity was present at C-2 on ring A were especially potent, with CD values in the low nanomolar range [e.g., TP-151 (CDDO), CD = 0.0023 μM; TP-155, CD = 0.001 μM; TP-218 (ethyl ester corresponding to TP-155), CD = 0.0023 μM; TP-223, CD = 0.0013 μM; TP-224, CD = 0.001 μM]. Further modifications at C-17 did not change the inducer potency significantly, except for the very long side chain (nine carbons) of TP-233, which led to a substantial decrease in potency (CD = 0.22 μM). TP-225 (CD = 0.00028 μM) was the most potent compound. In addition to 1-en-3-one, a nitrile group at C-2 on ring A, and a 9(11)-en-12-one functionality on ring C, TP-225 has a nitrile group at C-17.
Fig. 1.
Structures and NQO1 inducer potencies (CD values) of TP.
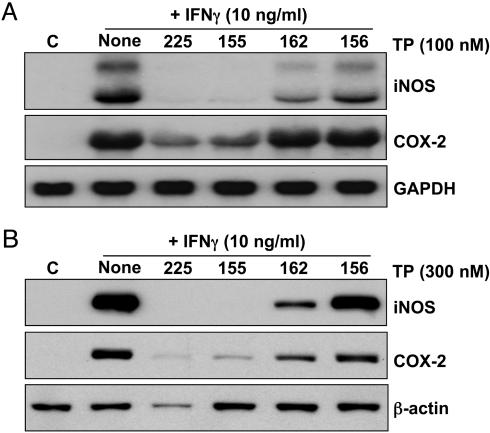
Interestingly, the position of the enone function on ring C is critically important, because the 12-en-11-one (TP-162, CD = 0.1 μM) is 100 times less potent than the 9(11)-en-12-one (TP-155, CD = 0.001 μM) (Fig. 1 and Table 1). A third molecule, TP-156, which has only an isolated 12-olefin functionality on the C-ring, but no ketone at either the 11 or 12 position, is the least potent inducer (CD = 1.5 μM) among the three otherwise identical structures. Importantly, this phenomenon is independent of the cell type, because the order of NQO1 inducer potency was identical in three other cell types, i.e., mouse embryonic fibroblasts (MEF), human retinal pigment epithelial cells (ARPE-19), and a mouse macrophage cell line (RAW264.7) (Table 1). This order of potencies is essentially similar to the inhibition of production of NO by exposure of RAW cells to IFN-γ; i.e., the IC50 values are 0.8, 1, 15, and 155 nM for TP-225, TP-155, TP-162, and TP-156, respectively. The potency orders of these four TP are similar in the suppression of iNOS and COX-2 mRNAs (Fig. 2A) and proteins (Fig. 2B) in RAW cells stimulated with IFN-γ, as well as in the induction of HO-1 protein and enzymatic activity in U937 leukemia cells (data not shown). Moreover, when all 18 TP shown in Fig. 3 were compared for their NQO1 inducer activity in Hepa1c1c7 murine hepatoma cells and for their ability to suppress the IFN-γ-induced production of NO in murine primary peritoneal macrophages, there was a remarkable linear correlation spanning at least 6 orders of magnitude; the least potent compound was TP-46 (CD = 3.9 μM, IC50 = 5.6 μM), and the most potent was TP-225 (CD = 0.28 nM, IC50 = 0.0035 nM). Of note, the IC50 values for iNOS inhibition were determined with primary murine macrophages that are generally 10–100 times more sensitive than established cell lines. In contrast, CD values (NQO1 induction) were determined in the established cell line Hepa1c1c7, which may explain the seemingly narrower range of CD values compared to the IC50 values. These remarkable correlations strongly suggest that common molecular target(s) affect antiinflammatory and phase 2 induction pathways.
Table 1. NQO1 inducer potencies (CD) and NO synthesis inhibitory activity (IC50) of TP.
| Cell type | TP-225 | TP-155 | TP-162 | TP-156 |
|---|---|---|---|---|
| CD, μM | ||||
| Hepa 1c1c7 | 0.00028 | 0.0010 | 0.10 | 1.5 |
| MEF | 0.0020 | 0.0060 | 0.14 | 3.0 |
| ARPE-19 | 0.0016 | 0.0070 | 0.13 | 2.8 |
| RAW264.7 | 0.0030 | 0.0075 | 0.12 | 4.5 |
| IC50, μM | ||||
| RAW264.7 | 0.00080 | 0.001 | 0.015 | 0.155 |
Fig. 2.
SAR of suppression of induction of iNOS and COX-2 mRNA (A) and protein (B) by TP. RAW cells were incubated with 10 ng/ml IFN-γ and various TP (Northern, 100 nM for 16 h; Western, 300 nM for 24 h). Total RNA and protein were isolated, separated electrophoretically, and transferred to membranes, and COX-2 and iNOS expression was analyzed by Northern and Western blotting.
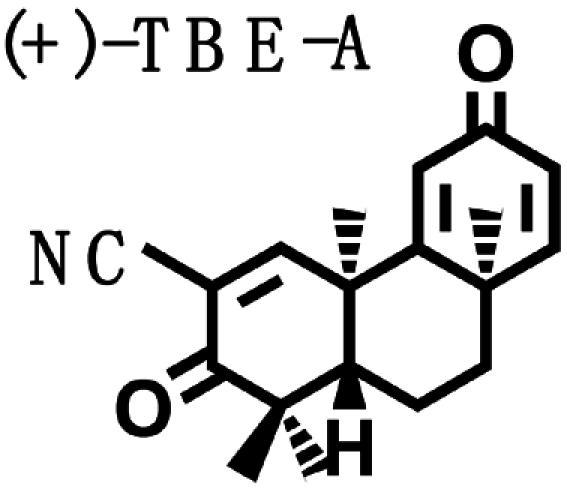
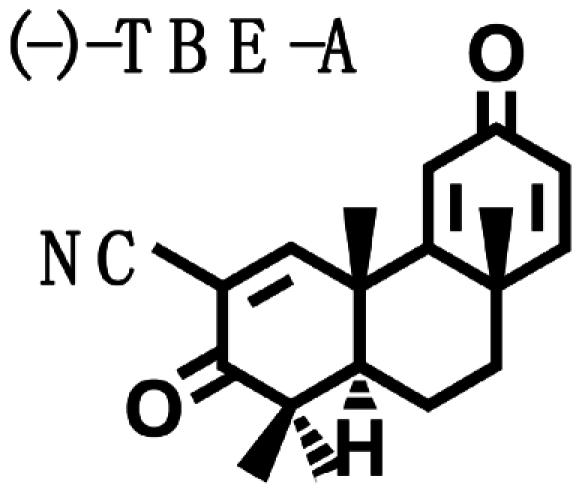
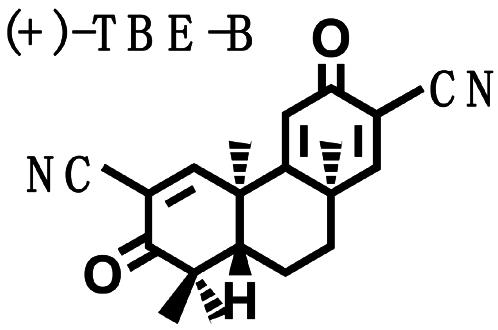
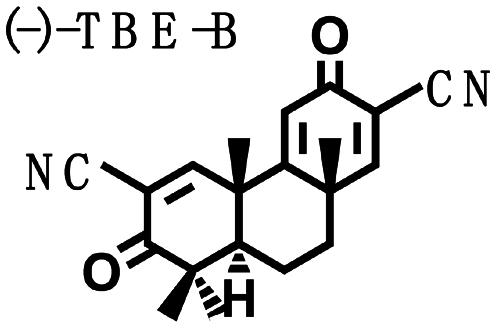
Biological Potencies of Synthetic Tricyclic Analogues of TP in NQO1 and iNOS Assays: Structure–Activity Correlations. On the basis of the findings of the relation of structure to activity (SAR) study, several tricyclic bis-enone (TBE) analogues of TP were synthesized by simpler routes (23, 24). SAR in the two-bioassay systems was similar to those of the TP (Table 2). The TBEs appeared to be ≈1/10th as potent as the related TP. Comparison of (+) and (–)-TBE-A with (–)-TBE-B shows the 10-fold increase in potency obtained by introducing an electron-withdrawing nitrile group on the second Michael function on ring C. Both the (+)- and the (–)-enantiomers of TBE-A and (–)-TBE-B are almost equipotent in inhibiting NO production (24) and in inducing NQO1, with CD values of 0.14, 0.17, and 0.15 μM, respectively. In contrast, the potency of (+)-TBE-B differed by ≈10-fold in both assays, with an IC50 of 0.0036 μM and a CD of 0.019 μM, respectively. Thus, correlation between antiinflammatory and inducer potencies is also consistent in the TBEs. Interestingly, the more potent (+)-enantiomer of TBE-B has the opposite configuration to those of all of the TP shown in Fig. 1.
Table 2. Structure, NQO1 inducer potencies (CD), and NO synthesis inhibitory activity (IC50) of TBE.
|
|
|
|
|
| CD, μM | 0.14 | 0.17 | 0.019 | 0.15 |
| IC50, μM | 0.060 | 0.060 | 0.0036 | 0.0425 |
TP Induce Phase 2 Enzymes Selectively and Independent of Phase 1 Enzymes. Some inducers of phase 2 enzymes (e.g., planar aromatic hydrocarbons) are ligands for the aryl hydrocarbon (Ah) receptor and also induce phase 1 enzymes (cytochrome P450) (25). The inducer potencies of six TP in wild-type (WT) Hepa1c1c7 cells were similar to those in two mutant hepatoma cell lines as follows: (i) Bprc1 that has a defective Ah receptor, and (ii) c1 that does not have a functional CYP4501A1 gene (Table 3). In the same assay, β-naphthoflavone, a potent inducer that requires metabolism by phase 1 enzymes to induce phase 2 enzymes, was only active in the WT Hepa1c1c7 cells. In contrast, sulforaphane, which induces phase 2 enzymes independent of phase 1 enzymes, was active in all three cell lines. The TP therefore induce phase 2 enzymes without metabolism by phase 1 enzymes.
Table 3. Inducer potencies for NQO1 of TP in Hepa1c1c7 cells and their Bprc1 and c1 mutants.
| Cell line | TP-151 | TP-155 | TP-223 | TP-224 | TP-225 | TP-233 | SUL | BNF |
|---|---|---|---|---|---|---|---|---|
| Hepa1c1c7 | 0.0023 | 0.0010 | 0.0013 | 0.0010 | 0.00028 | 0.22 | 0.23 | 0.023 |
| Bprc1 | 0.0052 | 0.0022 | 0.0022 | 0.0028 | 0.00054 | 0.30 | 0.16 | Inactive |
| c1 | 0.0080 | 0.0015 | 0.0015 | 0.0024 | 0.00042 | 0.13 | 0.15 | Inactive |
Shown are CD values (μM). SUL, sulforaphane; BNF, β-naphthoflavone.
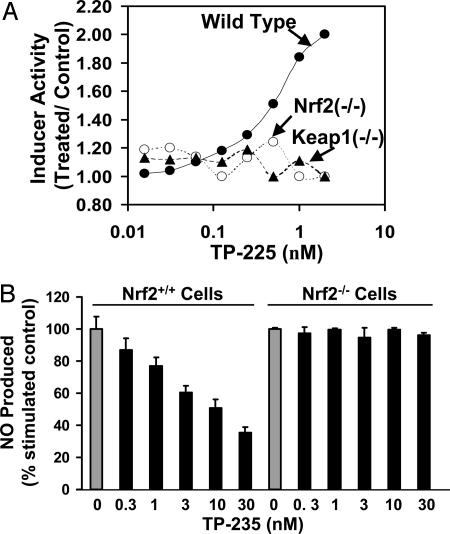
Transcription Factor Nrf2 Is Essential for Phase 2 Enzyme Induction by TP. Four TP, TP-225, -155, -162, and -156, which differ markedly in potencies for NQO1 induction and NO synthesis inhibition, were tested for NQO1 induction in MEF from WT, Nrf2-knockout (Nrf2–/–), and Keap1-knockout (Keap1–/–) mice. Although the MEF cells were less sensitive to these inducers (CD values of 0.002, 0.006, 0.14, and 3.0 μM, respectively), the rank order of potencies was exactly the same as in the hepatoma cells. Most importantly (see TP-225 in Fig. 4A), whereas all of the TP were inducers in the WT cells, they were inactive in both mutant cell lines, demonstrating the absolute requirement for Nrf2 and Keap1. Moreover, when we stimulated MEF with both IFN-γ and TNF-α, TP-235 reduced NO production in Nrf2 WT cells in a dose-dependent manner, but NO levels did not change in Nrf2–/– fibroblasts (Fig. 4B). In this assay, TP-225, -155, -156, and -162 inhibited NO production in Nrf2 WT cells, with the order of potencies matching the SAR shown in Table 1, but had no effect on Nrf2–/– cells (data not shown).
Fig. 4.
Nrf2 and Keap1 are essential for induction of phase 2 response and for suppression of iNOS induction. (A) Induction of NQO1 as a function of concentration by TP-225 in MEF cells of WT (•), Nrf2–/– (○), and Keap1–/– (▴) mice. Cells (104 per well) were plated in 96-well plates and 24 h later were exposed to serial dilutions of TP-225 for a further 48 h. NQO1 activity was determined in cell lysates. (B) CDDO imidazolide (TP-235) suppresses production of NO in WT Nrf2, but not in knockout, fibroblasts. Nrf2+/+ and Nrf2–/– fibroblasts (105 cells per well) were plated in 96-well plates and incubated with 10 ng/ml IFN-γ, 10 ng/ml TNF-α, and TP-235 for 24 h. NO was measured as nitrite accumulation in the medium by the Griess reaction.
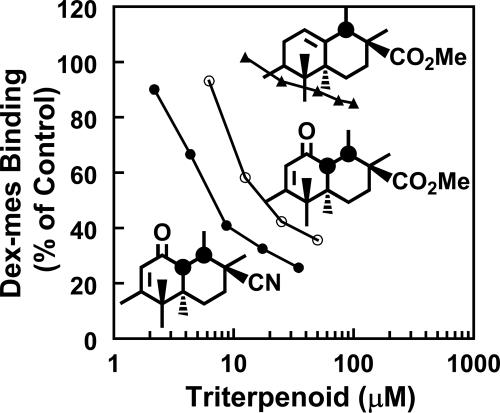
Competition of TP with [3H]Dex-mes for Binding to Keap1. Reaction of highly reactive cysteine residues of Keap1 with inducers leads to the inability of Keap1 to repress Nrf2, resulting in phase 2 enzyme induction (18, 26). We wanted to address whether Keap1 is also the molecular sensor for TP. We examined the following three TP that differ in their phase 2 inducer potencies by >5,000-fold, yet are structurally very similar, for competition with [3H]Dex-mes for binding to Keap1: the 12-ene, TP-156 (CD = 1.5 μM); the 9(11)-en-12-one, TP-155 (CD = 0.001 μM); and TP-225 (CD = 0.00028 μM) (Fig. 5). The order of potencies of TP as competitors in this assay paralleled their potencies for induction of NQO1 and inhibition of IFN-γ-induced NO synthesis (Table 1). The median effect concentrations (27) were as follows: 9.9 μM (TP-225), 25 μM (TP-155), and 1,300 μM (TP-156). This result strongly suggests that Keap1 is also the molecular sensor for TP.
Fig. 5.
Inhibition of binding of [3H]Dex-mes to Keap1 by TP-225 (•), TP-155 (○), and TP-156 (▴). Keap1 (100 μl, 35–40 pmol) was incubated with 10 μlof each competitor in a range of concentrations for 20 min at 25°C in 20 mM Tris·HCl/0.005% Tween 20/0.1 mM EDTA (pH 8.0). Then, 10 μl of [3H]Dex-mes (25 pmol) was added, and incubation was continued for an additional 60 min. [3H]Dex-mes bound to protein was separated from unbound steroid by gel filtration, and the radioactivity in the protein fraction was determined by scintillation counting. Only partial structures (rings C and D) are shown.
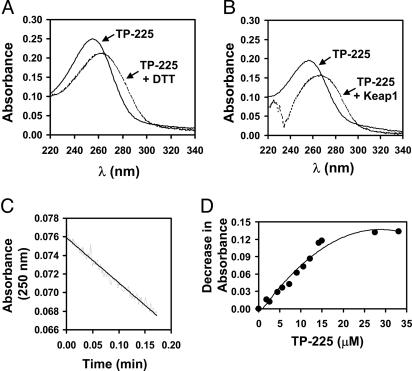
TP-225 Reacts with Cysteine Residues of Keap1. Preliminary experiments had shown that TP-151 (CDDO), a potent inducer of NQO1 and inhibitor of iNOS, interacts with the sulfhydryl groups of cysteine and DTT, leading to a red shift in the UV spectrum of the TP (28). In contrast, TP-82, which is 100 times less potent as an inducer of NQO1 and an inhibitor of iNOS, did not display any spectral shift upon reaction with 100-fold excess of DTT. Spectroscopic examination of the reaction of the potent TP-225 with a 10-fold excess of DTT in Tris·HCl buffer (pH 8.0) resulted in a red shift from 256 to 266 nm (Fig. 6A). A similar spectral shift was observed when TP-225 was allowed to react with recombinant murine Keap1 (Fig. 6B). Because the protein has an absorption minimum at 250 nm, the decrease in absorbance at this wavelength was used to monitor the initial linear reaction rate (Fig. 6C). Small aliquots of TP-225 were added successively to a solution of Keap1, and the decrease in absorbance at 250 nm was used to determine the stoichiometry. With each aliquot of TP-225 added, there was a proportional decrease in absorbance at 250 nm until the concentration of the TP exceeded by a factor of 2 the concentration of the protein, establishing a 2:1 (TP-225:Keap1) stoichiometry of binding (Fig. 6D).
Fig. 6.
Reaction of TP-225 with sulfhydryl groups in 20 mM Tris·HCl/0.005% Tween 20/1% acetonitrile (vol/vol) (pH 8.0) at 25°C. (A) UV spectrum of 12.5 μM TP-225 before (solid line) or immediately after (dotted line) it was allowed to react with 125 μM DTT. (B) UV spectrum of 10 μM TP-225 before (solid line) or immediately after (dotted line) it was allowed to react with 8.75 μM Keap1. The protein was present at the same concentration in the reference cuvette. (C) Time course of the reaction of 3.5 μM TP-225 with 0.5 μM Keap1 measured by the decrease in absorbance at 250 nm. (D) Titration of TP-225 (from a 150 μM stock solution) in 2-μl aliquots into a solution of 8 μM Keap1 in a final volume of 200 μl.
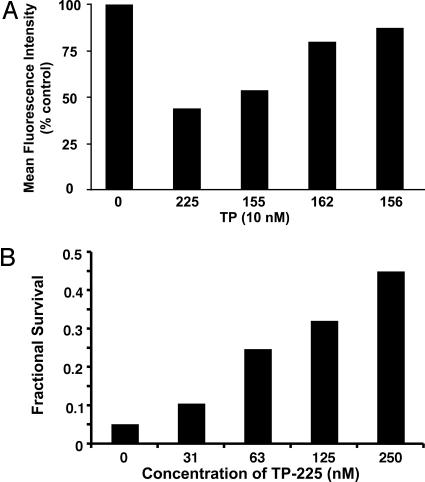
TP Protect Cells Against Oxidative Stress. We have shown that TP-235 decreases the formation of ROS in U937 leukemia cells and WT Nrf2 fibroblasts challenged with tert-butyl hydroperoxide, but this reduction in oxidative stress requires Nrf2, because no protection was observed in Nrf2 knockout cells (our unpublished observations). Additional experiments now confirm that SAR considerations similar to those described above for antiinflammatory activity and NQO1 induction also hold for reduction in oxidative stress as assessed by formation of fluorescent products from dichlorodihydrofluorescein diacetate (21). Thus, prior incubation of U937 cells with 10 nM of TP-225, -155, -162, and -156 for 24 h also reduced the formation of ROS in U937 cells treated with tert-butyl hydroperoxide by 56%, 46%, 20%, and 12%, respectively (Fig. 7A).
Fig. 7.
TP protect cells against oxidative stress. (A) SAR of suppression of ROS formation by various TP. U937 cells were exposed to 10 nM TP for 24 h, incubated with 10 μM2′,7′-dichlorodihydrofluorescein diacetate for 30 min, and then challenged with 250 μM tert-butyl hydroperoxide for 15 min. Mean fluorescence intensity of 104 cells was determined by flow cytometry. (B) TP-225 protects against photooxidative damage. Human retinal pigment epithelial cells (ARPE-19) were incubated with TP-225 for 24 h. They then were loaded with 25 μM all-trans-retinaldehyde for 2 h, exposed to UVA (340–400 nm) for 15 min, and finally incubated for an additional 18 h. Cell survival was determined by the 3-(4,5-dimethylthiazol-2-yl)-2,5-diphenyl tetrazolium bromide assay.
Human adult retinal pigment epithelial cells (ARPE-19) exposed to UVA radiation (320–400 nm) in the presence of all-trans-retinaldehyde in air undergo photooxidative cytotoxicity and were protected by prior treatment with phase 2 gene inducers, such as sulforaphane (17). We therefore examined the ability of the most potent TP, TP-225, to protect ARPE-19 cells against photooxidative cytotoxicity. Fig. 7B shows that prior treatment of ARPE-19 cells with nanomolar concentrations of TP-225 (16–250 nM) for 24 h resulted in substantial concentration-dependent protection. Whereas exposure to 25 μM all-trans-retinaldehyde and UVA light resulted in >95% cell killing, 45% of the cells treated with 250 nM TP-225 survived photooxidation, i.e., cell survival increased by ≈10-fold. Moreover, SAR for selected TP established that protection correlated with inducer potency in the NQO1 assay and with inhibition of IFN-γ-dependent NO synthesis. The concentrations of four TP to achieve 1.5-fold protection were 25 nM TP-225, 70 nM TP-155, 250 nM TP-162, and 1,000 nM TP-156.
Discussion
An extremely close and quantitative structure–activity correlation between the potencies of synthetic TP in elevating a prototype phase 2 enzyme, NQO1, and in suppressing proinflammatory iNOS (Fig. 3) suggests that these processes are linked functionally. This potency correlation extends over 6 orders of magnitude of concentration in a number of cell lines. Design of structural modifications of these TP was intended to optimize potency in suppressing inflammatory responses (1–3). The most successful modifications involved introduction of an activated Michael acceptor (enone) group in ring A and a second Michael acceptor group at a critical distance from the first in ring C. These structural modifications were precisely the same as found earlier to be important for high potency of phase 2 gene induction (7, 8). Consequently, the observation that certain phase 2 genes such as HO-1 were efficiently induced by these TP led us to compare the potencies directly. We predicted, correctly, that if the biological properties of the TP analogues were correlated, these compounds should activate the ARE–Nrf2–Keap1 signaling pathway that is critical for induction of phase 2 gene transcription, and that deletion of the nrf2 gene should abrogate the induction. Moreover, the more easily synthesized tricyclic analogues likewise showed a close correlation between phase 2 gene induction and suppression of iNOS synthesis.
A fundamental aspect of the mechanism of the phase 2 response is the chemical reaction of inducers with critical and highly reactive thiol groups of Keap1, which is the primary sensor for inducers (18, 26). The interaction of the most potent TP with purified recombinant Keap1 has been demonstrated spectroscopically, providing additional evidence that the ARE–Nrf2–Keap1 pathway is their primary target.
The central mechanistic questions are, therefore, as follows: How are the two signaling pathways for inhibition of inflammation and induction of phase 2 genes coupled, and what are the consequences of these responses for cells? Extensive studies have clearly demonstrated that the pleiotropic effects of phase 2 genes are to protect cells and that induction of these genes reduces susceptibility to carcinogens, ROS, and other forms of chemical and physical toxicity.
NF-κB is a DNA-binding transcription factor that plays an essential role in activating proinflammatory genes and in generating many molecules involved in acute inflammation, including iNOS and COX-2. Under basal conditions, NF-κB is inactive and prevented from DNA binding and nuclear translocation by tight association in the cytoplasm with inhibitory proteins, IκBs. Various mechanisms, including phosphorylation, are known to activate NF-κB for nuclear translocation and DNA binding through abrogation of the binding of IκBs (29). IFN-γ, lipopolysaccharide, and TNF-α are all known to generate ROS, which themselves also participate in inflammatory processes. If, as is widely believed, ROS generation is one component of activation of NF-κB, it is logical that induction of phase 2 enzymes will increase the cellular capacity to dispose of ROS, thereby damping the inflammatory response.
An important clue may be the report (30) that the potent phase 2 inducer sulforaphane selectively reduced the DNA binding of NF-κB without affecting its nuclear translocation or the lipopolysaccharide-dependent degradation of IκB. Further insight into the possible mechanism of this phenomenon is provided by examination of the antiinflammatory sesquiterpene lactones of the helenanolide-type. They have α,β-unsaturated carbonyl moieties and inhibit DNA binding of NF-κB most likely by alkylating p65 at Cys-38 that participates directly in DNA binding by forming a hydrogen bond with the phosphate-sugar backbone of the κB-DNA motif (31).
The therapeutic and protective possibilities of attenuating inflammatory pathology through phase 2 gene activation by inducers contained in edible plants (e.g., sulforaphane in crucifers) or synthetic agents (e.g., TP) are an attractive goal (32). Our observations that powerful nrf2-dependent phase 2 inducers suppress inflammatory responses are in agreement with the findings of Itoh et al. (15) of a similar role of 15-deoxy-Δ12,14-prostaglandin J2 as both an inducer of the phase 2 response and inhibitor of inflammation in vivo. Therefore, an important implication of our findings is that antiinflammatory agents should be examined for phase 2 inducer activity, and phase 2 inducers should be examined for antiinflammatory activity.
Acknowledgments
We thank Pamela Talalay for editorial help and Jefferson Y. Chan (University of California, Irvine) for Nrf2 knockout fibroblasts. This work was supported by the Lewis B. and Dorothy Cullman Foundation, the National Foundation for Cancer Research, the American Institute for Cancer Research, Reata Discovery, Inc., members of the Dartmouth College Class of 1934, and National Cancer Institute Grants CA 78814 and CA 94076.
Author contributions: A.T.D.-K., K.T.L., M.B.S., and P.T. designed research; A.T.D.-K., K.T.L., K.K.S., W.D.H., X.G., N.S., C.W., and R.R. performed research; T.H. and G.W.G. contributed new reagents/analytic tools; A.T.D.-K., K.T.L., K.K.S., and M.B.S. analyzed data; and A.T.D.-K., K.T.L., M.B.S., and P.T. wrote the paper.
Abbreviations: ARE, antioxidant response element; CDDO, 2-cyano-3,12-dioxooleana-1,9(11)-dien-28-oic acid; COX-2, cyclooxygenase 2; [3H]Dex-mes, [3H]dexamethasone 21-mesylate; HO-1, heme oxygenase 1; iNOS, inducible NO synthase; MEF, mouse embryonic fibroblasts; NQO1, NAD(P)H-quinone acceptor oxidoreductase; CD, concentration of compound required to double the specific activity of NQO1; ROS, reactive oxygen species; SAR, relation of structure to activity; TBE, tricyclic bis-enone; TP, triterpenoid; IC50, concentration of compound required for 50% reduction of the production of NO in macrophages stimulated with IFN-γ.
Footnotes
Liby, K., Place, A. E., Suh, N., Risingsong, R., Williams, C., Hill-Kapturczak, N., Agarwal, A., Honda, T., Gribble, G. & Sporn, M. B. (2004) Proc. Am. Assoc. Cancer Res. 45, abstr. 1387 (abstr.).
References
- 1.Honda, T., Gribble, G. W., Suh, N., Finlay, H. J., Rounds, B. V., Bore, L., Favaloro, F. G., Jr., Wang, Y. & Sporn, M. B. (2000) J. Med. Chem. 43, 1866–1877. [DOI] [PubMed] [Google Scholar]
- 2.Honda, T., Rounds, B. V., Bore, L., Finlay, H. J., Favaloro, F. G., Jr., Suh, N., Wang, Y., Sporn, M. B. & Gribble, G. W. (2000) J. Med. Chem. 43, 4233–4246. [DOI] [PubMed] [Google Scholar]
- 3.Honda, T., Honda, Y., Favaloro, F. G., Jr., Gribble, G. W., Suh, N., Place, A. E., Rendi, M. H. & Sporn, M. B. (2002) Bioorg. Med. Chem. Lett. 12, 1027–1030. [DOI] [PubMed] [Google Scholar]
- 4.Ito, Y., Pandey, P., Sporn, M. B., Datta, R., Kharbanda, S. & Kufe, D. (2001) Mol. Pharmacol. 59, 1094–1099. [DOI] [PubMed] [Google Scholar]
- 5.Konopleva, M., Tsao, T., Ruvolo, P., Stiouf, I., Estrov, Z., Leysath, C., Zhao, S., Harris, D., Chang, S., Jackson, E., et al. (2002) Blood 99, 326–333. [DOI] [PubMed] [Google Scholar]
- 6.Pedersen, I. M., Kitada, S., Schimmer, A., Kim, Y., Zapata, J. M., Charboneau, L., Rassenti, L., Andreeff, M., Bennet, F., Sporn, M. B., et al. (2002) Blood 100, 2965–2972. [DOI] [PubMed] [Google Scholar]
- 7.Talalay P., De Long, M. J. & Prochaska, H. J. (1988) Proc. Natl. Acad. Sci. USA 85, 8261–8265. [DOI] [PMC free article] [PubMed] [Google Scholar]
- 8.Dinkova-Kostova, A. T., Massiah, M. A., Bozak, R. E., Hicks, R. J. & Talalay, P. (2001) Proc. Natl. Acad. Sci. USA 98, 3404–3409. [DOI] [PMC free article] [PubMed] [Google Scholar]
- 9.Hayes, J. D. & McMahon, M. (2001) Cancer Lett. 174, 103–113. [DOI] [PubMed] [Google Scholar]
- 10.Holtzclaw, W. D., Dinkova-Kostova, A. T. & Talalay, P. (2004) Adv. Enzyme Regul. 44, 335–367. [DOI] [PubMed] [Google Scholar]
- 11.Motohashi, H. & Yamamoto, M. (2004) Trends Mol. Med. 10, 549–557. [DOI] [PubMed] [Google Scholar]
- 12.Lapillonne, H., Konopleva, M., Tsao, T., Gold, D., McQueen, T., Sutherland, R. L., Madden, T. & Andreeff, M. (2003) Cancer Res. 63, 5926–5939. [PubMed] [Google Scholar]
- 13.Morse, D. & Choi, A. M. (2002) Am. J. Respir. Cell Mol. Biol. 27, 8–16. [DOI] [PubMed] [Google Scholar]
- 14.Prestera, T., Talalay, P., Alam, J., Ahn, Y. I., Lee, P. J. & Choi, A. M. (1995) Mol. Med. 1, 827–837. [PMC free article] [PubMed] [Google Scholar]
- 15.Itoh, K., Mochizuki, M., Ishii, Y., Ishii, T., Shibata, T., Kawamoto, Y., Kelly, V., Sekizawa, K., Uchida, K. & Yamamoto, M.(2004) Mol. Cell. Biol. 24, 36–45. [DOI] [PMC free article] [PubMed] [Google Scholar]
- 16.Fahey, J. W., Dinkova-Kostova, A. T., Stephenson, K. K. & Talalay, P. (2004) Methods Enzymol. 382, 243–258. [DOI] [PubMed] [Google Scholar]
- 17.Gao, X. & Talalay, P. (2004) Proc. Natl. Acad. Sci. USA 101, 10446–10451. [DOI] [PMC free article] [PubMed] [Google Scholar]
- 18.Wakabayashi, N., Dinkova-Kostova, A. T., Holtzclaw, W. D., Kang, M. I., Kobayashi, A., Yamamoto, M., Kensler, T. W. & Talalay, P. (2004) Proc. Natl. Acad. Sci. USA 101, 2040–2045. [DOI] [PMC free article] [PubMed] [Google Scholar]
- 19.Suh, N., Honda, T., Finlay, H. J., Barchowsky, A., Williams, C., Benoit, N. E., Xie, Q. W., Nathan, C., Gribble, G. W. & Sporn, M. B. (1998) Cancer Res. 58, 717–723. [PubMed] [Google Scholar]
- 20.Prochaska, H. J. & Santamaria, A. B. (1988) Anal. Biochem. 169, 328–336. [DOI] [PubMed] [Google Scholar]
- 21.LeBel, C. P., Ischiropoulos, H. & Bondy, S. C. (1992) Chem. Res. Toxicol. 5, 227–231. [DOI] [PubMed] [Google Scholar]
- 22.Kang, Y. H. & Pezzuto, J. M. (2004) Methods Enzymol. 382, 380–414. [DOI] [PubMed] [Google Scholar]
- 23.Favaloro, F. G., Jr., Honda, T., Honda, Y., Gribble, G. W., Suh, N., Risingsong, R. & Sporn, M. B. (2002) J. Med. Chem. 45, 4801–4805. [DOI] [PubMed] [Google Scholar]
- 24.Honda, T., Favaloro, F. G., Jr., Janosik, T., Honda, Y., Suh, N., Sporn, M. B. & Gribble, G. W. (2003) Org. Biomol. Chem. 1, 4384–4391. [DOI] [PubMed] [Google Scholar]
- 25.Prochaska, H. J. & Talalay, P. (1988) Cancer Res. 48, 4776–4782. [PubMed] [Google Scholar]
- 26.Dinkova-Kostova, A. T., Holtzclaw, W. D., Cole, R. N., Itoh, K., Wakabayashi, N., Katoh, Y., Yamamoto, M. & Talalay, P. (2002) Proc. Natl. Acad. Sci. USA 99, 11908–11913. [DOI] [PMC free article] [PubMed] [Google Scholar]
- 27.Chou, T. C. & Talalay, P. (1984) Adv. Enzyme Regul. 22, 27–55. [DOI] [PubMed] [Google Scholar]
- 28.Wang, Y.-P. (2001) Ph.D. thesis (Dartmouth Medical School, Hanover, NH).
- 29.Baeuerle, P. A. (1998) Cell 95, 729–731. [DOI] [PubMed] [Google Scholar]
- 30.Heiss, E., Herhaus, C., Klimo, K., Bartsch, H. & Gerhauser, C. (2001) J. Biol. Chem. 276, 32008–32015. [DOI] [PubMed] [Google Scholar]
- 31.García-Piñeres, A. J., Castro, V., Mora, G., Schmidt, T. J., Strunck, E., Pahl, H. L. & Merfort, I. (2001) J. Biol. Chem. 276, 39713–39720. [DOI] [PubMed] [Google Scholar]
- 32.Juurlink, B. H. (2001) Can. J. Physiol. Pharmacol. 79, 266–282. [PubMed] [Google Scholar]


