

Abstract
The green nitrihemoglobin (α2β2 tetramer, NHb) was prepared by the aerobic reaction of excess nitrite with human hemoglobin A0 under mildly acidic conditions. A rate equation was determined and found to depend on nitrite, hydrogen ion and oxygen concentrations: –d[HbNO2]/dt = (k1 + k2(Ka[HNO2])[O2]1/2)•[ HbNO2], where k1 = 2.4 (±0.9) × 10-4 s-1, k2 = 1 (±0.2) × 105 M-5/2s-1 and Ka is the acid dissociation constant for nitrous acid (4.5 × 10⁻⁴ M). Also, the chemical properties of NHb are compared to those of the normal hemoglobin (including the addition products of both common oxidation states with exogenous ligands, the alkaline transitions of the ferric forms and the oxygen binding characteristics of the ferrous forms) and were found to be nearly indistinguishable. Therefore, the replacement of a single vinyl hydrogen with a nitro group on the periphery of each macrocycle in hemoglobin does not significantly perturb the interaction between the hemes and the heme pockets. Since non-photochemical reaction chemistry must necessarily be most dependent on electronic ground states, it follows that the clearly visible difference in color between hemoglobin A0 and NHb must be associated primarily with the respective electronic excited states. The possibility of NHb formation in vivo and its likely consequences are considered.
Keywords: alkaline transition, brown blood, EPR, green hemoglobin, MCD, nitric oxide, nitrite toxicity, oxygen binding
Table of Contents Graphic
Introduction
The proposed conversion of nitrite anion to nitric oxide by various metalloproteins, including hemoglobin (1-4) provides the mechanistic foundation for therapies involving sodium nitrite, such as treatment of hypertension, currently under development. Nevertheless, it is a matter of record that past interest in nitrite biochemistry has often centered on its toxicity and, consequently, even though good arguments can be made regarding the benefits of dietary nitrites (5), concerns persist of the possible role of nitrite in, for example, carcinogenesis (6), fish mortality in aquaculture systems (7) and certain methemoglobinemias in humans (8). Therefore, while laboratory animals certainly tolerate blood levels of sodium nitrite in excess of those employed therapeutically, questions of toxicity remain, particularly in relation to patients having multiple medical conditions. Until now, intravenous administration of sodium nitrite preparations has been the therapeutic norm, but currently, attempts to develop therapies based on inhaled sodium nitrite formulations are underway. Since lung tissue is exposed to significantly higher oxygen concentrations than are experienced systemically, especially in the clinic where supplemental oxygen is often given as an adjunct therapy, it is cogent to consider what the biochemical effects of elevated nitrite at higher than systemic oxygen levels might conceivably be. Moreover, as the vasculature appears to be a key site for nitrite-dependent activity, possible reactions of the nitrite anion with blood components is an obvious place to begin.
Aerobic treatment of hemoglobin and myoglobin with sodium nitrite under mildly acidic conditions has long been known to result in conversion of the initially red heme proteins to green forms (9) exhibiting electronic absorption spectra displaying split (or broadened) Soret bands and more pronounced visible region (α) bands than the starting molecules (e.g. Figure 1, main panel). The trivial names of the products nitrihemoglobin and nitrimyoglobin predate knowledge of the structure of “nitriheme” in which a vinyl hydrogen of protoheme (Figure 1: inset, structure A) has been regiospecifically substituted by a nitro group (Figure 1: inset, structure D) (10). Here we delineate the rate equation for the formation of the nitrihemoglobin tetramer (NHb) and suggest a plausible mechanism. In addition, we then compare some of the chemical and physical properties of NHb with those of hemoglobin A0 (Hb). The findings enable an assessment as to whether formation of small quantities of the green heme during nitrite therapy could lead to undesirable complications.
Figure 1. Comparison of the electronic absorption spectra of met nitrihemoglobin (metNHb) and methemoblobin A0 (metHb).
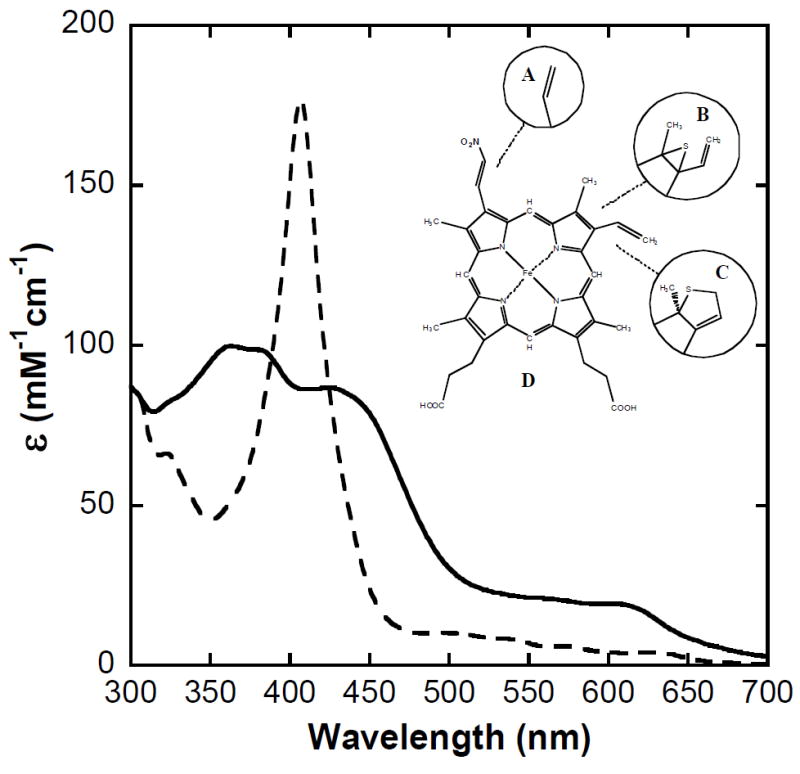
MetNHb (solid trace) and metHb (dashed trace) at pH 7.0 in 50 mM BIS-Tris buffer, 22 °C, 1.00 cm pathlength. Inset: Structures of protoheme and select (green) derivatives (9). A: protoheme; B: sulfheme (kinetically favored form); C: sulfheme (stable form); D: nitriheme. (Note: the trivial name “nitriheme” is a misnomer predating determination of the structure, but because it has been in use for decades we retain it here.)
Experimental Procedures
Preparation of Hemoglobin A0 and Nitrihemoglobin
Human hemoglobin A0 (Hb) was isolated from fresh blood obtained from a local blood bank (Central Blood Bank Manufacturing Operations, Pittsburgh) employing the ammonium sulfate crystallization procedure originally described by Drabkin (11-14). Nitrihemoglobin (NHb) was prepared using a variation of the published method for nitrimyoglobin (10). The pH of a solution of Hb (typically ~15 mL of 0.3 mM to 0.8 mM in heme) was lowered to 5.7 with monobasic sodium phosphate buffer (50 mM) and a 100-fold excess of sodium nitrite was added. The Hb solution was then stirred aerobically for 5 hours at room temperature. The resulting dark green solution was dialyzed at 6 °C against (i) 0.2 M sodium phosphate buffer (pH 7.0) 10 mM in sodium chloride and 1 mM in disodium EDTA for 24 hours, (ii) 25 mM bis-Tris buffer (pH 7.4) 0.1 M in NaCl for 24 hours, (iii) 25 mM bis-Tris buffer (pH 7.4) for 24 hours. Following dialysis, NHb solutions were concentrated by ultrafiltration (Amicon 8010) using a YM-30 membrane. The concentrations of Hb and the NHb product were determined by pyridine hemochrome assay (15) using the extinction coefficients ɛ557 = 34.5 mM-1cm-1 (16) and ɛ553 = 26.2 mM-1cm-1 (see Results) for protoheme and nitriheme respectively.
To prepare complexes of NHb, starting solution concentrations of 0.2 mM NHb were prepared either in sulfonic acid buffers (MES, HEPES, CHES, CHAPS) or potassium phosphate and various ligands (azide, cyanide) added in at least 100-fold excess. DeoxyNHb was prepared by rigorously degassing a metNHb solution and then adding a slight excess of sodium dithionite (EM Science) under argon. The fully oxygenated oxyNHb was prepared by first reducing metNHb and then re-admitting air in several steps until no further changes in the electronic absorption spectra were observed. MetNHb was prepared by adding a slight excess of potassium ferricyanide to oxyNHb solutions (11-12). Ferrocyanide and excess ferricyanide were removed by addition of NaCl to 10 mM followed by gel filtration chromatography on Sephadex G-25.
Isoelectric Focusing
Isoelectric focusing procedures were performed using BioRad equipment with IEF Ready Gels and reagents. The experiments were performed according to the manufacture’s instructions with a three-tier, constant-voltage protocol and typical run times of 21/2 hours at 6 °C.
Mass Spectrometry
Sample analysis (NHb, or extracted hemes) was performed by direct infusion into a triple quadrupole ESI mass spectrometer (Quattro II, Micromass UK Ltd., Manchester, England). Sheath flow was adjusted to 5μL/minute and the solvent consisted of 50% acetonitrile containing 0.1% acetic acid. The electrospray probe was operated at a voltage differential in the range of +2.3 to +3.5 keV in the positive ion mode and source temperature was maintained at 70°C. Scanning was performed in the range of 400-1700 every 3.5 s and individual spectra were summed. Ion series were deconvoluted and converted to molecular (+1 charged) spectra by a maximum entropy algorithm using software supplied by the manufacturer.
Kinetic Measurements
The kinetic conversion of Hb to NHb was monitored by following the appearance of the 450 nm electronic absorption band at 25°C or 37°C. The nitrite concentration, pH (using phosphate buffer), protein and oxygen concentrations were all varied as noted in the legends to the figures and the data analyzed using Kaleidagraph™ software. Experiments in which the oxygen concentration was varied were carried out using gas-tight syringes and glassware sealed with septa (see below). Usually, concentrations of dissolved oxygen were simply estimated by calculation (Henry’s law) however, in a limited number of cases the oxygen levels were verified using a Clarke-type oxygen electrode.
Alkaline Transition Measurements
The alkaline transition of metNHb was determined using a minor variation of a procedure described previously (17). MetNHb was prepared by adding a slight excess of potassium ferricyanide to ~0.03 μM solutions of oxyNHb and the resulting solution was then dialyzed against 0.3 M NaCl (2 days, 4 °C, 3 × 2.0-L buffer changes). After dialysis, a few drops of 1.0 M sodium hydroxide solution were added to the sample, raising the pH to ~11. Hydrochloric acid (10 mM) was then repeatedly added in 10 μL aliquots to lower the pH step-wise, the resulting pH and the absorbance change at 560 nm being measured after each addition of acid. For comparison, the alkaline transition for normal methemoglobin A0 was determined in similar fashion.
Oxygen Binding
Oxygen binding experiments were carried out on solutions of deoxyNHb (~ 60 μM) in bis-Tris buffer (50 mM, pH 7.4) rigorously degassing a metNHb solution (sealed in a cuvette fitted with a side arm of measured total volume and closed with a Subaseal™ gas-tight septum) and then adding a slight excess of sodium dithionite (EM Science) under argon. The electronic absorption spectra of these solutions were obtained to ensure complete deoxyNHb formation. Next 5 μL aliquots of air were added to the cuvette using a gas-tight syringe and the absorption spectral changes in the visible region (350 nm – 700 nm) recorded after each addition. Dissolved oxygen concentrations were calculated from Henry’s law after correcting for the measured levels of hemoglobin-bound oxygen. The final air-saturated spectrum was confirmed to correspond to the fully oxygenated derivative by the observation that replacing air in the cuvette with pure oxygen led to no further spectral changes. The fraction of deoxyNHb for each point was calculated from the absorbance changes ([Asample – Aoxy]/[Adeoxy - Aoxy]) at 420 nm, the maximum in the NHb difference spectrum (deoxy minus oxy). Analogous measurements with human hemoglobin A0 (Hb) were quantified at 577 nm.
Spectroscopic Measurements
Electronic absorption spectra were recorded using Shimadzu UV-1650PC and UV-2501PC spectrophotometers. X-band (9 GHz) EPR spectra were recorded on a Bruker ESP 300 spectrometer equipped with an Oxford ESR 910 cryostat for low-temperature measurements. The microwave frequency was measured with a frequency counter and the magnetic field was calibrated with a gaussmeter. Cryogenic temperatures were determined employing carbon-glass resistors (CGR-1-1000) from LakeShore. Access to this instrument and the software to analyze the EPR spectra were graciously provided by Michael P. Hendrich, Carnegie Mellon University. Cryogenic absorption and MCD spectra were recorded using an Aviv Associates (Lakewood, NJ) 41DS circular dichroism spectrometer in conjunction with a Cryomagnetics Incorporated (Oak Ridge, TN) cryomagnet as previously described (18-19). Glycerol was added to 50% (v/v) to MCD samples prior to freezing in order to obtain an optically transparent glass. EPR samples were prepared by transferring 200 μL of NHb or Hb (~500 μM) into an EPR tube using a Teflon “needle.” Nitric oxide EPR samples were prepared from anaerobic solutions of deoxyNHb (or deoxyHb) by passing purified NO gas over the top of the solution for a few minutes, then transferring a 200 μL aliquot into an EPR tube anaerobically and freezing it by immersion in liquid nitrogen. Samples were stored frozen in liquid nitrogen and transferred to the EPR spectrometer without thawing.
Results
Preparation and Characterization of Nitrihemoglobin (NHb)
Hb was converted to NHb using a minor variation of a previously reported procedure for preparation of nitrimyoglobin (10). The critical difference was that the reaction was carried out in 50 mM sodium phosphate (pH 5.7) rather than the sodium citrate-buffered reaction mixture of the previous authors. In our experience, the use of citrate buffer leads to incomplete reaction and significant precipitation of the product, whereas the phosphate-buffered solutions remained non-turgid and once the reaction was complete, the electronic absorption spectrum of the product was reproducible for hours. From the absorption spectral changes observed during the formation of NHb (Figure 2, main panel) and the absence of any discernable feature at 557 nm in the pyridine hemochrome spectra (Figure 2, inset) of products, it is clear that conversion of protoheme to nitriheme was essentially quantitative. After addition of NaCl to 0.1 M and extensive dialysis against 25 mM Bis-Tris buffer (pH 7.4) the preparations were considered to be free of excess sodium nitrite by visible region electronic and EPR spectroscopic measurements (see Spectroscopic Properties of Ferric Derivatives).
Figure 2. Conversion of hemoblobin A0 (Hb) to nitrimethemoblobin (NHb) monitored by electronic absorption spectroscopy.
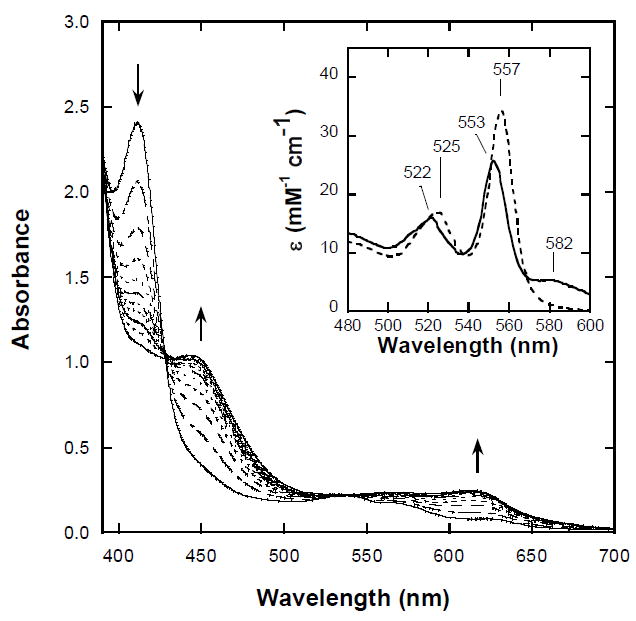
MetHb-nitrite (20 μM in heme, 5 μM in tetramer) is converted to metNHb-nitrite in the presence of 0.3 M sodium nitrite at pH 5.7 in 50 mM sodium phosphate buffer, 22 °C, 1.00 cm pathlength. Inset: Pyridine hemochromagen of Hb (dashed line) and NHb (solid line) both in 80% (v/v) 0.1 M NaOH, 20% (v/v) pyridine, plus excess sodium dithionite.
Initial concentrations of hemoglobin A0 were determined by the pyridine hemochrome method employing the revised extinction coefficient ɛ557 = 34.5 (±0.4) mM-1cm-1 for protoheme suggested by Paul et al.(16). Taking the concentration of NHb upon completion of the reaction to be equal to the initial hemoglobin A0 concentration (i.e. assuming no loss of total heme) we determined the extinction coefficient for the pyridine hemochrome of nitriheme to be ɛ553 = 26.2 (± 0.3) mM-1cm-1. As the same result was obtained four times, with reproducibility to three significant figures, we conclude that the main source of error is uncertainty in the extinction coefficient used to determine the initial hemoglobin A0 concentration. Accordingly, using the range of the results for different heme preparations quoted by Paul et al. (16) (±1.2%) we have estimated the uncertainty in the value for the pyridine hemochrome for nitriheme to be ±0.3. The locations of the visible-region (Q-band) maxima of pyridine hemochrome absorption spectra are sensitive indicators of variations in heme structure (15). At 553 nm, the maximum obtained in the case of the present NHb preparations is exactly the same as that found using bona fide nitrimyoglobin samples (a gift from Russell Timkovich, The University of Alabama) in which the modification has been shown by NMR spectroscopy to be the regiospecific addition of a single nitro group as in Figure 1 (insert, structure D) (10).
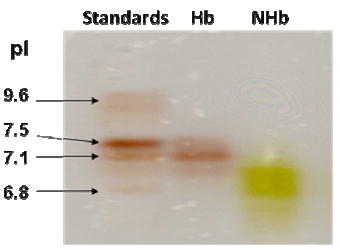
Isoelectric focusing of hemoglobin A0 preparations typically produced three bands with the major band (pI = 7.1) corresponding well to the methemoglobin A0 standard (not shown). The single green NHb band obtained was always more diffuse (pI = 6.8 ±0.1) than those of the starting molecules. The shift in the pI upon formation of NHb (~0.3) is modest and could, conceivably, arise solely from heme nitration leading to some minor changes in tertiary structure around the heme pockets, but without any necessary covalent protein modification. If the hemoglobin tetramer had dissociated into separate α-chains and β-chains during conversion to NHb, two well-resolved bands should have been observed in the isoelectric-focusing gel, which was not the case.
Preparations of NHb were further examined by electrospray-ionization mass spectrometry (Table I). As commonly found in the case of other hemoglobins, neither NHb tetramers, nor the holoprotein forms of α-chains or β-chains, were distinguishable from noise. The heme-free α-chains of NHb were unmodified (m/z = 15,125 ± 1 found, cf 15,126 reported (20-21) while the heme-free β-chains appeared to contain at least one modification (m/z = 15,934 ± 1 found, cf 15,867 reported (20-21)). The additional 67 amu per β chain corresponds to substitution of one –H by –NO2 (+46–1) plus replacement of H+ with Na+ (+22–1) during ionization. The latter process is commonly encountered during electrospray experiments and, in support of this interpretation, there was also a 22 amu adduct of the α chain present as a minority species in the data. As the heme moiety was not detected in the mass spectra of the intact protein samples, the extracted cofactors were examined independently and, as expected, the nitriheme was found to contain one –NO2 group (m/z = 661 found, in keeping with the structure of Figure 1, insert structure D). There was no evidence for any residual protoheme, or doubly-nitrated hemes, in the mass spectral data of nitriheme samples.
Table 1.
ESI mass spectral analysis of nitrihemoglobin.
| Literature (Hb A0)* | Found (NHb)‡ | Comments | |
|---|---|---|---|
| Heme-free α-chain | 15,126 | 15,125 | Unmodified α-chains |
| Heme-free β-chain | 15,867 | 15,934§ | §Suggests β-chain + Na + –NO2 (i.e. 15,867 + 23 – 1 + 46 – 1) |
| Heme cofactor | 616 | 661† | †As predicted for nitriheme ( i.e. 616 + 46 – 1) |
Roberts et al. (1997) Clin. Chem. 43 771-6;
standard error ±1.1.
Rate Equation for the Conversion of Hb to NHb
Depending upon the starting material (deoxyHb or metHb) the conversion of Hb to NHb can be thought of as occurring in one or two fast processess, followed by a slower reaction requiring several hours for completion. As is well known (22-23) nitrite converts HbO2 to metHb, which then binds excess nitrite to form the metHb-nitrite adduct (HbNO2):
| (1) |
| (2) |
While the mechanism of the first reaction (1) can be quite complicated (22), at pH 5.7 the reaction is completed within milliseconds at the nitrite concentrations necessary to convert Hb to NHb. The binding of nitrite to metHb is somewhat slower but still occurs within 1 second and thus, at the high nitrite concentrations used, the starting form for the slower conversion of Hb to NHb will be HbNO2:
| (3) |
The electronic spectral changes observed during conversion of HbNO2 to NHbNO2 are isosbestic in nature (Figure 2) strongly suggesting that there were indeed essentially only two inter-converting heme species present. The absence of high-spin signals from the EPR spectra of metHb samples containing 103-fold molar excesses of nitrite (data not shown) confirmed that HbNO2 should be considered the starting species. There was a readily demonstrable linear dependence of the conversion rate on the nitrite concentration when this was present in more than a thousand-fold excess over the Hb (Figure 3A). At lower nitrite concentrations relative to the Hb, the observed reaction rates were inconveniently slow for kinetic studies and much less reproducible. The dependence of the reaction rate upon pH was observed in a narrow range due to problems with protein precipitation at pH values < 5 and the long reaction times (again causing protein precipitation and baseline shifts) at pH > 7. However, there was clearly a dependence of the rate on the proton concentration, increasing rate with decreasing pH (Figure 3B). It had been previously suggested (24) that the conversion of Hb to NHb might require the presence of oxygen and we attempted to confirm this idea. Working in an anaerobic glove-box, reaction mixtures were prepared at ~0.2 nM [O2] and sealed in (completely filled) optical cuvettes – all equipment used had been stored in the working glove-box overnight to ensure exchange of any oxygen that might have permeated seals etc. After 30 minutes, some NHb formation was detectable by absorption spectroscopy and the reaction was still proceeding at the same slow rate 1 hour after sealing the reaction vessel. If plotted with the rest of the oxygen-dependence data (Figure 3C) this point appears very close to the origin. A number of samples prepared under anaerobic conditions, where there was some deoxyHb initially present, yielded signals in their EPR spectra (not shown) characteristic of nitrosylHb, which is unsurprising as solutions containing high nitrite concentrations often produce some nitric oxide (NO). However, if NO2– is converted to NO, then production of some oxygen is also likely via reactions such as:
and consequently, we can never be certain that there was not a trace quantity of oxygen constantly being replenished in our nominally anaerobic reaction mixtures. Therefore, while a definitive statement must remain elusive, so far as we can tell, the conversion rate of Hb to NHb is insignificant in the absence of oxygen. Subsequently, in the experimentally accessible range in which oxygen was in pseudo-first order excess over Hb, the reaction rate was found to actually depend upon the square root of the oxygen concentration (Figure 3C). Addition of another metHb ligand, fluoride, to the reaction mixtures decreased the observed rate (Figure 3D) suggesting that access of nitrite to the heme iron is mechanistically important. The following rate equation was derived from these observations:
| (4) |
where k1 and k2 were respectively found to be 2.4 (±0.9) × 10-4 s-1 and 1 (±0.2) × 105 M-5/2s-1 at 22 °C, Ka is the acid dissociation constant for nitrous acid (4.5 × 10⁻⁴ M) and [HbNO2] is the concentration of the nitrite adduct of the unmodified protoheme (i.e. 4 × the hemoglobin concentration). It is to be understood that equation 4 strictly only applies to the linear regions of the data in Figures 3A, 3B and 3C – certainly, at least for nitrite and oxygen, the reaction rate approaches zero at infinite reagent dilution. Thus, equation 4 is a restricted rate law that any more general rate law must approximate to in the linear range we have studied. The presence of two positive terms (involving k1 and k2) indicates the existence of at least two mechanistically distinct alternate pathways.
Figure 3. The effect of nitrite, hydrogen ion, oxygen and fluoride concentrations on the rate of formation of NHb.
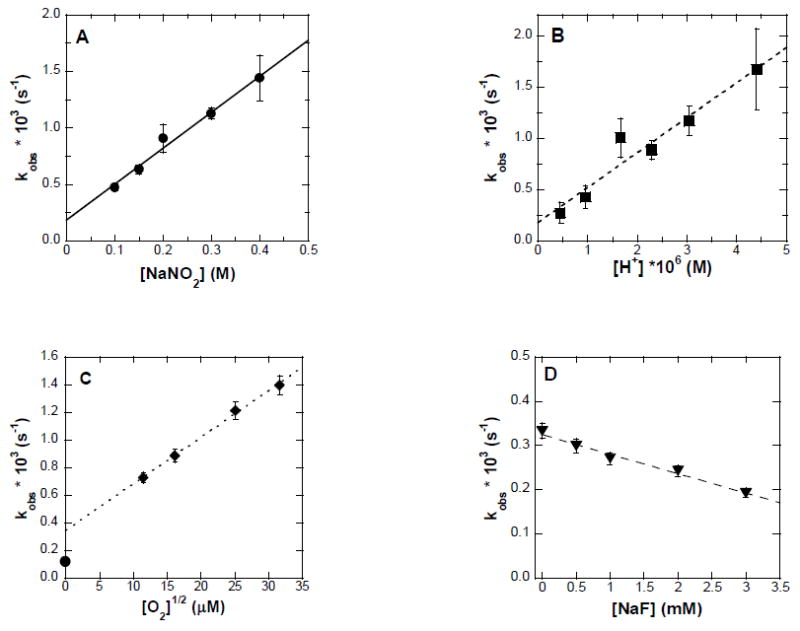
Reactions were carried out starting with metHb (20 μM in heme) in 50 mM sodium phosphate buffer, 22 °C, 1.00 cm pathlength and followed at 450 nm. A: Nitrite concentrations were varied while the oxygen concentration was 260 μM at pH = 5.7. B: Hydrogen ion concentrations were varied while nitrite concentration was maintained at 0.3 M and the oxygen concentration was 260 μM. C: Oxygen concentrations were varied by mixing argon and 100% pure oxygen and then calculating the dissolved oxygen concentration. The point (•) at 0.2 nM oxygen was generated by starting the reaction in a glovebox as described in the Results section of the text. Nitrite concentration was 0.3 M and pH = 5.7. D: Fluoride concentrations were varied between 0 and 500 mM, while the nitrite concentration was maintained at 0.3 M, the oxygen concentration was 260 μM at pH 5.7.
Spectroscopic Properties of Ferric Derivatives
The electronic absorption spectrum of metNHb in bis-Tris buffer at pH 7.4 (Figure 1, solid trace) contains distinct bands at λmax = 370 nm and 440 nm (the Soret, or B band) plus λmax = 610 nm (the visible-region, or Q band). It is clear that in comparison with the absorption spectrum of unmodified metHb (Figure 1, dashed trace) the Soret band of metNMb appears split in two, plus the visible-region band is more pronounced. These characteristics, while generally representative of iron-chlorins (like sulfhemoglobins) rather than iron-porphyrins (like protoheme and nitriheme) (19, 25), are in keeping with the absorption characteristics of nitrimyoglobin derivatives (10). Interestingly, in phosphate buffer the “split” Soret of metNHb coalesces into a single broad band (not shown) suggesting an increased microheterogeneity of the heme pocket.
Typical low-spin ferric derivatives of metNHb, such as the azide, cyanide, or hydroxide adducts exhibit visible-region absorption spectra that are distinct from the spectrum of the high-spin metNHb from which they are prepared (see Alkaline Transition below). However, the differences are less dramatic than those observed between the absorption spectra of the analogous metHb derivatives. Occasionally, the absorption spectra of metNHb samples were found to be intermediate between the aquo (high-spin) and hydroxo (low-spin) types. This is attributable to the presence of residual nitrite anion, which produces two low-spin species that are readily detectable by cryogenic EPR. Following the addition of NaCl to 10 mM and subsequent dialysis, the EPR spectrum of metNHb frozen at pH ~6 exhibits an axial signal (gxy = 6.0, gz = 2.0) typical for high-spin ferric heme (Figure 4A, solid trace) and essentially indistinguishable from that of aquometHb prepared under the same mildly acidic conditions (Figure 4A, dashed trace). The addition of sodium nitrite to metNHb results in the loss of the high-spin signal from the EPR spectrum and the appearance of two low-spin (S = ½) ferric heme signals (gz= 3.06, 2.92; gy = 2.32, 2.10; gx ~1.5) (Figure 4B, solid trace). These signals were observed as minority components in the spectra of some NHb preparations before dialysis in the presence of NaCl. Again, essentially the same signals are observed in the spectrum of the metHb nitrite adduct (Figure 4B, dashed trace). While the nitrite anion would normally be considered a weak-field ligand, the low-spin nature of its hemoglobin adducts was first indicated by magnetic susceptibility measurements more than 40 years ago (26) and subsequent EPR measurements on nitrite-treated whole blood (27). Low-spin nitrite adducts of several other ferric heme proteins have also been reported (28). The EPR spectrum of the metmyoglobin-nitrite adduct at pH 7.4 in bis-Tris buffer (not shown) contains only a single low-spin signal (gz = 2.98, gy = 2.20, gx = 1.56) suggesting that the α-chain hemes and β-chain hemes in the hemoglobin tetramers might be responsible for the two low-spin signals observed (Figure 4B). The EPR spectra of metNHb (solid trace) and metHb (dashed trace) frozen at pH 7.4 (Figure 4Ci) include both high-spin (aquo) and low-spin (hydroxo) components. When excess cyanide or azide is added to either hemoglobin at pH 7.4, the EPR signals of both the aquo and hydroxo species disappear and are replaced by other low-spin signals indicating the formation of cyanide and azide adducts (Figure 4Cii and Figure 4Ciii). The overall similarity of the associated g-values (Table II) indicates that these low-spin derivatives of metNHb and metHb exhibit only very minor differences. Since the EPR spectra of low-spin ferric chlorins and bacteriochlorins, for example, are clearly more axial (18-19), the current EPR spectra confirm that the nitriheme macrocycle retains the essential structural feature of a porphyrin (i.e. a fully unsaturated tetrapyrrole ring).
Figure 4. X-band EPR spectra at 20 K of nitrihemoglobin (NHb) and hemoglobin A0 (Hb) derivatives.
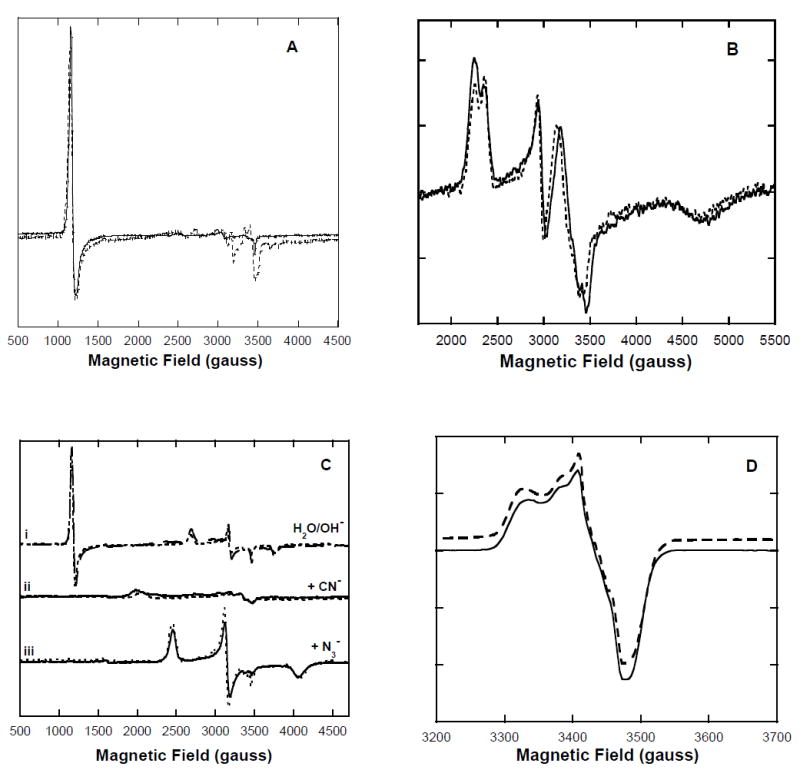
Sample concentrations were 200 μM in heme, pH 7.4 in 50 mM HEPES buffer. EPR conditions: 9.8 G modulation amplitude, 63.2 μW microwave power. A: MetHb (solid line) and metNHb (dotted line). B: MetNHb plus 20 mM sodium nitrite (solid trace) and metHb plus 20 mM sodium nitrite (dotted trace). C: (i) MetNHb (solid trace); metHb (dashed trace); (ii) MetNHb plus 200-fold excess sodium cyanide (solid trace) and metHb plus 200-fold excess sodium cyanide (dashed trace); (iii) MetNHb plus 200-fold excess sodium azide (solid trace) and metHb plus 200-fold excess sodium azide (dashed trace). D: Nitric oxide adducts of deoxyNHb (solid trace, [NO] = 1 atm) and deoxyHb (dashed trace, [NO] = 1 atm), spectra are slightly offset for clarity.
Table 2.
Comparison of low-spin methemoglobin EPR parameters.
| Ligand | metNHb | metHb A0 | ||||
|---|---|---|---|---|---|---|
| gx | gy | gz | gx | gy | gz | |
| azide | 2.81 | 2.19 | 1.70 | 2.81 | 2.19 | 1.68 |
| cyanide | 3.46 | 2.06 | ---* | 3.46 | 2.06 | ---* |
| hydroxide | 2.56 | 2.17 | 1.84 | 2.59 | 2.18 | 1.83 |
| nitrite | 3.06, 2.92 | 2.32, 2.10 | 1.45 | 3.06, 2.92 | 2.32, 2.10 | 1.48 |
Difficult to observe.
Spectroscopic Properties of Ferrous Derivatives
In bis-Tris buffer at pH 7.4, the electronic absorption spectra of oxyNHb (Figure 5A, solid trace) and deoxyNHb (Figure 5A, dashed trace) exhibit split Sorets and pronounced visible-region bands – the absorption minimum between ~500 nm and ~600 nm resulting in the distinct green color of NHb. In similar fashion to the metNHb spectra, the split Sorets of these ferrous derivatives coalesce to appear as single broad bands in phosphate buffer (not shown). More intriguingly, the spectrum of oxyNHb (λmax = 390 nm, 412 nm and 613 nm) is readily distinguishable from that of deoxyNHb (λmax = 390 nm, 421 nm and 619 nm) only when the two are superimposed. This is like the reported appearance of the analogous nitrimyoglobin spectra (10), but quite unlike the case for normal Hb, in which the absorption spectra of the oxy- and deoxy- species exhibit both clearly different Soret bands and distinct envelopes in the visible region (Figure 5A, inset). There is a histidine on the distal side of the heme pocket that, at least in methemoglobins, can act as an axial ligand under certain circumstances (29). Such bis(histidine) hexacoordination has also been identified in both ferrous and ferric forms of cytoglobin, neuroglobin and other globins from bacterial, plant and invertebrate sources (30). Consequently, a plausible explanation for the similarity of the absorption spectra in the main panel of Figure 5A could be that they are dominated by features arising from a bis(histidine) adduct, the oxyNHb and deoxyNHb being minority components. To clarify this matter we further examined these species by magnetic circular dichroism (MCD) spectroscopy. The visible-region MCD spectra at 4.2 K and 5.0 T of oxyNHb (Figure 5B, solid trace) and deoxyNHb (Figure 5B, dashed trace) are much more obviously different than their corresponding absorption spectra. Furthermore, the magnetic-field dependence of the deoxyNHb signal at 480 nm (●) is nearly linear suggesting the sample to be predominantly diamagnetic, whereas the oxyNHb sample data taken at the same wavelength (■) curves sharply as the magnetic field increases indicating the presence of a strongly paramagnetic species (Figure 5B, inset). This is quite surprising because the ground-state magnetic properties of the NHb derivatives appear to be opposite to those of their normal Hb (hemoglobin A0) counterparts, where oxyHb is diamagnetic and deoxyHb is a paramagnet. In view of the interesting outcome of this exploratory magnetization study, a detailed characterization of the magneto-optical properties of the oxyNHb and deoxyNHb derivatives is planned for the future. For now, however, despite the similarity of their absorption spectra, the MCD data suffices to demonstrate that the oxyNHb and deoxyNHb samples clearly contain different majority species.
Figure 5. Electronic absorption and magnetic circular dichroism (MCD) spectra of oxy-NHb and deoxyNHb.
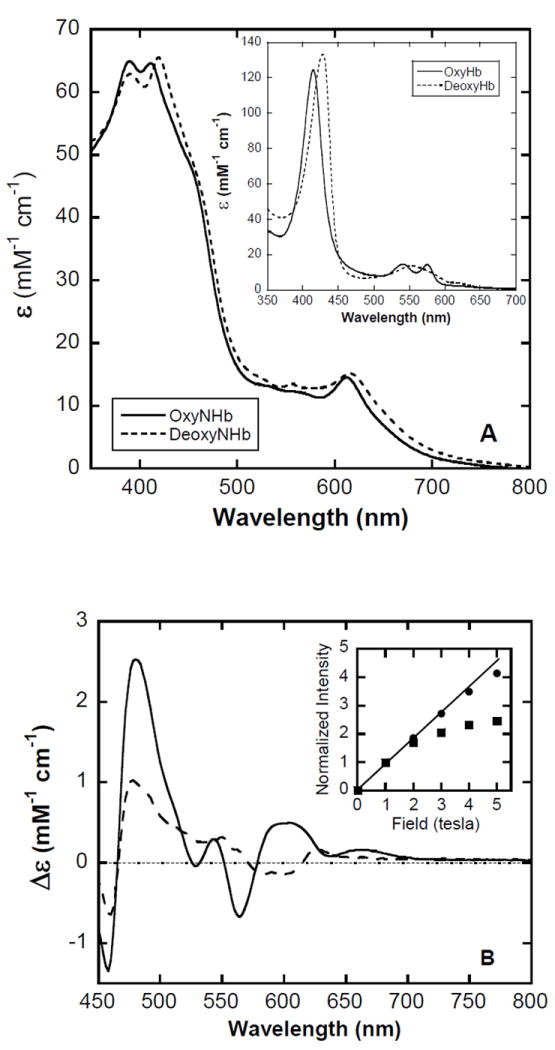
A:Absorption spectra of oxyNHb (solid trace) and deoxyNHb (dashed trace) at pH 7.4 in 50 mM bis-Tris, 22°C, 1.00 cm pathlength. Inset: Oxy- (solid trace) and deoxy- (dashed trace) hemoglobin A0 for comparison. B: MCD spectra of oxyNHb (solid trace) and deoxyNHb (dashed trace) at 4.2 K and 5 tesla, pD 7.8, 25 mM bis-Tris buffer, 50% glycerol (v/v), 0.2 cm pathlength. Inset: Field-dependent intensity changes of oxy- (●) and deoxy- (□) NHb MCD spectra at 480 nm. The data sets have been normalized at 1 tesla to assist visual comparison.
The nitric oxide (NO) adduct of deoxyNHb was briefly investigated by EPR spectroscopy (Figure 4D). The spectrum of nitrosylNHb (solid trace) is indistinguishable from that of normal nitrosylHb (dashed trace) at pH 7.4 in 50 mM bis-Tris buffer, under ~1 atmosphere NO. These particular spectral features are associated with hexacoordinate nitrosylHb in the relaxed (R) state (31). Therefore, at least in the R-states, the nitric oxide adducts of deoxyNHb and deoxyHb appear to be essentially identical by EPR spectroscopy.
Alkaline Transition
The visible region electronic absorption spectra of the high-spin aquometNHb and low-spin hydroxometNHb are different (Figure 6, inset) but not as markedly so as the corresponding spectra of the analogous metHb acid and alkaline forms. To avoid any ambiguity, we examined the pH dependence of both the EPR and absorption spectra of metNHb. The ratio aquometNHb:hydroxometNHb was quantified by double integration of the EPR signals and the corresponding absorption spectral changes were monitored at 607 nm. A comparable data set was obtained for metHb. The EPR and absorption-derived data for both metNHb and metHb were found to be superimposable and reasonably fit by single curve with pKa = 8.2 (Figure 6). In fact, if the EPR data alone (obtained at pH values of 6, 7, 7.5, 8, 8.5 and 9) is used to calculate the pKa, a value of ~8 is obtained. However, these two results are not contradictory given the unavoidable problem that the pH tends to drift upon freezing, leading to increased imprecision in the EPR data compared to that extracted from the electronic absorption spectra. It is clear by inspection of Figure 6 that any differences between the alkaline transitions of metNHb and metHb, or the EPR and absorption-derived estimates of the associated pKa, are within the experimental uncertainty. Variations in the alkaline transitions of heme proteins are undoubtedly more a consequence of heme-pocket properties than the heme group per se (17). It follows that, at least in terms of this particular functional characteristic, the metNHb heme pocket seems unperturbed compared to that of metHb.
Figure 6. Plot of the fraction of alkaline forms of metNHb and metHb with increasing pH.
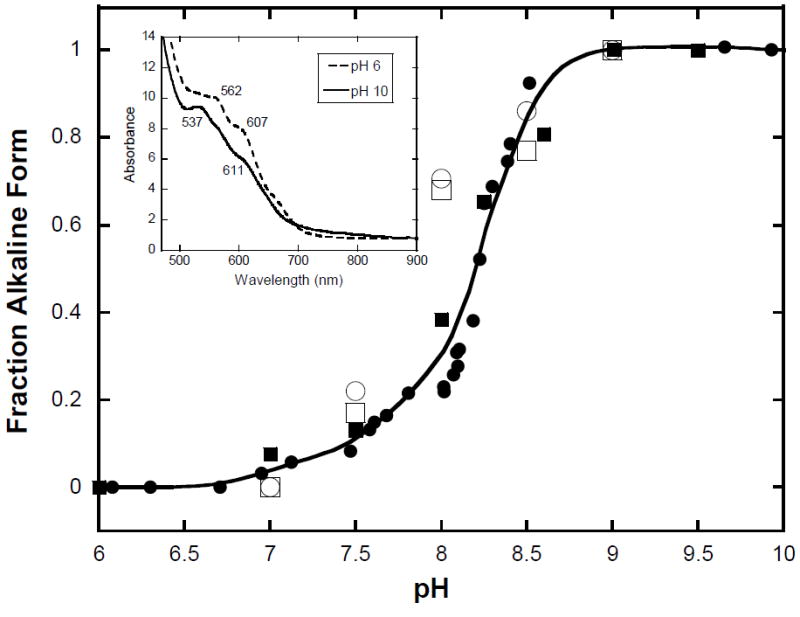
Electronic absorption spectral changes of metNHb (■, monitored at 562 nm) and metHb (●, monitored at 630 nm). The solid trace represents a theoretical fit of the data to the Henderson-Hasselbalch equation with pKa = 8.2. Inset: Electronic absorption spectra of metNHb at pH 6 (dashed line) and at pH 10 (solid line) in 0.3 M NaCl, 23 μM in heme, 1.00 cm pathlength, 22°C. The additional results for metNHb (□) and metHb (○) determined by EPR spectroscopy are less reliable as the effective pH unavoidably “drifts” during freezing of the sample.
Oxygen Binding
It is widely known that the oxygen-dissociation curves of hemoglobins are sensitive to anionic effectors including various phosphates. As residual sodium nitrite was often found to be present in the NHb preparations by EPR spectroscopy and the mass spectral data suggested the introduction of a nitro group to each β chain, the oxygen-binding characteristics of NHb and Hb were compared in the presence of sodium phosphate, added to promote equivalent occupation of sites with affinity for small anions in the two molecules. The oxygen-dissociation curves obtained for NHb and Hb under these conditions were just distinguishable within experimental uncertainty and reasonably fit by theoretical saturation curves generated using the Hill coefficients of n = 1.5 and 1.9 respectively (Figure 7). The value n = 1.9 has previously been reported for hemoglobin in phosphate buffer (32) and is unlike those for myoglobin and sulfhemoglobin, for example, systems in which there is no cooperativity (n = 1) (33-34). Based on these results, it is evident that at least under the conditions reported here, the oxygen binding characteristics of NHb do not differ dramatically from those of normal Hb; that is, some degree of cooperativity is preserved in the NHb tetramer. Of equal interest is the observation that while the oxygen affinities of NHb and Hb are comparable (P50 = 1.9 and 2.5 torr, respectively, under the present conditions) the oxygen affinity of nitrimyoglobin is reported (P50 = 9.8 torr) to be an order of magnitude less than that of oxygen for normal myoglobin (P50 < 1 torr) (24). Thus, in the case of ligand binding to the ferrous derivatives, it appears that conversion of protoheme to nitriheme significantly modifies the net heme pocket behavior of myoglobin, but much less so that of hemoglobin. However, it must also be noted that the absorption spectral differences between the oxy- and deoxy- forms of both nitrimyoglobin and NHb are small enough that both oxygen binding curves may have significant associated errors.
Figure 7. Oxygen saturation curves for NHb (■) and Hb (●).
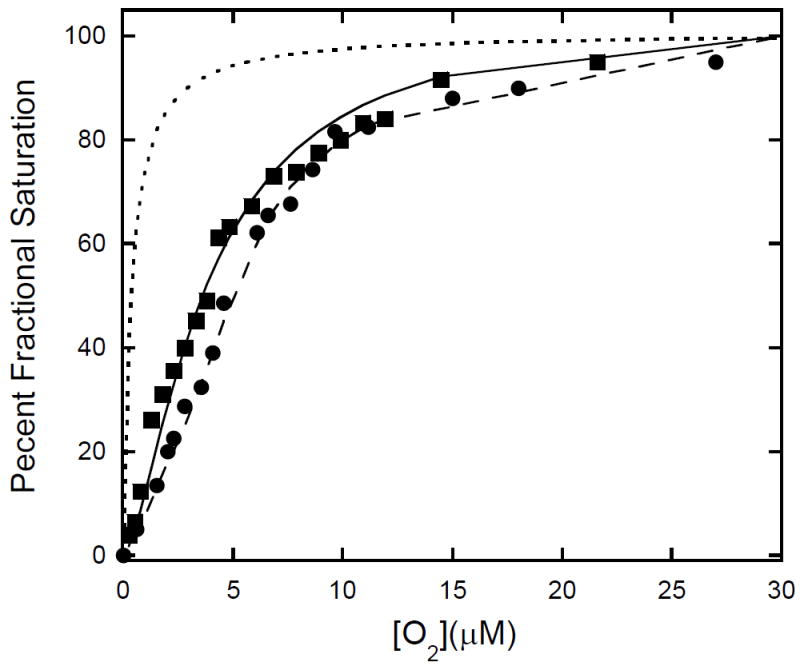
The solid trace represents a n [pO ] simulation using the fractional saturation with n = 1.5 and the dashed trace a simulation with n = 1.9. Measurements were taken at pH 7.4 in 50 mM bis-Tris buffer, 10 mM in sodium phosphate, 25 °C, using wavelengths of 577 nm (Hb) and 420 nm (NHb). The dotted trace shows the result predicted for a system with no cooperativity (n = 1.0) for example, myoglobin, or sulfhemoglobin.
Peroxidatic Activity
In standard assays, Hb exhibits a very low level of peroxidase activity which was found to be similarly low in NHb (not shown) suggesting there to be little change in the reactivities of the oxyferryl states in the two hemoglobins. This finding is important because the peroxidatic activity of hemoglobin released following hemolysis under some pathological circumstances has cytotoxic consequences (35-36). Any such undesirable activity will likely not be significantly increased by formation of NHb.
Discussion
Likely Reaction Mechanism(s)
The restricted rate law (equation 4) together with some of the other observations, points to certain features of any plausible mechanism(s) for the conversion of Hb to NHb under the conditions used. The requirement for the k1 term in equation 4 is clear from the linear fits to the data of Figures 3A, 3B and 3C, which all extrapolate to intercept their ordinate axes at positive values (i.e. estimates of k1). A reasonable interpretation of this finding is that a contribution to the net rate (i.e. one pathway) depends on a transition state involving the HbNO2 species alone – such as a necessary protein conformational change and/or a reorientation of its nitrite ligand. However, at this time we do not have any evidence regarding the physical nature of the actual process(es) involved.
We suggest that replacement of the single –H by –NO2 in one vinyl group (conversion of structure A to structure D in Figure 1 inset) is presumably an electrophilic substitution requiring a strong electrophile. A dependence of the rate on [H+] and [NO2–] (term with k2 equation 4) is often indicative of the involvement of nitrosonium ion (NO+) in a reaction (viz. HNO2 → NO+ + OH–). However, if this were the case, it would necessitate the subsequent insertion of an oxygen atom to attain the required final structure and it is likely that some of the intermediate would persist. Neither the results of previous authors working with myoglobin (10), nor our present hemoglobin data (Figure 2), provide any compelling evidence for additional heme products other than nitriheme. Consequently, we are drawn to conclude that the attacking electrophile is probably the nitronium ion (NO2+) and as we seem to be dealing with a single green product, this argument applies to both competing pathways indicated by the two positive terms with k1 and k2 in equation 4.
Nitronium ion is most commonly generated secondary to the formation of N2O5 (viz. N2O5 → NO2+ + NO3–) and it follows, therefore, that an N2O5-like species is a possible intermediate. Noting that the formation of N2O5 typically involves a net dehydration process in concentrated acidic media (e.g. 2HNO2 + ½O2 → N2O5 + H2O) we propose that an otherwise analogous reaction involving the nitrite adduct of methemoglobin (heme–NO2) occurs during the protoheme to nitriheme conversion; where the heme–NO2 now replaces one of the two HNO2 reactant molecules of the more common heme-free process and facilitates the reaction under less acidic conditions:
| (5) |
This idea is in keeping with the term containing k2 in equation 4 and further support comes from the observation that heme–NO2 (or HbNO2) is the initial species detected in the reaction mixtures (Figure 2, main panel) and that the presence of fluoride, a competing ligand for the heme, is inhibitory (Figure 3D).
NHb Formation In Vivo?
Realistically, even in the case of patients undergoing nitrite therapy with supplemental oxygen and who also happen to be experiencing acidosis, the term involving k2 in equation 4 will be negligible. Thus, with the important caveat that we have not been able to determine at which point the rate deviates from linearity and trends down to zero, in vivo, the maximum rate of NHb formation is predicted to be simply k1•[heme], where the correct [heme] value is actually the concentration of the methemoglobin-nitrite species. Average values for the metHb (0.64% (37)) and total heme (7.5 mM (38)) contents of human blood indicate a metHb concentration of 48 μM in the blood of normal adults. At 37 °C, we determined the rate of NHb formation to be 2.1 times faster than at room temperature, leading to an estimated formation rate of NHb in humans to be given by:
Following a single-dose administration, elevated nitrite levels persist for about 15 min. in healthy volunteers (39) suggesting that ~22 μM NHb could be formed, but as this would amount to only 0.29% of the total heme present, it is likely to remain unnoticed. However, it is conceivable that there may be situations encountered in the clinic where individuals may have undergone conversion to metHb of significantly more than 0.29% of their total hemoglobin. Methemoglobinemias are usually not fatal before about 60% of the total hemoglobin has been converted and severe nitrite-dependent methemoglobinemia is of particular concern in newborns (8). Additionally, there might be other possible physiological routes to nitriheme and the similar structure where the –NO2 (structure D in Figure 1 inset) is replaced with an –NO group. For instance, there is a compelling argument that NO-dependent nitrosative stress can be predominantly associated with N2O3 generation (40-41), one isomer of which seemingly has the effective structure NO+NO2– (42). Taking clues from the mechanistic discussion above, this molecule could presumably dissociate in the heme pocket of metHb so that NO2– would bind to the heme and the released NO+ electrophile could then substitute for the vinyl proton. In summary, there is good reason to suspect that detectable levels of NHb, or the related derivative in which the –NO2 is substituted by an –NO group, may very well be formed in vivo under some circumstances. However, this would likely manifest itself as a browning of the blood, which in the absence of a careful analysis of the hemoglobins present, would probably be misinterpreted solely as methemoglobinemia. In relation to this point, a potentially fatal condition in fish known as “brown blood disease” is caused by high nitrite levels in the water (43), but particularly since a diagnosis can be made simply by observing darkening of the gills, it is not clear that any of the relevant blood samples have ever been examined for the possible presence of nitriheme.
Physicochemical Properties of NHb
Despite the obvious marked differences in their electronic absorption spectra (e.g. Figures 1 and 2) and distinct appearance (i.e. green versus red) in all respects examined thus far, the chemical properties of NHb and normal hemoglobin A0 are extremely similar; more so than those of sulfhemoglobin and hemoglobin A0. The present data is in full agreement with the previous suggestion (18-19) that the electronic ground states of protoheme and nitriheme must not differ significantly (since these are the electronic states involved in non-photochemical reactions) and that differences in the electronic excited states must account for their distinct characteristics. However, the earlier work was limited to studies of a small number of metnitrimyoglobin derivatives; whereas the current results encompass all three common (ferrous, ferric and oxyferryl) heme oxidation states and show that the NHb tetramer exhibits oxygen-binding cooperativity.
The addition of most ligand species to hemoglobin leads to only a single EPR signal arising from the fully formed adduct (e.g. Table II). An unexpected finding of the present study was that addition of nitrite anion to either metNHb or methemoglobin A0 results in the production of not one, but two distinct low-spin ferric hemes yielding signals that are essentially resolved in the EPR spectrum (Figure 4B). A recent crystallographic study (44) has revealed the nitrite ligand to adopt the atypical O-nitrito (oxygen donor) binding mode. Moreover, the O-nitrito conformations at the α-chain and β-chain hemes were found to be different, in keeping with the two low-spin EPR signals we report here. To date, we have been unable to find any compelling evidence for additional nitrite adducts such as an EPR-silent component in phosphate-buffered saline methemoglobin solutions (41). In our manipulations, irrespective of the buffering media, addition of sodium nitrite to samples always led to the quantitative conversion of aquomethemoglobin and hydroxomethemoglobin EPR signals to the two low-spin nitrite adducts, as determined by spectral simulations – in agreement with the results of others (45). The finding that the two different O-nitrito conformations for binding nitrite reported for methemoglobin A0 (44) are preserved in metNHb (Figure 4B) provides a strong piece of evidence that the essential distinguishing characteristics of the α-chain and β-chain heme pockets are barely perturbed by the heme nitration.
Based upon the above observations, it can now be asserted that nitriheme seems to be a spectroscopically-distinct, but otherwise, near-ideal mimic of protoheme, specifically so in the case of hemoglobin. Consequently, it follows that any formation of NHb (and probably also the similar derivative in which the –NO2 is substituted by an –NO group) during nitrite therapy should result in minimal pathophysiological consequences and thus, probably requires no specific medical intervention. There is further reason to suppose that such modifications of a fraction of the hemes present need not necessarily drastically change the behavior of the whole blood. A recent case report has described a patient with distinctly green blood due to an extraordinarily high concentration of sulfhemoglobin (structures B & C in Figure 1 inset) but with other blood parameters that were essentially normal (46).
Acknowledgments
This work was supported by the National Institutes of Health grant Uo1 NS063732 (to JP and LLP).
Abbreviations
- Bis-Tris
Bis(2-hydroxyethyl)iminotris(hydroxymethyl)methane
- CHAPS
3[(3-Cholamidopropyl)-dimethylammonio]-propanesulfonic acid
- CHES
N-Cyclohexyl-2-aminoethanesulfonic acid
- HEPES
4-(2-Hydroxyethyl)piperazine-1-ethanesulfonic acid
- MES
2-(N-morpholino)-ethanesulfonic acid
- NHb
nitrihemoglobin
References
- 1.Kim-Shapiro DB, Gladwin MT, Patel RP, Hogg N. The reaction between nitrite and hemoglobin: the role of nitrite in hemoglobin-mediated hypoxic vasodilation. J Inorg Biochem. 2005;99:237–246. doi: 10.1016/j.jinorgbio.2004.10.034. [DOI] [PubMed] [Google Scholar]
- 2.Cosby K, Partovi KS, Crawford JH, Patel RP, Reiter CD, Martyr S, Yang BK, Waclawiw MA, Zalos G, Xu X, Huang KT, Shields H, Kim-Shapiro DB, Schechter AN, Cannon RO, 3rd, Gladwin MT. Nitrite reduction to nitric oxide by deoxyhemoglobin vasodilates the human circulation. Nature medicine. 2003;9:1498–1505. doi: 10.1038/nm954. [DOI] [PubMed] [Google Scholar]
- 3.Angelo M, Singel DJ, Stamler JS. An S-nitrosothiol (SNO) synthase function of hemoglobin that utilizes nitrite as a substrate. Proc Natl Acad Sci U S A. 2006;103:8366–8371. doi: 10.1073/pnas.0600942103. [DOI] [PMC free article] [PubMed] [Google Scholar]
- 4.Chen K, Piknova B, Pittman RN, Schechter AN, Popel AS. Nitric oxide from nitrite reduction by hemoglobin in the plasma and erythrocytes. Nitric Oxide. 2007 doi: 10.1016/j.niox.2007.09.088. [DOI] [PMC free article] [PubMed] [Google Scholar]
- 5.Raat NJ, Noguchi AC, Liu VB, Raghavachari N, Liu D, Xu X, Shiva S, Munson PJ, Gladwin MT. Dietary nitrate and nitrite modulate blood and organ nitrite and the cellular ischemic stress response. Free Radic Biol Med. 2009;47:510–517. doi: 10.1016/j.freeradbiomed.2009.05.015. [DOI] [PMC free article] [PubMed] [Google Scholar]
- 6.Toxicology and carcinogenesis studies of sodium nitrite (CAS NO. 7632-00-0) in F344/N rats and B6C3F1 mice (drinking water studies) Natl Toxicol Program Tech Rep Ser. 2001;495:7–273. [PubMed] [Google Scholar]
- 7.Tilak KS, Veeraiah K, Raju JM. Effects of ammonia, nitrite and nitrate on hemoglobin content and oxygen consumption of freshwater fish, Cyprinus carpio (Linnaeus) J Environ Biol. 2007;28:45–47. [PubMed] [Google Scholar]
- 8.Rahman MM, Kim SJ, Kim GB, Hong CU, Lee YU, Kim SZ, Kim JS, Kang HS. Nitrite-induced methemoglobinaemia affects blood ionized and total magnesium level by hydrolysis of plasma adenosine triphosphate in rat. Basic Clin Pharmacol Toxicol. 2009;105:294–300. doi: 10.1111/j.1742-7843.2009.00450.x. [DOI] [PubMed] [Google Scholar]
- 9.Timkovich R, Bondoc LL. Diversity in the structure of hemes. Advances in Biophysical Chemistry. 1990;1:203–247. [Google Scholar]
- 10.Bondoc LL, Timkovich R. Structural characterization of nitrimyoglobin. J Biol Chem. 1989;264:6134–6145. [PubMed] [Google Scholar]
- 11.Antonini E, Brunori M. Hemoglobin and myoglobin in their reactions with ligands. North-Holland; Amsterdam: 1971. Chapter 1; pp. 1–12. [Google Scholar]
- 12.Bonaventura C, Godette G, Tesh S, Holm DE, Bonaventura J, Crumbliss AL, Pearce LL, Peterson J. Internal electron transfer between hemes and Cu(II) bound at cysteine β93 promotes methemoglobin reduction by carbon monoxide. Journal of Biological Chemistry. 1999;274:5499–5507. doi: 10.1074/jbc.274.9.5499. [DOI] [PubMed] [Google Scholar]
- 13.Drabkin DL. Spectrophotometric studies. XIV. The Crystallographic and optical properties of the hemoglobin of man in comparison with those of other species. J Biol Chem. 1946;164:703–723. [PubMed] [Google Scholar]
- 14.Fago A, Crumbliss AL, Peterson J, Pearce LL, Bonaventura C. The case of the missing NO-hemoglobin: spectral changes suggestive of heme redox reactions reflect changes in NO-heme geometry. Proc Natl Acad Sci U S A. 2003;100:12087–12092. doi: 10.1073/pnas.2032603100. [DOI] [PMC free article] [PubMed] [Google Scholar]
- 15.Bartsch RG. Cytochromes: Bacterial. Methods in Enzymology. 1971;23:344–363. [Google Scholar]
- 16.Paul KG, Theorell H, Åkeson Å. The molar light absorption of pyridine ferroprotoporphyrin (pyridine haemochromogen) Acta Chemica Scandanavia. 1953;7:1284–1287. [Google Scholar]
- 17.Carraway AD, Miller GT, Pearce LL, Peterson J. The Alkaline Transition of Bis(N-acetylated) Heme Undecapeptide. Inorg Chem. 1998;37:4654–4661. doi: 10.1021/ic971391u. [DOI] [PubMed] [Google Scholar]
- 18.Peng Q, Peterson J. The use of near-infrared charge-transfer transitions of low-spin ferric chlorins in axial ligand assignment. FEBS Lett. 1994;356:159–161. doi: 10.1016/0014-5793(94)01253-9. [DOI] [PubMed] [Google Scholar]
- 19.Peng Q, Timkovich R, Loewen PC, Peterson J. Identification of heme macrocycle type by near-infrared magnetic circular dichroism spectroscopy at cryogenic temperatures. FEBS Lett. 1992;309:157–160. doi: 10.1016/0014-5793(92)81085-z. [DOI] [PubMed] [Google Scholar]
- 20.Troxler H, Neuheiser F, Kleinert P, Kuster T, Heizmann CW, Sack R, Hunziker P, Neuhaus TJ, Schmid M, Frischknecht H. Detection of a novel variant human hemoglobin by electrospray ionization mass spectrometry. Biochem Biophys Res Commun. 2002;292:1044–1047. doi: 10.1006/bbrc.2002.6762. [DOI] [PubMed] [Google Scholar]
- 21.Roberts NB, Green BN, Morris M. Potential of electrospray mass spectrometry for quantifying glycohemoglobin. Clinical chemistry. 1997;43:771–778. [PubMed] [Google Scholar]
- 22.Doyle MP, Pickering RA, Dykstra RL, Nelson CL, Boyer RF. Involvement of peroxide and superoxide in the oxidation of hemoglobin by nitrite. Biochem Biophys Res Commun. 1982;105:127–132. doi: 10.1016/s0006-291x(82)80020-x. [DOI] [PubMed] [Google Scholar]
- 23.Gladwin MT, Grubina R, Doyle MP. The new chemical biology of nitrite reactions with hemoglobin: R-state catalysis, oxidative denitrosylation, and nitrite reductase/anhydrase. Acc Chem Res. 2009;42:157–167. doi: 10.1021/ar800089j. [DOI] [PubMed] [Google Scholar]
- 24.Bondoc LL. Department of Chemistry. The University of Alabama; Tuscaloosa: 1989. The structures of unusual porphyrins and hemes: sulfmyoglobin and nitrimyoglobin; p. 261. [Google Scholar]
- 25.Gouterman M. Chapter 1: optical spectra and electronic structure of Porphyrins and related rings. In: Dolphin D, editor. The Porphyrins: Physical Chemistry: Part A. Academic Press; New York: 1978. pp. 1–165. [Google Scholar]
- 26.Beetlestone J, George P. A Magnetochemical Study of Equilibria between High and Low Spin States of Metmyoglobin Complexes. Biochemistry. 1964;3:707–714. doi: 10.1021/bi00893a019. [DOI] [PubMed] [Google Scholar]
- 27.Peisach J, Blumberg WE, Ogawa S, Rachmilewitz EA, Oltzik R. The effects of protein conformation on the heme symmetry in high spin ferric heme proteins as studied by electron paramagnetic resonance. J Biol Chem. 1971;246:3342–3355. [PubMed] [Google Scholar]
- 28.Young LJ, Siegel LM. On the reaction of ferric heme proteins with nitrite and sulfite. Biochemistry. 1988;27:2790–2800. doi: 10.1021/bi00408a020. [DOI] [PubMed] [Google Scholar]
- 29.Svistunenko DA, Sharpe MA, Nicholls P, Wilson MT, Cooper CE. A new method for quantitation of spin concentration by EPR spectroscopy: application to methemoglobin and metmyoglobin. J Magn Reson. 2000;142:266–275. doi: 10.1006/jmre.1999.1935. [DOI] [PubMed] [Google Scholar]
- 30.Fago A, Hundahl C, Malte H, Weber RE. Functional properties of neuroglobin and cytoglobin. Insights into the ancestral physiological roles of globins. IUBMB life. 2004;56:689–696. doi: 10.1080/15216540500037299. [DOI] [PubMed] [Google Scholar]
- 31.Hille R, Olson JS, Palmer G. Spectral transitions of nitrosyl hemes during ligand binding to hemoglobin. J Biol Chem. 1979;254:12110–12120. [PubMed] [Google Scholar]
- 32.Benesch R, Benesch RE. The effect of organic phosphates from the human erythrocyte on the allosteric properties of hemoglobin. Biochem Biophys Res Commun. 1967;26:162–167. doi: 10.1016/0006-291x(67)90228-8. [DOI] [PubMed] [Google Scholar]
- 33.Carrico RJ, Blumberg WE, Peisach J. The reversible binding of oxygen to sulfhemoglobin. J Biol Chem. 1978;253:7212–7215. [PubMed] [Google Scholar]
- 34.Park CM, Nagel RL, Blumberg WE, Peisach J, Magliozzo RS. Sulfhemoglobin. Properties of partially sulfurated tetramers. J Biol Chem. 1986;261:8805–8810. [PubMed] [Google Scholar]
- 35.Everse J, Grisham MB. Prooxidant activity of hemoglobin and myoglobin. In: Everse J, Everse KE, Grisham MB, editors. Peroxidases in chemistry and biology. CRC Press; Boca Raton: 1991. pp. 335–344. [Google Scholar]
- 36.Everse J, Johnson MC, Marini MA. Peroxidatic activities of hemoglobin and hemoglobin derivatives. Methods in Enzymology. 1994;231:547–561. doi: 10.1016/0076-6879(94)31038-6. [DOI] [PubMed] [Google Scholar]
- 37.Young JD, Dyar O, Xiong L, Howell S. Methaemoglobin production in normal adults inhaling low concentrations of nitric oxide. Intensive Care Med. 1994;20:581–584. doi: 10.1007/BF01705726. [DOI] [PubMed] [Google Scholar]
- 38.International Committee for Standardization in Haematology: Protocol for type testing equipment and apparatus used for haematological analysis. J Clin Pathol. 1978;31:275–279. doi: 10.1136/jcp.31.3.275. [DOI] [PMC free article] [PubMed] [Google Scholar]
- 39.Dejam A, Hunter CJ, Pelletier MM, Hsu LL, Machado RF, Shiva S, Power GG, Kelm M, Gladwin MT, Schechter AN. Erythrocytes are the major intravascular storage sites of nitrite in human blood. Blood. 2005;106:734–739. doi: 10.1182/blood-2005-02-0567. [DOI] [PMC free article] [PubMed] [Google Scholar]
- 40.Espey MG, Miranda KM, Feelisch M, Fukuto J, Grisham MB, Vitek MP, Wink DA. Mechanisms of cell death governed by the balance between nitrosative and oxidative stress. Ann N Y Acad Sci. 2000;899:209–221. doi: 10.1111/j.1749-6632.2000.tb06188.x. [DOI] [PubMed] [Google Scholar]
- 41.Basu S, Grubina R, Huang J, Conradie J, Huang Z, Jeffers A, Jiang A, He X, Azarov I, Seibert R, Mehta A, Patel R, King SB, Hogg N, Ghosh A, Gladwin MT, Kim-Shapiro DB. Catalytic generation of N2O3 by the concerted nitrite reductase and anhydrase activity of hemoglobin. Nature chemical biology. 2007;3:785–794. doi: 10.1038/nchembio.2007.46. [DOI] [PubMed] [Google Scholar]
- 42.Zakharov II, Zakharova OI. Nitrosonium nitrite isomer of N2O3: quantum-chemical data. Journal of Structural Chemistry. 2009;50:212–218. [Google Scholar]
- 43.Merck & Co., I. The Merck Veterinary Manual. Merial Ltd.; Whitehouse station: 2008. [Google Scholar]
- 44.Yi J, Safo MK, Richter-Addo GB. The nitrite anion binds to human hemoglobin via the uncommon O-nitrito mode. Biochemistry. 2008;47:8247–8249. doi: 10.1021/bi801015c. [DOI] [PubMed] [Google Scholar]
- 45.Schwab DE, Stamler JS, Singel DJ. Nitrite-methemoglobin inadequate for hypoxic vasodilation. Nature chemical biology. 2009;5:366. doi: 10.1038/nchembio0609-366. [DOI] [PubMed] [Google Scholar]
- 46.Flexman AM, Del Vicario G, Schwarz SK. Dark green blood in the operating theatre. Lancet. 2007;369:1972. doi: 10.1016/S0140-6736(07)60918-0. [DOI] [PubMed] [Google Scholar]