Abstract
Copper is an essential nutrient for life, but at the same time, hyperaccumulation of this redox-active metal in biological fluids and tissues is a hallmark of pathologies such as Wilson’s and Menkes diseases, various neurodegenerative diseases, and toxic environmental exposure. Diseases characterized by copper hyperaccumulation are currently challenging to identify due to costly diagnostic tools that involve extensive technical workup. Motivated to create simple yet highly selective and sensitive diagnostic tools, we have initiated a program to develop new materials that can enable monitoring of copper levels in biological fluid samples without complex and expensive instrumentation. Herein, we report the design, synthesis, and properties of PAF-1-SMe, a robust three-dimensional porous aromatic framework (PAF) densely functionalized with thioether groups for selective capture and concentration of copper from biofluids as well as aqueous samples. PAF-1-SMe exhibits a high selectivity for copper over other biologically relevant metals, with a saturation capacity reaching over 600 mg/g. Moreover, the combination of PAF-1-SMe as a material for capture and concentration of copper from biological samples with 8-hydroxyquinoline as a colorimetric indicator affords a method for identifying aberrant elevations of copper in urine samples from mice with Wilson’s disease and also tracing exogenously added copper in serum. This divide-and-conquer sensing strategy, where functional and robust porous materials serve as molecular recognition elements that can be used to capture and concentrate analytes in conjunction with molecular indicators for signal readouts, establishes a valuable starting point for the use of porous polymeric materials in noninvasive diagnostic applications.
Introduction
Copper is an essential element for human health,1 and enzymes harness the redox activity of this metal to perform functions spanning energy generation, neurotransmitter and pigment synthesis, and epigenetic modification. On the other hand, misregulation of copper homeostasis is also connected to many diseases, including cancer,2 neurodegenerative Alzheimer’s, Parkinson’s, and Huntington’s diseases,3 and genetic disorders such as Menkes and Wilson’s diseases.4 Technologies that can monitor copper homeostasis may therefore serve as valuable diagnostic tools for these diseases and related conditions. In one example of a copper-mediated disorder, Wilson’s disease is caused by mutation of the gene that encodes the copper transporter ATP7B protein. Mutations in this protein may lead to hyperaccumulation of copper in the liver, brain, kidney, and cornea, which can result in lipid peroxidation and corresponding liver damage as well as neurologic and psychiatric abnormalities.4−6 Patients suffering from Wilson’s disease also exhibit high urinary copper levels (>100 mg/day, compared to 20–40 mg/day in healthy individuals) and increased serum free copper levels (>25 μg/dL, compared to 11–25 μg/dL in healthy individuals).4 The source of this elevated copper is not sufficiently understood, but it is thought to derive from necrosis of damaged liver cells that are cleared through the bloodstream.5
Wilson’s disease is potentially fatal, although it is readily treated if diagnosed early in its development and before extensive tissue damage has occurred. Recognizing Wilson’s disease is a challenge, however, owing to a lack of targeted and readily implemented diagnostic tools. Magnetic resonance imaging (MRI) and electroencephalography (EEG) are two noninvasive techniques currently used to aid in Wilson’s diagnosis; however, these techniques are not specific for Wilson’s disease and instead serve primarily to identify secondary characteristics. While genetic tests can offer highly accurate diagnoses, over 300 different mutations for Wilson’s disease are listed in the Human Genome Organization database and only a few are fully characterized or widespread. Thus, genetic tests based on selected exons are not globally applicable.7 In contrast, noninvasive tests on biofluids such as urine and blood can alternatively provide an accurate diagnosis. These methods, however, can require cumbersome extraction procedures that include the concentration of urine collected over 24 h or acid digestion of serum. Expensive characterization methods such as inductively coupled plasma mass spectrometry (ICP-MS) or atomic absorption spectroscopy (AAS) are then used for direct copper detection.6−9
We therefore envisioned an alternative approach that would enable copper detection and readout of corresponding levels directly from biofluids as well as environmental samples in a colorimetric assay, thereby circumventing extensive sample processing. This strategy relies on the utilization of solid-state adsorbents to capture copper selectively and efficiently from the biosample of interest, followed by treatment with a colorimetric agent to quantify copper levels. We anticipate that such a divide-and-conquer approach should be broadly applicable to the detection of many biological and environmental analytes. In this context, porous polymers represent a promising class of such adsorbents for this purpose, owing to their high thermal and chemical stability, particularly to aqueous media, as well as high surface area, permanent porosity, and diversity of functional groups.10−15 The canonical material PAF-1 (PAF = porous aromatic framework) in particular exhibits a high Brunauer–Emmett–Teller (BET) surface area of up to 5600 m2/g14 and is readily modified postsynthetically to introduce a variety of desired chemical functionalities in a dense and accessible manner.15 Indeed, an elegant thiol (−SH) functionalized PAF-1 was recently reported as an effective and efficient platform for the capture of the toxic heavy metal mercury in water treatment.16
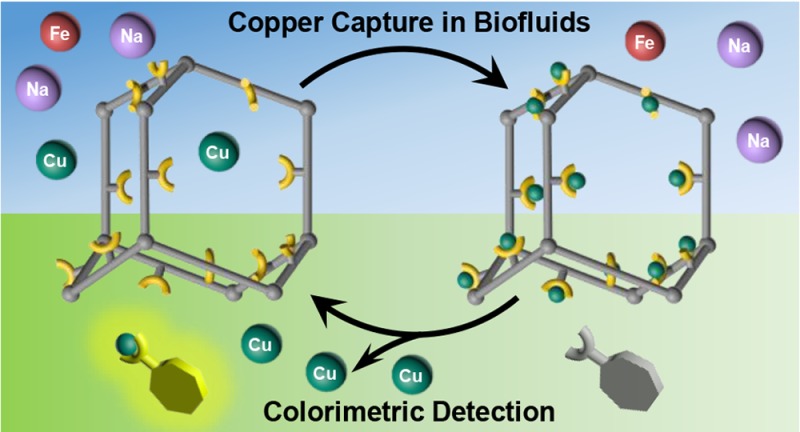
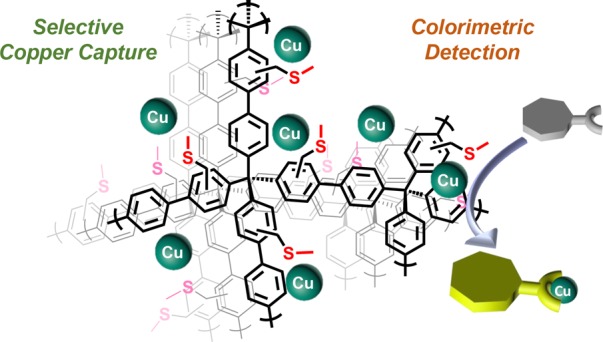
We sought to prepare a new PAF-1 analogue with copper-selective appendages to allow for specific and sensitive capture of this naturally occurring biological metal from biofluid samples. Inspection of copper binding sites in cytosolic metalloregulatory proteins shows that they are dominated by histidine, cysteine, and methionine residues,17 which feature −NH, −SH, and thioether (−SMe) functionalities, respectively. We reasoned that thioethers are less redox-active and pH-independent compared to their thiol counterparts and are also advantageous over nitrogen-containing binding moieties, such as histidine, to achieve high copper selectivity over other biologically relevant cations like iron(II) and zinc(II). Indeed, our laboratory has previously reported synthetic fluorescent18,19 and MRI copper probes20,21 with thioether-rich receptors, which revealed high selectivity toward copper ions in biological samples from cells to tissues to whole organisms. We now report the thioether-functionalized solid-state porous polymer PAF-1-SMe, a new adsorbent that is selective for the capture and concentration of copper from complex biofluid samples. In conjunction with a colorimetric reagent for assessing copper levels, we further demonstrate that PAF-1-SMe can be used in an assay to selectively adsorb copper and detect elevated copper levels in biosamples (Scheme 1). This work establishes the potential utility of porous polymeric materials for noninvasive diagnostic applications, without the need for extensive sample processing or complex and expensive instrumentation.
Scheme 1. Copper Detection Assay with PAF-1-SMe as a Selective Copper Capture Material Coupled to a Colorimetric Indicator for Detection and Regeneration.
Results and Discussion
Synthesis and Characterization
The parent material PAF-1 was synthesized following a procedure reported in the literature,14 and chloromethylation of the phenyl rings of PAF-116 followed by treatment with NaSMe afforded the final PAF-1-SMe product (Scheme 2). Infrared spectroscopy revealed the successful formation of PAF-1-SMe, as evidenced by the disappearance of the peak corresponding to the C–H wagging mode of the −CH2Cl group at 1270 cm–1 in PAF-1-CH2Cl (Figure S1). Elemental analysis also revealed a decrease in chlorine content from 13.6% in PAF-1-CH2Cl to 0.5% in the thioether-functionalized material, further supporting a successful transformation. The sulfur content in PAF-1-SMe was determined to be 9.6 ± 1.3% via elemental analysis, providing further evidence for efficient thioether formation from the chloromethyl starting material. Finally, solid-state 1H–13C cross-polarization magic angle spinning (CP/MAS) NMR spectroscopy (Figure 1a) monitored distinct 13C chemical shifts associated with the PAF-1-CH2Cl synthetic intermediate (43 ppm for the −CH2Cl group) and the final PAF-1-SMe product (35 and 13 ppm for the −CH2SCH3 group), further confirming successful incorporation of −SMe groups.
Scheme 2. Synthesis of PAF-1-SMe.

Figure 1.

(a) Solid-state 13C NMR spectra of PAF-1-CH2Cl and PAF-1-SMe and (b) N2 sorption isotherms of PAF-1, PAF-1-CH2Cl, and PAF-1-SMe at 77 K. Closed and open symbols represent adsorption and desorption branches, respectively.
In order to reveal the copper coordination in thioether groups, additional solid-state 13C NMR experiments were performed. Indeed, we observed that addition of copper to the PAF-1-SMe material specifically broadened and decreased the intensities of peaks assigned to the thioether ligands and benzyl ring, which can be interpreted as copper being in proximity to these functionalities. Furthermore, data from EPR experiments provided a separate line of evidence for interaction between copper and thioether groups (Figure S2).
Nitrogen adsorption isotherms collected at 77 K (Figure 1b) revealed that PAF-1-SMe retained permanent porosity with a high BET surface area of 1080 m2/g, albeit smaller than the parent PAF-1 surface area of 3510 m2/g. The pore size distributions obtained from the adsorption isotherms were also in agreement with the incorporation of −CH2SMe groups. Indeed, while PAF-1 exhibited a uniform pore size distribution centered around 12 Å, PAF-1-SMe exhibited pore width maxima located at 6 and 9 Å (Figure S3c). To the best of our knowledge, PAF-1-SMe possesses the highest surface area of any thioether-modified porous material, including mesoporous materials (∼979 m2/g),22 organosilicas (15–260 m2/g),23 metal–organic frameworks (∼618 m2/g),24 silsesquioxane aerogels (90–272 m2/g),25 and a thioether-based fluorescent covalent organic framework (454 m2/g).26 Although we note elegant work that shows that high surface area is not a strict prerequisite for high performance,27 the relatively high surface area and permanent porosity of PAF-1-SMe are both good indicators of the accessibility of the thioether groups within the polymeric network.
Copper Uptake, Kinetics, and Selectivity
After confirming the porosity and structural integrity of PAF-1-SMe upon postsynthetic modification, we examined its ability to capture copper ions from aqueous solution. The distribution coefficient, Kd, was measured with 4 ppm copper in HEPES buffer at pH 6.7 and found (1.3 ± 0.2) × 105 mL/g, indicating a high copper selectivity and a more than 10-fold improvement over the best copper adsorbent materials reported to date (1.2 × 10⁴ mL/g).28 Time-course adsorption measurements further indicated that copper capture by PAF-1-SMe is kinetically efficient (Figure S7), with a pseudo-second-order adsorption rate constant of 5.2 mg/mg·min that reaches equilibrium capacity within ∼30 min.
We assessed the overall capacity of PAF-1-SMe for copper from fitting of adsorption isotherms collected after equilibrating the polymer with a wide range of copper levels (1 ppb–800 ppm, Figure 2a). The best fit to the experimental data utilized a dual-site Langmuir model29 with a strong adsorption site (saturation capacity of 67 mg/g) and a weak adsorption site (saturation capacity of 662 mg/g). The strong adsorption site was correlated with the thioether groups within the framework, and this assignment is supported by comparing copper adsorption in PAF-1-CH2Cl and PAF-1-SMe up to ∼10 ppm (Figure 2a, inset). For the low concentrations most relevant to diagnostic copper capture in biofluids, PAF-1-SMe displayed a much steeper uptake than PAF-1-CH2Cl, and this enhanced uptake notably persisted for higher copper concentrations (35 mg/g at 740 ppm). By comparison, PAF-1-CH2Cl showed higher uptake (∼30-fold) in the range 3 ppb–740 ppm, providing evidence for the presence of copper ions trapped within the pores and/or adsorption at weaker binding sites in PAF-1-SMe. We note that the experimental saturation capacities for PAF-1-SMe were higher than predicted on the basis of the calculated thioether density, and thus, it is likely that each sulfur atom is capable of coordinating more than one copper ion. A similar observation was made with regard to sulfur-functionalized mesoporous carbons.30 Notably, the total saturation capacity exhibited by PAF-1-SMe is higher than all previously reported copper adsorbents, including cellulose resin modified with sodium metaperiodate and hydroxamic acid groups (∼246 mg/g),31 zeolites, biomass and lignin-derived adsorbents (5.1–133.4 mg/g),32 silica–polyamine composite resins (∼80 mg/g),33 and silica-based polymers (0.5–147 mg/g).34 More interestingly, the comparison of PAF-1-SMe to a commercially available thiol functionalized resin (Duolite GT-73) provided us valuable information on the highly accessible nature of −CH2SMe groups in PAF-1-SMe. This resin, featuring a higher loading of thiol groups (sulfur content of 16%), yet a much lower surface area (50 m2/g), was reported35 to have a copper uptake of 25 mg/g at an equilibrium concentration of 160 ppm. Such a striking difference in uptake capacities underlines the importance of functional group accessibility, which is likely enabled by the highly porous nature of PAF-1-SMe.
Figure 2.
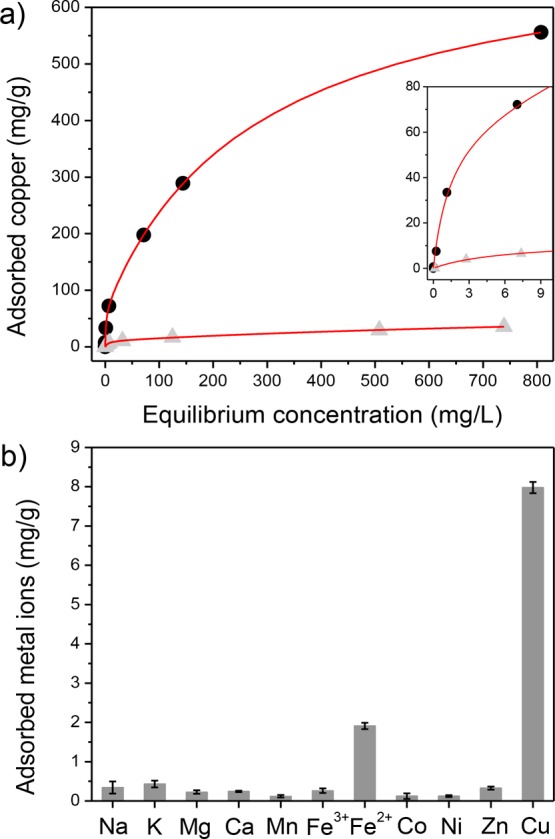
(a) Copper adsorption isotherm for PAF-1-SMe (black circles) and PAF-1-CH2Cl (gray triangles) fit using a dual-site Langmuir model (red line). The inset plot is a magnified portion of the initial equilibrium concentration range (0–10 mg/L) and the adsorbed amount of copper (mg/g). (b) PAF-1-SMe capture capacities of physiologically relevant metal ions (10 ppm). Data collected in 100 mM HEPES buffer, pH 6.7.
Most importantly, PAF-1-SMe shows high selectivity for copper over other biologically relevant metal ions with minor background from only iron(II) (Figure 2b). Moreover, a direct competition assay revealed that PAF-1-SMe binds copper(II) much more strongly than iron(II) (Figure S12), suggesting its potential utility for selective copper capture in biological and environmental samples.
Copper Capture and Detection in Biofluids
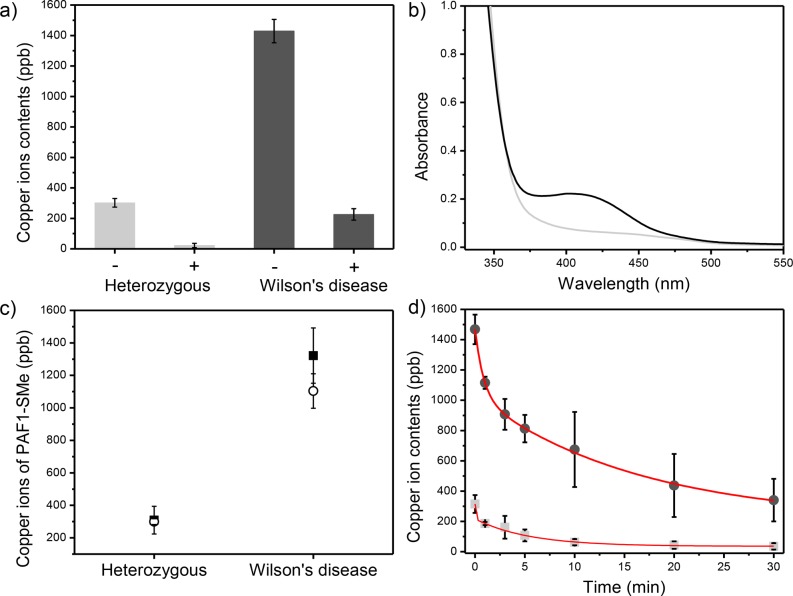
After demonstrating the ability of PAF-1-SMe to capture copper with good affinity and selectivity in aqueous buffer, we examined its performance in biofluid samples, with specific application as part of a potential diagnostic tool for Wilson’s disease. Initial ICP-MS characterization of urine samples from 14-week-old Wilson’s disease and healthy heterozygous control mice revealed a much greater urine copper level for the disease model (1420 ppb versus 295 ppb Cu, respectively, Figure 3a).36 The urine samples were accordingly treated with PAF-1-SMe, which resulted in successful capture of 1195 ppb copper from the Wilson’s disease mice compared to 269 ppb for the control sample (capture efficiencies of 84 and 91%, respectively, Figure 3a). Thus, PAF-1-SMe is capable of extracting copper directly from biofluid samples and importantly distinguishing between healthy and diseased mouse models.
Figure 3.
(a) Urine samples (1 mL) from 14-week-old heterozygous (light gray bars) and Wilson’s disease (dark gray bars) mice analyzed by ICP-MS before (−) and after (+) exposure to 2 mg of PAF-1-SMe. (b) Absorption spectra after 8-hydroxyquinoline addition to dried PAF-1-SMe with DMSO washes applied to heterozygous (light gray) and Wilson’s disease (dark gray) urine specimens. (c) Correlation between direct copper measurements by ICP-MS (open circles) versus calculated copper levels from 410 nm light absorption using 8-hydroxyquinoline as an indicator (black filled squares). (d) Real time copper uptake of PAF-1-SMe in the urine samples of heterozygous (light gray) and Wilson’s disease mice (dark gray) measured at 1, 3, 5, 10, 20, and 30 min intervals and fitted with the double exponential decay model: y = A1 exp(−x/t1) + A2 exp(−x/t2); ⟨τWilson’s disease⟩ = 15.9 min and ⟨τHeterozygous⟩ = 5.4 min (red lines).
As further improvement of this diagnostic, we sought to identify the adsorbed copper concentration using a colorimetric agent, thus obviating the need for expensive ICP-MS or related instrumentation. We chose to apply 8-hydroxyquinoline (8-HQ), which undergoes a distinct color change upon copper binding from colorless (315 nm absorption, ε = 1.95 × 10³ M–1 cm–1) to green (410 nm absorption, ε = 1.86 × 10³ M–1 cm–1) by formation of a Cu(II)–8-HQ complex.37 To examine whether 8-HQ could bind copper captured within PAF-1-SMe, a solution of 8-HQ in DMSO was added to dried samples of PAF-1-SMe that had been exposed to urine from Wilson’s disease or healthy control mice. Indeed, PAF-1-SMe copper capture from unprocessed urine samples followed by treatment with 8-HQ led to a visible change in the absorbance at 410 nm for the Wilson’s disease murine models, which was sufficient to distinguish them from the heterozygous mice (Figure 3b). Calculation of the amount of copper adsorbed by PAF-1-SMe using the 410 nm absorbance peak as a standard also provided a good correlation with direct copper measurements by ICP-MS (Figure 3c). Furthermore, PAF-1-SMe adsorbed copper completely from the urine of heterozygous and Wilson’s disease mice in ∼30 min and showed substantially different uptake in as little as 1 min (Figure 3d), suggesting that these materials can be employed at shorter time scales.
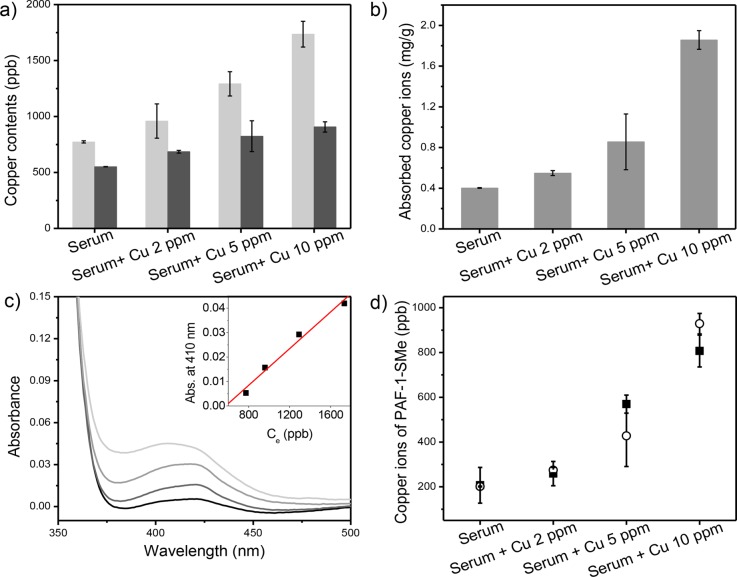
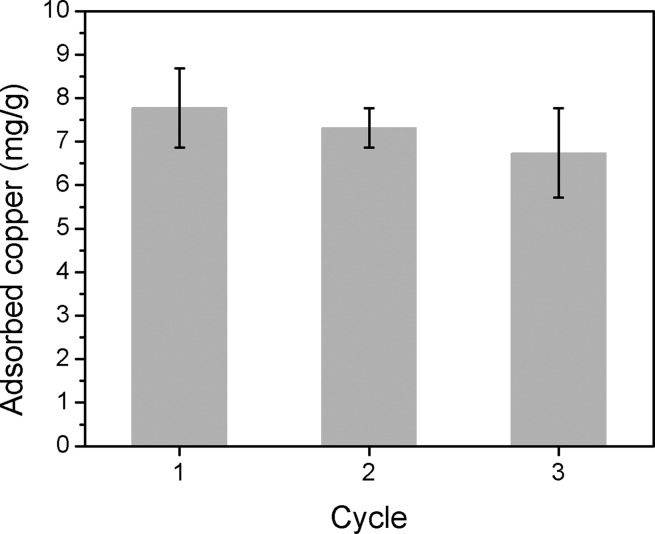
Finally, we evaluated the performance of PAF-1-SMe for the detection of copper in serum, which is notably a more complex biofluid compared to urine with iron concentrations approximately 5 times greater than that of copper.38 We used porcine serum sources owing to limitations in obtaining sufficient amounts of murine specimens required for this first-generation assay. Exogenous copper was added to the samples to simulate elevated serum free copper levels observed in patients with Wilson’s disease.6,7 Although we observed that PAF-1-SMe could preferentially bind copper over iron(II), it also absorbed a significant amount of iron in unprocessed serum. This iron uptake disturbed the subsequent colorimetric assay with 8-HQ due to an interfering signal from the Fe(II)–8-HQ complex (Figure S13). To reduce iron interference, we pretreated the serum sample with acetohydroxamic acid (AHA), a high-affinity iron chelator that shows little interaction with copper.39 Indeed, PAF-1-SMe shows dose-dependent copper capture for exogenous copper addition over a range of 0–10 ppm (Figure 4a,b). Analogous to the urine sample results, with AHA pretreatment, 8-HQ can serve as a colorimetric indicator when coupled with PAF-1-SMe for direct copper capture from serum, and the 8-HQ assay revealed a positive linear dependence of the absorbance at 410 nm with increasing serum copper concentration (Figure 4c, inset). As also demonstrated for the urine samples, copper levels calculated from the 410 nm absorption were in good agreement with direct ICP-MS measurements (Figure 4d). Using a three-sigma method (3σ/k), we determined that the detection limit for this PAF-1-SMe/8-HQ assay is 186 ppb in DMSO, 552 ppb in urine, and 756 ppb in serum (Figure S16). On balance, we note that AHA pretreatment does add an extra step to the protocol for serum compared to urine, but this methodology still avoids expensive instrumentation and sample processing. Indeed, this AHA pretreatment followed by application of PAF-1-SMe/8-HQ radically simplifies the traditional method of detecting copper by ICP-MS, which includes boiling in nitric acid for digestion, centrifugation, and filtration.40 Importantly, PAF-1-SMe retained its structure and porosity and maintained a high effective copper capture capacity after regeneration with 8-HQ (Figure 5 and Figure S17).
Figure 4.
(a) Porcine serum samples (4 mL) with varying amounts of exogenous copper analyzed by ICP-MS before (light gray bars) and after (black bars) addition of PAF-1-SMe. (b) Dose-dependent adsorption of copper by PAF-1-SMe from serum samples. (c) Absorption spectra after addition of 8-hydroxyquinoline to dried PAF-1-SMe with one DMSO wash applied to serum specimens with 0, 2, 5, and 10 ppm of exogenous copper. (inset) Calibration curve showing dependence of absorbance at 410 nm on initial copper concentration for each sample. (d) Comparison of direct copper measurements by ICP-MS (open circles) and calculated copper levels from absorbance at 410 nm using 8-hydroxyquinoline as an indicator (black filled squares).
Figure 5.
Comparison of copper uptake (10 ppm in 100 mM HEPES buffer, pH 6.7) by freshly synthesized PAF-1-SMe (cycle 1) with PAF-1-SMe regenerated twice by 8-hydroxyquinoline (1 mM) in DMSO (cycles 2 and 3).
Conclusions
To close, we have demonstrated that the robust thioether-functionalized porous aromatic framework, PAF-1-SMe, accomplishes selective and efficient copper uptake from aqueous media, including from biofluid samples. Further, as demonstrated by the differentiation between urine samples of healthy and Wilson’s disease mice, the combination of PAF-1-SMe with 8-HQ as a colorimetric indicator provides an efficient and accessible tool for metal detection directly from biological specimens with minimal processing and instrumentation needs. Our data provide a starting point for the use of functionalized porous materials in diagnostic or sensing applications for compatible biological, and perhaps environmental, field samples. In a broader sense, this divide-and-conquer strategy to indicator design, where one materials component is involved in capture and concentration of analytes from samples with minimal processing, while the other molecular component offers a detection readout, is readily generalized and should offer a broad range of possibilities for mixing and matching different molecular, materials, and biological components for various sensing and imaging applications.
Acknowledgments
We thank the NIH under award GM79465 for support of synthesis and biological studies in the laboratory of C.J.C. Efforts for material characterization in the laboratories of J.A.R. and J.R.L. were supported by the Center for Gas Separations Relevant to Clean Energy Technologies, an Energy Frontier Research Center funded by the U.S. Department of Energy, Office of Science, Office of Basic Energy Sciences, under Award DE-SC0001015. C.J.C. is an Investigator at the Howard Hughes Medical Institute. G.B. thanks the Miller Institute for Basic Research in Science for a postdoctoral fellowship. C.M.A. is supported by a fellowship from the Fannie and John Hertz Foundation and was also partially supported by a Chemical Biology Training Grant from the NIH (T32 GM066698). We also thank K. Colwell for scanning electron microscopy (SEM) images and Dr. Katie R. Meihaus for editorial assistance.
Supporting Information Available
The Supporting Information is available free of charge on the ACS Publications website at DOI: 10.1021/jacs.6b02515.
Experimental details including synthesis and characterization, uptake kinetics, adsorption isotherm fittings, selectivity studies, copper uptake experiments in biofluid samples, and colorimetric detection with 8-HQ (PDF)
The authors declare no competing financial interest.
Supplementary Material
References
- Lippard S. J.; Berg J. M.. Principles of Bioinorganic Chemistry; University Science Books: Mill Valley, CA, 1994. [Google Scholar]
- Brady D. C.; Crowe M. S.; Turski M. L.; Hobbs A.; Yao X.; Chaikuad A.; Knapp S.; Xia K.; Campbell S. L.; Thiele D.; Counter C. M. Nature 2014, 509, 492–496. 10.1038/nature13180. [DOI] [PMC free article] [PubMed] [Google Scholar]
- a Que E. L.; Domaille D. W.; Chang C. J. Chem. Rev. 2008, 108, 1517–1549. 10.1021/cr078203u. [DOI] [PubMed] [Google Scholar]; b Barnham K. J.; Bush A. I. Chem. Soc. Rev. 2014, 43, 6727–6749. 10.1039/C4CS00138A. [DOI] [PubMed] [Google Scholar]
- a Kaler S. G. Nat. Rev. Neurol. 2011, 7, 15–29. 10.1038/nrneurol.2010.180. [DOI] [PMC free article] [PubMed] [Google Scholar]; b Burkhead J. L.; Gray L. W.; Lutsenko S. BioMetals 2011, 24, 455–466. 10.1007/s10534-011-9430-9. [DOI] [PMC free article] [PubMed] [Google Scholar]; c Merle U.; Schaefer W.; Ferenci P.; Stremmel W. Gut 2007, 56, 115–120. 10.1136/gut.2005.087262. [DOI] [PMC free article] [PubMed] [Google Scholar]; d Huster D.; Finegold M. J.; Morgan C. T.; Burkhead J. L.; Nixon R.; Vanderwerf S. M.; Gilliam C. T.; Lusenko S. Am. J. Pathol. 2006, 168, 423–434. 10.2353/ajpath.2006.050312. [DOI] [PMC free article] [PubMed] [Google Scholar]
- a Ridge P. G.; Zhang Y.; Gladyshev V. N. PLoS One 2008, 3, e1378. 10.1371/journal.pone.0001378. [DOI] [PMC free article] [PubMed] [Google Scholar]; b Boal A. K.; Rosenzweig A. C. Chem. Rev. 2009, 109, 4760–4779. 10.1021/cr900104z. [DOI] [PMC free article] [PubMed] [Google Scholar]
- Brewer G. J.Wilson’s disease A Clinician’s Guide to Recognition, Diagnosis, and Management; Springer Science + Business Media: New York, 2001, Print. [Google Scholar]
- a Huster D. Best Practice & Research Clinical Gastroenterology 2010, 24, 531–539. 10.1016/j.bpg.2010.07.014. [DOI] [PubMed] [Google Scholar]; b Ala A.; Walker A. P.; Ashkan K.; Dooley J. S.; Schisky M. L. Lancet 2007, 369, 397–408. 10.1016/S0140-6736(07)60196-2. [DOI] [PubMed] [Google Scholar]; c Ferenci P. Hum. Genet. 2006, 120, 151–159. 10.1007/s00439-006-0202-5. [DOI] [PubMed] [Google Scholar]; d Bandmann O.; Weiss K. H.; Kaler S. G. Lancet Neurol. 2015, 14, 103–113. 10.1016/S1474-4422(14)70190-5. [DOI] [PMC free article] [PubMed] [Google Scholar]
- Orena S. J.; Goode C. A.; Linder M. C. Biochem. Biophys. Res. Commun. 1986, 139, 822–829. 10.1016/S0006-291X(86)80064-X. [DOI] [PubMed] [Google Scholar]
- Walshe J. M. QJM 2011, 104, 775–778. 10.1093/qjmed/hcr073. [DOI] [PubMed] [Google Scholar]
- a Côte A. P.; Benin A. I.; Ockwig N. W.; O’Keeffe M.; Matzger A. J.; Yaghi O. M. Science 2005, 310, 1166–1170. 10.1126/science.1120411. [DOI] [PubMed] [Google Scholar]; b Jiang J.-X.; Su F.; Trewin A.; Wood C. D.; Campbell N. L.; Niu H.; Dickinson C.; Ganin A. Y.; Rosseinsky M. J.; Khimyak Y. Z.; Cooper A. I. Angew. Chem., Int. Ed. 2007, 46, 8574–8578. 10.1002/anie.200701595. [DOI] [PubMed] [Google Scholar]; c Dogru M.; Bein T. Nat. Nanotechnol. 2011, 6, 333–335. 10.1038/nnano.2011.86. [DOI] [PubMed] [Google Scholar]; d Colson J. W.; Woll A. R.; Mukherjee A.; Levendork M. P.; Spitler E. L.; Shields V. B.; Spencer M. G.; Park J.; Dichtel W. R. Science 2011, 332, 228–231. 10.1126/science.1202747. [DOI] [PubMed] [Google Scholar]; e Chandra S.; Kundu T.; Kandambeth S.; BabaRao R.; Marathe Y.; Kunjir S. M.; Banerjee R. J. Am. Chem. Soc. 2014, 136, 6570–6573. 10.1021/ja502212v. [DOI] [PubMed] [Google Scholar]
- a Ding S.-Y.; Wang W. Chem. Soc. Rev. 2013, 42, 548–568. 10.1039/C2CS35072F. [DOI] [PubMed] [Google Scholar]; b Feng X.; Ding X.; Jiang D. Chem. Soc. Rev. 2012, 41, 6010–6022. 10.1039/c2cs35157a. [DOI] [PubMed] [Google Scholar]
- a Li H.; Eddaoudi M.; O’Keeffe M.; Yaghi O. M. Nature 1999, 402, 276–279. 10.1038/46248. [DOI] [Google Scholar]; b Kondo M.; Yoshitomi T.; Seki K.; Matsuzaka H.; Kitagawa S. Angew. Chem., Int. Ed. Engl. 1997, 36, 1725–1727. 10.1002/anie.199717251. [DOI] [Google Scholar]; c Eddaoudi M.; Kim J.; Rosi N.; Vodak D.; Wachter J.; O’Keeffe M.; Yaghi O. M. Science 2002, 295, 469–472. 10.1126/science.1067208. [DOI] [PubMed] [Google Scholar]
- a Zhou H.-C.; Kitagawa S. Chem. Soc. Rev. 2014, 43, 5415–5418. 10.1039/C4CS90059F. [DOI] [PubMed] [Google Scholar]; b Sumida K.; Rogow D. L.; Mason J. A.; McDonald T. M.; Bloch E. D.; Herm Z. R.; Bae T.-H.; Long J. R. Chem. Rev. 2012, 112, 724–781. 10.1021/cr2003272. [DOI] [PubMed] [Google Scholar]; c Li J.-R.; Kuppler R. J.; Zhou H.-C. Chem. Soc. Rev. 2009, 38, 1477–1504. 10.1039/b802426j. [DOI] [PubMed] [Google Scholar]; d Lee J. Y.; Farha O. K.; Roberts J.; Scheidt K. A.; Nguyen S. T.; Hupp S. T. Chem. Soc. Rev. 2009, 38, 1450–1459. 10.1039/b807080f. [DOI] [PubMed] [Google Scholar]
- a Ben T.; Ren H.; Ma S.; Cao D.; Lan J.; Jing X.; Wang W.; Xu J.; Deng F.; Simmons J. M.; Qiu S.; Zhu G. Angew. Chem., Int. Ed. 2009, 48, 9457–9460. 10.1002/anie.200904637. [DOI] [PubMed] [Google Scholar]; b Ben T.; Qiu S. CrystEngComm 2013, 15, 17–26. 10.1039/C2CE25409C. [DOI] [Google Scholar]
- a Lu W.; Yuan D.; Sculley J.; Zhao D.; Krishna R.; Zhou H.-C. J. Am. Chem. Soc. 2011, 133, 18126–18129. 10.1021/ja2087773. [DOI] [PubMed] [Google Scholar]; b Lu W.; Sculley J. P.; Yuan D.; Krishna R.; Wei Z.; Zhou H.-C. Angew. Chem., Int. Ed. 2012, 51, 7480–7484. 10.1002/anie.201202176. [DOI] [PubMed] [Google Scholar]; c Konstas K.; Taylor J. W.; Thornton A. W.; Doherty C. M.; Lim W. X.; Bastow T. J.; Kennedy D. F.; Wood C. D.; Cox B. J.; Hill J. M.; Hill A. J.; Hill M. R. Angew. Chem., Int. Ed. 2012, 51, 6639–6642. 10.1002/anie.201201381. [DOI] [PubMed] [Google Scholar]; d Ma H.; Ren H.; Zou X.; Meng S.; Sun F.; Zhu G. Polym. Chem. 2014, 5, 144–152. 10.1039/C3PY00647F. [DOI] [Google Scholar]; e Van Humbeck J. F.; McDonald T. M.; Jing X.; Wiers B. M.; Zhu G.; Long J. R. J. Am. Chem. Soc. 2014, 136, 2432–2440. 10.1021/ja4105478. [DOI] [PubMed] [Google Scholar]; f Lau C. H.; Konstas K.; Doherty C. M.; Kanehashi S.; Ozcelik B.; Kentish S. E.; Hill A. J.; Hill M. R. Chem. Mater. 2015, 27, 4756–4762. 10.1021/acs.chemmater.5b01537. [DOI] [Google Scholar]; g Li B.; Zhang Y.; Krishna R.; Yao K.; Han Y.; Wu Z.; Ma D.; Shi Z.; Pham T.; Space B.; Liu J.; Thallapally P. K.; Liu J.; Chrzanowski M.; Ma S. J. Am. Chem. Soc. 2014, 136, 8654–8660. 10.1021/ja502119z. [DOI] [PubMed] [Google Scholar]; h Li B.; Zhang Y.; Ma D.; Xing Z.; Ma T.; Shi Z.; Ji X.; Ma S. Chem. Sci. 2016, 7, 2138–2144. 10.1039/C5SC04507J. [DOI] [PMC free article] [PubMed] [Google Scholar]
- Li B.; Zhang Y.; Ma D.; Shi Z.; Ma S. Nat. Commun. 2014, 5, 5537–5543. 10.1038/ncomms6537. [DOI] [PubMed] [Google Scholar]
- a Davis A. V.; O’Halloran T. V. Nat. Chem. Biol. 2008, 4, 148–151. 10.1038/nchembio0308-148. [DOI] [PMC free article] [PubMed] [Google Scholar]; b Bernardo M. M.; Heeg M. J.; Schroeder R. R.; Ochrymowycz L. A.; Rorabacher D. B. Inorg. Chem. 1992, 31, 191–198. 10.1021/ic00028a013. [DOI] [Google Scholar]
- a Aron A. T.; Ramos-Torres K. M.; Cotruvo J. A. Jr.; Chang C. J. Acc. Chem. Res. 2015, 48, 2434–2442. 10.1021/acs.accounts.5b00221. [DOI] [PMC free article] [PubMed] [Google Scholar]; b Cotruvo J. A. Jr.; Aron A. T.; Ramos-Torres K. M.; Chang C. J. Chem. Soc. Rev. 2015, 44, 4400–4414. 10.1039/C4CS00346B. [DOI] [PMC free article] [PubMed] [Google Scholar]; c Domaille D. W.; Que E. L.; Chang C. J. Nat. Chem. Biol. 2008, 4, 168–175. 10.1038/nchembio.69. [DOI] [PubMed] [Google Scholar]
- a Zeng L.; Miller E. W.; Pralle A.; Isacoff E. Y.; Chang C. J. J. Am. Chem. Soc. 2006, 128, 10–11. 10.1021/ja055064u. [DOI] [PMC free article] [PubMed] [Google Scholar]; b Miller E. W.; Zeng L.; Domaille D. W.; Chang C. J. Nat. Protoc. 2006, 1, 824–827. 10.1038/nprot.2006.140. [DOI] [PubMed] [Google Scholar]; c Domaille D. W.; Zeng L.; Chang C. J. J. Am. Chem. Soc. 2010, 132, 1194–1195. 10.1021/ja907778b. [DOI] [PMC free article] [PubMed] [Google Scholar]; d Dodani S. C.; Domaille D. W.; Nam C. I.; Miller E. W.; Finney L. A.; Vogt S.; Chang C. J. Proc. Natl. Acad. Sci. U. S. A. 2011, 108, 5980–5985. 10.1073/pnas.1009932108. [DOI] [PMC free article] [PubMed] [Google Scholar]; e Dodani S. C.; Leary S. C.; Cobine P. A.; Winge D. R.; Chang C. J. J. Am. Chem. Soc. 2011, 133, 8606–8616. 10.1021/ja2004158. [DOI] [PMC free article] [PubMed] [Google Scholar]; f Hirayama T.; Van de Bittner G. C.; Gray L. W.; Lutsenko S.; Chang C. J. Proc. Natl. Acad. Sci. U. S. A. 2012, 109, 2228–2233. 10.1073/pnas.1113729109. [DOI] [PMC free article] [PubMed] [Google Scholar]; g Dodani S. C.; Firl A.; Chan J.; Nam C. I.; Aron A. T.; Onak C. S.; Ramos-Torres K. M.; Paek J.; Webster C. W.; Feller M. B.; Chang C. J. Proc. Natl. Acad. Sci. U. S. A. 2014, 111, 16280–16285. 10.1073/pnas.1409796111. [DOI] [PMC free article] [PubMed] [Google Scholar]; h Hong-Hermesdorf A.; Miethke M.; Gallaher S. D.; Kropat J.; Dodani S. C.; Chan J.; Barupala D.; Domaille D. W.; Shirasaki D. I.; Loo J. A.; Weber P. K.; Pett-Ridge J.; Stemmler T. L.; Chang C. J. Nat. Chem. Biol. 2014, 10, 1034–1042. 10.1038/nchembio.1662. [DOI] [PMC free article] [PubMed] [Google Scholar]
- Que E. L.; Chang C. J. Chem. Soc. Rev. 2010, 39, 51–60. 10.1039/B914348N. [DOI] [PubMed] [Google Scholar]
- a Que E. L.; Chang C. J. J. Am. Chem. Soc. 2006, 128, 15942–15943. 10.1021/ja065264l. [DOI] [PubMed] [Google Scholar]; b Que E. L.; Gianolio E.; Baker S. L.; Wong A. P.; Aime S.; Chang C. J. J. Am. Chem. Soc. 2009, 131, 8527–8536. 10.1021/ja900884j. [DOI] [PubMed] [Google Scholar]; c Que E. L.; Gianolio E.; Baker S. L.; Aime S.; Chang C. J. Dalton Trans. 2010, 39, 469–476. 10.1039/B916931H. [DOI] [PubMed] [Google Scholar]; d Que E. L.; New E. J.; Chang C. J. Chem. Sci. 2012, 3, 1829–1834. 10.1039/c2sc20273e. [DOI] [PMC free article] [PubMed] [Google Scholar]
- Liu J.; Yang J.; Yang Q.; Wang G.; Li Y. Adv. Funct. Mater. 2005, 15, 1297–1302. 10.1002/adfm.200500122. [DOI] [Google Scholar]
- Kim J. H.; Fang B.; Song M. Y.; Yu J.-S. Chem. Mater. 2012, 24, 2256–2264. 10.1021/cm203520a. [DOI] [Google Scholar]
- He J.; Zha M.; Cui J.; Zeller M.; Hunter A. D.; Yiu S.-M.; Lee S.-T.; Xu Z. J. Am. Chem. Soc. 2013, 135, 7807–7810. 10.1021/ja401479j. [DOI] [PubMed] [Google Scholar]
- Wang Z.; Wang D.; Qian Z.; Guo J.; Dong H.; Zhao N.; Xu J. ACS Appl. Mater. Interfaces 2015, 7, 2016–2024. 10.1021/am5077765. [DOI] [PubMed] [Google Scholar]
- Ding S.-Y.; Dong M.; Wang Y.-W.; Chen Y.-T.; Wang H.-Z.; Su C.-Y.; Wang W. J. Am. Chem. Soc. 2016, 138, 3031–3037. 10.1021/jacs.5b10754. [DOI] [PubMed] [Google Scholar]
- Alsbaiee A.; Smith B. J.; Xiao L.; Ling Y.; Helbling D. E.; Dichtel W. R. Nature 2016, 529, 190–194. 10.1038/nature16185. [DOI] [PubMed] [Google Scholar]
- a Burleigh M. C.; Dai S.; Barnes C. E.; Xue Z. L. Sep. Sci. Technol. 2001, 36, 3395–3409. 10.1081/SS-100107910. [DOI] [Google Scholar]; b Ebraheem K. A. K.; Hamdi S. T. React. Funct. Polym. 1997, 34, 5–10. 10.1016/S1381-5148(97)00077-1. [DOI] [Google Scholar]
- Mason J. A.; Sumida K.; Herm Z. R.; Krishna R.; Long J. R. Energy Environ. Sci. 2011, 4, 3030–3040. 10.1039/c1ee01720a. [DOI] [Google Scholar]
- Shin Y.; Fryxell G. E.; Um W.; Parker K.; Mattigod S. V.; Skaggs R. Adv. Funct. Mater. 2007, 17, 2897–2901. 10.1002/adfm.200601230. [DOI] [Google Scholar]
- O’Connell D. W.; Birkinshaw C.; O’Dwyer T. F. Bioresour. Technol. 2008, 99, 6709–6724. 10.1016/j.biortech.2008.01.036. [DOI] [PubMed] [Google Scholar]
- a Perić J.; Trgo M.; Vukojević Medvidović N. Water Res. 2004, 38, 1893–1899. 10.1016/j.watres.2003.12.035. [DOI] [PubMed] [Google Scholar]; b Feng D.; van Deventer J. S. J.; Aldrich C. Sep. Purif. Technol. 2004, 40, 61–67. 10.1016/j.seppur.2004.01.003. [DOI] [Google Scholar]; c Say R.; Denizli A.; Yakup Arica M. Biores. Technol. 2005, 23, 313–322. [Google Scholar]; d Bayramoğlu G.; Bektaş S.; Arica M. Y. J. Hazard. Mater. 2003, 101, 285–300. 10.1016/S0304-3894(03)00178-X. [DOI] [PubMed] [Google Scholar]
- Beatty S. T.; Fischer R. J.; Hagers D. L.; Rosenberg E. Ind. Eng. Chem. Res. 1999, 38, 4402–4408. 10.1021/ie9903386. [DOI] [Google Scholar]
- Kumar G. P.; Kumar P. A.; Chakraborty S.; Ray M. Sep. Purif. Technol. 2007, 57, 47–56. 10.1016/j.seppur.2007.03.003. [DOI] [Google Scholar]
- Saha B.; Iglesias M.; Dimming I. W.; Streat M. Solvent Extr. Ion Exch. 2000, 18, 133–167. 10.1080/07366290008934676. [DOI] [Google Scholar]
- a Gray L. W.; Peng F.; Molloy S. A.; Pendyala V. S.; Muchendits A.; Muzik O.; Lee J.; Kaplan J. H.; Lutsenko S. PLoS One 2012, 7, e38327. 10.1371/journal.pone.0038327. [DOI] [PMC free article] [PubMed] [Google Scholar]; b Lech T.; Hydzik P.; Kosowski B. Clin. Toxicol. 2007, 45, 688–694. 10.1080/15563650701502535. [DOI] [PubMed] [Google Scholar]; c Langner C.; Denk H. Virchows Arch. 2004, 445, 111–118. 10.1007/s00428-004-1047-8. [DOI] [PubMed] [Google Scholar]
- a Zhu H.; Fan J.; Lu J.; Hu M.; Cao J.; Wang J.; Li H.; Liu X.; Peng X. Talanta 2012, 93, 55–61. 10.1016/j.talanta.2012.01.024. [DOI] [PubMed] [Google Scholar]; b Park J. S.; Jeong S.; Dho S.; Lee M.; Song C. Dyes Pigm. 2010, 87, 49–54. 10.1016/j.dyepig.2010.02.003. [DOI] [Google Scholar]; c Yetisen A. K.; Montelongo Y.; Qasim M. M.; Butt H.; Wilkinson T. D.; Monteiro M. J.; Yun S. H. Anal. Chem. 2015, 87, 5101–5108. 10.1021/ac504274q. [DOI] [PubMed] [Google Scholar]
- a Afsana K.; Shiga K.; Ishizuka S.; Hara H. Biosci., Biotechnol., Biochem. 2004, 68, 584–592. 10.1271/bbb.68.584. [DOI] [PubMed] [Google Scholar]; b Ranganathan P. N.; Lu Y.; Jinag L.; Kim C.; Collins J. F. Blood 2011, 118, 3146–3153. 10.1182/blood-2011-05-352112. [DOI] [PMC free article] [PubMed] [Google Scholar]
- a Farkas E.; Enyedy É. A.; Csóka H. Polyhedron 1999, 18, 2391–2398. 10.1016/S0277-5387(99)00144-8. [DOI] [Google Scholar]; b Witte I.; Zhu B.-Z.; Lueken A.; Magnani D.; Stossberg H.; Chevion M. Free Radical Biol. Med. 2000, 28, 693–700. 10.1016/S0891-5849(99)00278-6. [DOI] [PubMed] [Google Scholar]; c Maekawa E.; Koshijima T. J. Appl. Polym. Sci. 1990, 40, 1601–1613. 10.1002/app.1990.070400916. [DOI] [Google Scholar]
- a Razmandeh R.; Nasli-Esfahani E.; Heydarpour R.; Faridbod F.; Ganjali M. R.; Norouzi P.; Larijani B.; Khoda-Amorzideh D. J. Diabetes Metab. Disord. 2014, 13, 43/1–43/6. 10.1186/2251-6581-13-43. [DOI] [PMC free article] [PubMed] [Google Scholar]; b Vanhoe H.; Vandecasteele C.; Versieck J.; Dams R. Anal. Chem. 1989, 61, 1851–1857. 10.1021/ac00192a014. [DOI] [PubMed] [Google Scholar]
Associated Data
This section collects any data citations, data availability statements, or supplementary materials included in this article.


