

Abstract
Paramagnetic Fe(II) and Co(II) complexes are utilized as the first transition metal examples of 1H NMR shift agents (paraSHIFT) for thermometry applications using Magnetic Resonance Spectroscopy (MRS). The coordinating ligands consist of TACN (1,4,7-triazacyclononane) and CYCLEN (1,4,7,10-tetraazacyclododecane) azamacrocycles appended with 6-methyl-2-picolyl groups, denoted as MPT and TMPC, respectively. 1H NMR spectra of the MPT- and TMPC-based Fe(II) and Co(II) complexes demonstrate narrow and highly shifted resonances that are dispersed as broadly as 440 ppm. The six-coordinate complex cations, [M(MPT)]2+ and [M(TMPC)]2+, vary from distorted octahedral to distorted trigonal prismatic geometries, respectively, and also demonstrate that 6-methyl-2-picolyl pendents control the rigidity of these complexes. Analyses of the 1H NMR chemical shifts, integrated intensities, line widths, the distances obtained from X-ray diffraction measurements and longitudinal relaxation time (T1) values allow for the partial assignment of proton resonances of the [M(MPT)]2+ complexes. Nine and six equivalent methyl protons of [M(MPT)]2+ and [M(TMPC)]2+, respectively, produce three-fold higher 1H NMR intensities compared to other paramagnetically shifted proton resonances. Among all four complexes, the methyl proton resonances of [Fe(TMPC)]2+ and [Co(TMPC)]2+ at −49.3 ppm and −113.7 ppm (37 °C) demonstrate the greatest temperature dependent coefficients (CT) of 0.23 ppm/°C and 0.52 ppm/°C, respectively. The methyl groups of these two complexes both produce normalized values of |CT|/FWHM = 0.30 °C−1, where FWHM is full width at half maximum (Hz) of proton resonances. The T1 values of the highly shifted methyl protons are in the range of 0.37–2.4 ms, allowing rapid acquisition of spectroscopic data. These complexes are kinetically inert over a wide range of pH values (5.6–8.6), as well as in the presence of serum albumin and biologically relevant cations and anions. The combination of large hyperfine shifts, large temperature sensitivity, increased signal-to-noise ratio and short T1 values suggests that these complexes, in particular the TMPC-based complexes, show promise as paraSHIFT agents for thermometry.
Synopsis
The hyperfine shifted proton resonances of high-spin Fe(II) and Co(II) macrocyclic complexes are utilized for temperature measurements by means of paramagnetic shift (paraSHIFT) Magnetic Resonance Spectroscopy (MRS). The x-ray crystal structures and 1H NMR solution spectra of these complexes support highly symmetrical, structurally rigid and kinetically inert complexes that are promising for development as paramagnetic probes for thermometry applications.
INTRODUCTION
Measurement of temperature profiles in biological tissues can provide valuable information for certain therapeutic treatments.1,2 Accordingly, in vivo temperature measurements, also called thermometry, have been developed that are based on either invasive3 or non-invasive4 techniques. While invasive methods utilize thermocouple wires5,6 or thermistors,3 non-invasive techniques include infrared (IR) spectroscopy7 and Magnetic Resonance (MR) methods, including MRI contrast agents based on paramagnetic metal ion complexes.8,9 Since the depth range of optical methods is usually limited to 4 mm, the thermometry applications of IR are usually limited to probing tissue close to the exterior or require indwelling catheters containing fiber-optic probes.3 In this regard, MR methods – Magnetic Resonance Imaging (MRI) and Magnetic Resonance Spectroscopy (MRS) – both operating at radio-frequencies, are the methods of choice for temperature mapping deep in tissues.
One of the most common applications of non-invasive thermometry in vivo is for regional temperature monitoring during hyperthermia as a cancer treatment procedure.1,2,10 Hyperthermia treatment requires achieving a tumor temperature distribution from 41 to 45 °C, which should be kept steady for a period of time, while the temperature of surrounding healthy tissues should remain within the normal physiological range. Such fine temperature control during hyperthermia procedures prevents damage of healthy tissues, but destroys tissue in the tumor region. Thermometry applications are not limited to the narrow physiological temperature range between 36 to 41 °C and hyperthermia range between 41 to 45 °C, but may require an extended temperature range for thermal ablation procedures (>50 °C), as well as for measuring heat deposition during MRI scans.
Water-based MRI thermometry that utilizes T1/T2 water proton relaxation measurements, molecular diffusion coefficient values or magnetization transfer techniques has been reported.4,9 However, these methods of temperature measurement would benefit from better temperature sensitivity at clinical magnetic field strengths as well as temporal resolution. It has also been shown that liposomal MRI contrast agents operating via T1 or T2 mechanisms11–16 as well as chemical exchange saturation transfer (CEST) agents17–22 have potential for thermometry applications. As an alternative to MRI, direct MRS temperature mapping of biological water based on proton resonance frequency (PRF) has been widely studied.4 Unfortunately, bulk water PRF thermometry is known to have an extremely low sensitivity of 0.01 ppm/°C.23 Moreover, utilization of the conventional or endogenous diamagnetic molecular probes, such as glutamate, glutamine and N-acetylaspartate for in vivo MRS applications are limited by the intense proton resonances of water itself, as well as biological constituents of tissue such as fats and proteins.24,25 One approach to overcome these limitations to MRS is the development of paramagnetic metal ion complexes that shift proton resonances away from those in tissue.26
Paramagnetic complexes of trivalent lanthanide metal ions, Ln(III), that demonstrate small line-broadening effects are good 1H NMR shift agents, and these agents have been developed for thermometry purposes for over a couple of decades.27–35 It has been shown that the observed proton resonances of paramagnetic MRS agents should optimally be shifted at <−17 or >+22 ppm on a 7 T magnetic field to overcome being obscured by background from biological tissues.36 In these recent studies, the highly temperature sensitive hyperfine pseudo-contact (through space) shifts of the Dy(III) and Tm(III) complexes have been optimized by varying the distances of the shifted protons from the paramagnetic center. These highly sensitive paramagnetic probes for chemical shift imaging have been termed “paraSHIFT” agents.36 There are several other Ln(III)-based paraSHIFT agents, generally Tm(III), Tb(III), Dy(III) or Yb(III) complexes, that have been developed for registration of temperature.37,38 The best of these agents give temperature coefficient (CT) values of up to 1.8 ppm/°C.37 This large change of shift with temperature dwarfs that of bulk water at 0.01 ppm/°C.
It is important to note that other nuclei, in combination with paramagnetic Ln(III) ions, have been utilized for MRS thermometry. Thus, 31P NMR signals are highly shifted when in close proximity to paramagnetic metal ions. It has been shown that a strong temperature dependence of 31P chemical shifts has potential for using in MRS thermometry.28,29 More recently, improved sensitivity of highly shifted 19F MRS probes have been achieved by placing heteronuclei at 5 to 7 A from a paramagnetic metal ion, making improved thermometry sensitivity more feasible.39,40
An important consideration in the design of paraSHIFT agents is the distance between the reporter proton resonance and the metal ion center.41 For Ln(III) complexes, the hyperfine shift for protons greater than two bonds away from the metal ion center is predominantly due to dipolar interactions.42 This makes it relatively straightforward to predict the distance at which protons are effectively broadened versus distances at which protons are shifted but not substantially broadened.42,43 As reported for Dy(III) and Tm(III) complexes, a distance of 6 to 6.5 A gives highly shifted resonances (>40 ppm from the water signal) for the t-butyl groups, which additionally provides an increased number of equivalent protons.36 Those optimal distances allow for minimal line broadening effects due to the longer transverse relaxation times (T2). At the same time, the T1 relaxation time values are short enough for fast data acquisition. Thus, Ln(III) probes have been developed that have suitable T1 and T2 values for in vivo thermometry imaging within a few minutes at millimolar concentrations.29,33 However, the anionic nature of many of these Ln(III) paraSHIFT agents makes their 1H NMR resonances sensitive to pH changes or presence of the metal ions, such as Ca2+ cations.29,31 Notably, the majority of currently known Ln(III) probes demonstrate both temperature and pH-dependent chemical shift changes as in eq. 1:
| eq. 1 |
where CT = (∂δt/∂T)pH is the temperature dependence of chemical shift, and CpH = (∂ δt/∂pH)T, is the pH dependence of chemical shift. Dual temperature and pH dependence of the 1H NMR chemical shifts in Ln(III) complexes gave birth to a special thermometry technique termed “BIRDS” (biosensor imaging of redundant deviation in shifts), which is based on empirical formulas describing shift properties of proton resonances of a particular MRS probe.44,45 While BIRDS agents represent a family of smart contrast agents, their utilization in thermometry applications is more challenging. This current work is focused on new alternatives – paraSHIFT agents that based on transition metal complexes – which have proton resonance relatively insensitive to cation concentration and pH variations within the physiological range.
Certain paramagnetic transition metal ions have optimal properties for chemical shift imaging. Early work by Bertini46 and Drago47 showed that several of the first row transition metal ions, especially Co(II), are useful for paramagnetic NMR spectroscopy. Also, a strong temperature dependence has been demonstrated for 13C and 1H NMR resonances under magic angle spinning for paramagnetic metal complexes in the solid-state.48,49 Our previous work has shown that Fe(II), Co(II) and Ni(II) complexes produce highly shifted and often relatively narrow proton resonances to give complexes that function as paraCEST agents.26,50–52 For these transition metal ions, contact (through-bond) contributions to the hyperfine shifts are expected to be substantial.53 Thus hyperfine shifts can be quite large even for paramagnetic metal ions such as Co(II) and Fe(II) that have relatively small magnetic moments in comparison to lanthanides that demonstrate highly shifted proton resonances such as Dy(III) and Tm(III).54 This difference in hyperfine shift contributions between transition metal ions and lanthanides is important for paraSHIFT agents which require narrow proton resonances. Relaxation mechanisms that affect linewidths, in particular the Curie contribution, are significant for metal ions with large magnetic moments such as Dy(III).42,55
Another important consideration for paraSHIFT agents is the rigidity of the complex on the NMR time scale.26,41,56 Dynamic processes that interconvert different conformations of the bound ligand often lead to highly broadened proton resonances.57–60 For example, as reported by our group, all of the Fe(II) and Co(II) complexes of TACN and CYCLEN appended with amide groups give broad proton resonances due to their structural fluxionality.52 In contrast, heterocyclic pendents attached to a TACN framework generally give more rigid Fe(II) and Co(II) complexes.26,50,51 Additionally, while CYCLEN-based Ln(III) complexes often produce several structural isomers detectable on the 1H NMR time-scale,57,59 it is preferable to prepare new complexes that exist in a single diastereomeric form in aqueous solutions. Moreover, line broadening effects are also dependent on the T2 values, which are determined in part by coordination number and structural geometry of transition metal complexes.61,62 Here we show that Fe(II) and Co(II) complexes of 6-methyl-2-picolyl appended TACN and CYCLEN macrocycles give extremely sharp and highly shifted proton resonances which are ideal for their development as paraSHIFT agents. As shown here, both types of Co(II) and Fe(II) complexes are high-spin and six-coordinate in the solid state and aqueous solution. Towards pioneering the field of paraSHIFT agents that based on transition metal ions, suitable azamacrocyclic frameworks for structurally rigid complexes are identified. In addition to temperature dependent 1H NMR studies, we focus on the structural properties of these complexes and the T1 properties of individual protons.
EXPERIMENTAL
Materials and Methods
All instrumentation and materials used in these studies are listed in the Supporting Information.
Crystallization and X-ray diffraction data collection
Uniform crystals of [Fe(MPT)](CF3SO3)2, [Co(MPT)](NO3)2, [Fe(TMPC)](CF3SO3)2 and [Co(TMPC)]Cl2 were formed by vapor diffusion method at room temperature, while growing over 5–10 days. In a typical procedure, milligram quantities of each complex were placed in the individual vials and dissolved in the minimal volume (0.3–0.6 mL) of absolute ethanol. These vials were placed in the larger dram vials containing 3.0–4.0 mL of n-hexane. Suitable crystals were selected and mounted on glass fibers with oil on a Bruker SMART APEX-II CCD diffractometer installed at a rotating anode source (MoKα radiation, λ = 0.71073 A). The crystals were kept at 90(2) K during data collection using an Oxford Cryosystems (Olex2) nitrogen gas-flow apparatus.
For complexes [Fe(MPT)](CF3SO3)2, [Co(MPT)](NO3)2, [Fe(TMPC)](CF3SO3)2 and [Co(TMPC)]Cl2 the data were collected by the rotation method with 0.5° frame width (ω scan) and 1, 2, 75, and 15 s exposure times per frame, respectively. Five sets of data (360 frames in each set) were collected for each sample nominally covering complete reciprocal space. The structures were solved with the olex2.solve structure solution program using the Charge Flipping method and refined with the ShelXL refinement package using Least-Squares minimization.63–65 The structures were refined by full-matrix least-squares against F2.
The twist angles (θ) for these complexes were calculated as dihedral angles defined by the centroids of two mean planes and two atoms, one from each plane. In [Fe(MPT)](CF3SO3)2 and [Co(MPT)](NO3)2, one mean plane was defined by the three coordinated pyridyl nitrogen atoms, and the other mean plane was defined by the three coordinated nitrogen atoms of the macrocycle. In [Fe(TMPC)](CF3SO3)2 and [Co(TMPC)]Cl2, the mean planes were each defined by one coordinated pyridyl nitrogen atom and the two nearest macrocycle nitrogen atoms. The Olex2 software package was used to generate these mean planes and calculate the xyz coordinates of their centroids. Dummy atoms (X1, X2) were placed at these centroid coordinates for use in calculating the rotation angles between the planes. The dihedral angles were calculated using the crystal structure visualization and analysis in Mercury software. These dihedral angles represent the relative rotation of one mean plane with respect to the other.
1,4,7,10-Tetrakis[(6-methyl-2-pyridyl)methyl]-1,4,7,10-tetrazacyclododecane (TMPC)
2-Bromomethyl-6-methylpyridine (1.36 g, 7.31 mmol, 4.2 equiv.) was added to an argon-purged solution of CYCLEN (0.30 g, 1.74 mmol, 1.0 equiv.) and DIPEA (1.49 mL, 8.54 mmol, 4.9 equiv.) in acetonitrile (60 mL) at 70 °C (Scheme S1). The reaction mixture was stirred at 80 °C under argon for 3 h. The reaction mixture was cooled to room temperature and solvent was removed in vacuo, producing a brown oil. This residue was partitioned in 50 mL of water and 100 mL of chloroform. The organic layer was isolated, and the aqueous portion was extracted with chloroform (3 × 100 mL). Combined organic extracts were dried with anhydrous MgSO4 and filtered. The solvent was removed in vacuo, producing crude product, which was further purified by column chromatography using basic Al2O3 and a solvent gradient containing 0 to 2% of methanol in methylene chloride. Yield: 0.81 g, 1.36 mmol, 78%. 1H NMR, 500 MHz (CDCl3, ppm): δ = 7.56 d (4H, Ar), 7.27 t (4H, Ar), 6.91 d (4H, Ar), 3.58 s (8H, 4CH2), 2.74 s (16H, 8CH2), 2.46 s (12H, 4CH3). 13C NMR, 75 MHz (CDCl3, ppm): δ = 159.83, 157.29, 136.41, 121.01, 119.52, 61.77, 53.69, 24.39. ESI-MS (m/z): [M+H+], calculated: 593.4; found: 593.5 (40%) [M+H+] and 615.5 (100%) [M+Na+].
The MPT and TPC ligands were synthesized by using modified procedure for the preparation of TMPC as presented in the Supporting Information.
1,4,7-Tris(2-pyridylmethyl)-1,4,7-triazacyclononane (PT) was synthesized according to the reported procedure,66 and this ligand was purified by SiO2 column chromatography using 1 to 10% of methanol in methylene chloride as the eluting solvent.
Synthesis of Fe(II) and Co(II) complexes
Syntheses of [Fe(PT)](CF3SO3)2 and [Fe(AMPT)](CF3SO3)2 have been reported previously.50,67 The Fe(II) and Co(II) complexes of TMPC ligand are prepared from the corresponding metal(II) salts in acetonitrile/water or methanol/water mixtures, depending on the solubility of starting materials and the protonation states of the ligands. The representative general procedure for the [Fe(TMPC)](CF3SO3)2 synthesis is presented below.
Synthesis of [Fe(TMPC)](CF3SO3)2
TMPC (40 mg, 68 μmol) was dissolved in a mixture of acetonitrile (0.8 mL) and water (0.4 mL) followed by addition of Fe(CF3SO3)2 (25 mg, 72 μmol, 1.05 equiv.). Small aliquots (1.0–2.0 μL) of 0.1–1.0 M NaOH aqueous solution were gradually added under constant stirring to adjust to pH 7.0. The reaction mixture was stirred for 40 min under constant pH 6.8–7.0. The brown cloudy impurities were removed by centrifugation, and resultant clear yellow solution was concentrated by using a SpeedVac centrifugal evaporator. The dried yellow solids were further recrystallized from the ethanol-hexanes solvent system. Yield: 32 mg, 34 μmol, 50%.
All MPT- and TPC-based complexes were prepared from the appropriate Fe(II) and Co(II) salts in neat acetonitrile or acetonitrile/methanol mixture. The choice of the counter ion depended on the desired solubility of the complex in organic or aqueous solutions. Therefore, [Fe(MPT)](CF3SO3)2, [Fe(MPT)]Cl2, [Co(MPT)](NO3)2, [Co(MPT)]Cl2, [Fe(TMPC)](CF3SO3)2, [Fe(TMPC)]Cl2, [Co(TMPC)]Cl2, [Fe(TPC)]Cl2 and [Co(TPC)]Cl2 have been prepared. All reactions were carried out under argon atmosphere. All complexes were isolated as precipitates from the reaction mixtures, or, otherwise, if no precipitates were formed, the solvents were removed, and the complexes were recrystallized from acetonitrile or ethanol using hexanes as a co-solvent.
[Fe(MPT)](CF3SO3)2 was obtained as a yellow powder (60% yield); ESI-MS: m/z = 250.3 (100%) [m/2], 649.3 (75%) [m + CF3SO3−]. [Co(MPT)]Cl2 was obtained as a dark purple powder (78% yield); ESI-MS: m/z = 251.9 (100%) [m/2], 538.3 (75%) [m + Cl−]. [Fe(TMPC)]Cl2 was obtained as a light yellowish powder (62% yield); ESI-MS: m/z = 324.4 (80%) [m/2], 683.3 (100%) [m + Cl−]. [Co(TMPC)]Cl2 was obtained as a light blue powder (70% yield); ESI-MS: m/z = 325.9 (90%) [m/2], 686.3 (100%) [m + Cl−]. [Fe(TPC)]Cl2 was obtained as a dark grey-green powder (75% yield); ESI-MS: m/z = 296.4 (100%) [m/2], 627.3 (60%) [m + Cl−]. [Co(TPC)]Cl2 was obtained as a light purple powder (90% yield); ESI-MS: m/z = 297.9 (100%) [m/2], 630.3 (45%) [m + Cl−].
Determination of magnetic moment
The effective magnetic moment (μeff, BM) was calculated by using Evans’ method,68 and the reported values were obtained by averaging of at least three independent measurements. In a typical experiment, 12–20 mM solutions of Fe(II) and Co(II) complexes in deuterium oxide, pD 7.0–7.4, containing 5% tert-butanol (v/v) were placed in an NMR tube insert, while a reference solution of 5% tert-butanol (v/v) in deuterium oxide, pD 7.0, was placed into an NMR tube. The effective magnetic moment was calculated at 298 K (T) using equations 2–3, where parameters are defined as the frequency shift of the reference (Δf) in Hz, the spectrometer frequency (f) in Hz, the mass of the substance per cm3 of the solution (m), and the densities of pure solvent (d0) and solution (ds). Assuming that the solute of low concentration has zero partial specific or molar volume, the solute dissolves in solvent at constant volume producing (d0-ds)/m = −1.69 Therefore, the third term in eq. 2.1 completely cancels the second term, and the mass susceptibility of the solvent (χ0) has no contribution to the mass susceptibility of the solute (χg) as in eq. 2.2 used here. Also, the diamagnetic contribution is neglected for small molecules.69,70 The molar susceptibility (χm) is the product of χg multiplied by the molecular weight of the particular complex.71
| eq. 2.1 |
| eq. 2.2 |
| eq. 3 |
T1 measurements for ligand protons
The 100–130 mM solutions of individual complexes in deuterium oxide, pD 6.9–7.4, were used for the inversion-recovery T1 experiments at 25 °C. The standard two-pulse sequence (180° pulse followed by 90° pulse) was employed. The 90-degree pulse width was calibrated routinely before each set of measurements. The minimum expected T1, the maximum expected T1 and the total time (maximum 2 hours used) of each experiment were varied and optimized. The 1H NMR spectrum of each complex was divided into several regions to ensure effective inversion of the spin populations, as well as to avoid having off-axis magnetization and fold-overs when the observed pulse was applied. The baseline correction was performed for all spectra. In order to determine the value of T1, the array of values of the parameter d2, which is between min T1 and max T1, were fit by an exponential curve as in eq. 4:
| eq. 4 |
where M0 is the equilibrium Z magnetization and M(0) is the magnetization at time zero, which is immediately after the 180° pulse for an inversion recovery T1 experiment. The differences in relaxation times of some proton resonances required that the T1 measurements were performed for the narrow sweep widths. The T1 values for the sharp peaks were easily obtained, while the T1 values for some of the broadened proton resonances were not resolved. The T1 values were obtained by averaging data from at least three independent experiments.
1H-zTOCSY NMR experiments
A 2-D 1H-zTOCSY NMR experiment (D2O, 25 °C) covered the 0 to 50 ppm spectral region with 256 points in both t2 and t1 dimensions obtained at 252 scans, a spectral width of 24 kHz, and a relaxation delay of 300 ms. The correlation information obtained facilitated the assignment of some isotropically shifted signals in conjunction with chemical shift, line width and T1 information.
pH-induced chemical shifts
The pD-dependence of 1H NMR chemical shifts (D2O, 37 °C) of the [Fe(TMPC)]2+ proton resonances was studied at the pD 4.1–9.8 range. Solutions containing 20 mM [Fe(TMPC)]2+ in 100 mM NaCl (D2O) were titrated with 1–2 μL aliquots of 1 M DCl or 1 M NaOD in D2O to adjust the pD of solution in 0.5–1.0 increments of the pD units.
Dissociation of complexes
1H NMR spectra of 10 mM complexes in deuterium oxide at 37 °C were collected periodically over 48 hours from the beginning of the experiment. Namely, 1H NMR spectra were collected at 0, 6, 12, 24 and 48 h. The 5 mM TMSP internal standard was used for the monitoring of complex concentrations by means of integration of 1H NMR resonances. Thus, integrated intensities of the paramagnetically shifted methyl proton resonances have been compared to the integrated intensities of methyl protons of TMSP for the quantification of % dissociation. First, the dissociation of the complexes was studied in the presence of 100 mM NaCl, 0.40 mM Na2HPO4 and 25 mM K2CO3 at pD 7.2–7.7. Independently, the dissociation of the complexes at pD 3.0(1) in deuterium oxide containing 100 mM NaCl was studied. Also, the Fe(II) complexes were challenged in the presence of 5 mM Zn2+, or 2.5 mM Ca2+ in deuterium oxide, pD 6.5–7.5.
The MPT- and TMPC-based metal complexes were also studied in the presence of albumin from porcine serum. 1H NMR spectra (D2O, 37 °C) of 12.5–10.0 mM complexes were collected in the presence of 0 to 35 mg/mL of serum albumin. Each complex solution (400 μL in D2O) was titrated with 175 mg/mL (5X) stock solution of serum albumin in 20 μL increments. The initial concentrations of complexes are 12.5 mM, while the final concentrations of samples are 10 mM in complexes and ca. 0.5 mM in albumin (35 mg/mL). After the completion of the titrations, 1H NMR spectra of these samples were also collected at 24 h and 48 h to confirm complex stability.
RESULTS
The paramagnetic Fe(II) and Co(II) centers of MPT and TMPC complexes studied here produce hyperfine shifted proton resonances, which strongly depend on their structural properties in solution. 1H NMR spectroscopy was the method of choice to study these complexes in the solution phase as described below. To elucidate their coordination chemistry in the solid state, the complexes were characterized by using X-ray crystallography.
Crystal structures of macrocyclic complexes
The complex cations of [Fe(MPT)](CF3SO3)2 and [Co(MPT)](NO3)2 feature hexacoordinate geometries with all six nitrogen atoms of the MPT ligand coordinated to the metal ion centers (Fig. 1). The three 6-methyl-2-picolyl pendents form a propeller-like configuration with the three methyl groups pointing in the same direction when viewed down the axis of symmetry of these complexes. The twisted orientation of the macrocycle ethylene units is also uniform within a particular complex cation. As a result, both cations exhibit approximately C3-symmetrical structures. The individual twist angles (θ) calculated for all MPT complexes are presented in the form of diagrams with values given in a table at the bottom of Figure 1.
Figure 1.

ORTEP plots of two structural diastereomers of [Fe(MPT)](CF3SO3)2 presented by A) Fe4 – Λ(λλλ) and B) Fe3 – Λ(δδδ) isomers. ORTEP plot of [Co(MPT)](NO3)2 shows C) Λ(λλλ) isomer. Hydrogen atoms, solvent molecules and counter ions are omitted for clarity. Ellipsoids are set at 50%. Twist angles (θ) are shown for the projections of two triangles formed by three donor atoms each when viewed down the C3-axis of symmetry.
[Fe(MPT)](CF3SO3)2 crystallizes in the non-centrosymmetric space group P21 and has four crystallographically independent molecules in the asymmetric unit (Table 1). These complexes represent the following isomers: Fe1 – Δ(δδδ), Fe2 – Δ(δδδ), Fe3 – Λ(δδδ) and Fe4 – Λ(λλλ). The symmetry of the space group lacks a center of inversion; therefore, these are the only isomers present in this crystal structure. Two ORTEP structures of the Fe4 – Λ(λλλ) and Fe3 – Λ(δδδ) diastereomers are shown in Figure 1(A–B), where the [Fe(MPT)]2+ cations are viewed down the C3 axis of symmetry from the plane of pyridine nitrogen atoms (top), as well as from the side (middle), which is viewed perpendicular to the axis of symmetry. The twist angles for Fe1, Fe2, Fe3 and Fe4 molecules are 43.4(8)°, 43.6(5)°, −30.1(9)° and −43.7(7)°, respectively (Fig. 1). As expected, the bond angles are similar for the Fe1, Fe2 and Fe4 enantiomers, and differ from the bond angles of the Fe3 diastereomer (Tables 2, S10 and S11).
Table 1.
Crystal data, collection, and structure refinement parameters for [Fe(MPT)](CF3SO3)2, [Co(MPT)](NO3)2, [Fe(TMPC)](CF3SO3)2 and [Co(TMPC)]Cl2.
| [Fe(MPT)](CF3SO3)2 | [Co(MPT)](NO3)2 | [Fe(TMPC)](CF3SO3)2 | [Co(TMPC)]Cl2 | |
|---|---|---|---|---|
| Empirical formula | C29.5H36.5F7.5FeN6Na0.5O7.75S2.5 | C27H36CoN8O6 | C38H48F6FeN8O6S2 | C36H60Cl2CoN8O6 |
| FW | 889.14 | 627.57 | 946.81 | 830.75 |
| Crystal system | Monoclinic | Orthorhombic | Triclinic | Monoclinic |
| Space group | P21 | Pbca | P1̄ | C2/c |
| Crystal size (mm3) | 0.22 × 0.20 × 0.20 | 0.20 × 0.20 × 0.03 | 0.40 × 0.04 × 0.02 | 0.30 × 0.22 × 0.06 |
| Temperature (K) | 90(2) | 90(2) | 90(2) | 90(2) |
| a (A) | 14.0975(17) | 18.3433(7) | 9.462(3) | 11.3586(7) |
| b (A) | 13.7505(16) | 18.0221(7) | 15.031(4) | 14.8399(10) |
| c (A) | 37.868(4) | 18.9080(7) | 16.177(4) | 24.1643(16) |
| α (deg) | 90.00 | 90.00 | 106.157(6) | 90.00 |
| β (deg) | 96.079(4) | 90.00 | 102.730(7) | 98.4869(10) |
| γ (deg) | 90.00 | 90.00 | 91.141(7) | 90.00 |
| V (A3) | 7299.3(15) | 6250.7(4) | 2147.4(10) | 4028.5(5) |
| Z | 8 | 8 | 2 | 4 |
| ρcalc (g cm−3) | 1.618 | 1.334 | 1.464 | 1.370 |
| μ (mm−1) | 0.657 | 0.601 | 0.529 | 0.613 |
| F000 | 3652.0 | 2632.0 | 984.0 | 1764.0 |
| Radiation (λ, A) | MoKα (0.71073) | MoKα (0.71073) | MoKα (0.71073) | MoKα (0.71073) |
| R1 (obs) | 0.0537 | 0.0463 | 0.1035 | 0.0298 |
| R1 (all) | 0.0662 | 0.0642 | 0.1534 | 0.0325 |
| wR2 (obs) | 0.1358 | 0.1178 | 0.2699 | 0.0792 |
| wR2 (all) | 0.1446 | 0.1251 | 0.2903 | 0.0811 |
| Goodness-of-fit on F2 | 1.036 | 1.088 | 1.095 | 1.074 |
Table 2.
Selected bond lengths (A) and bond angles (deg) for [Fe(MPT)](CF3SO3)2 (diastereomers Fe4 – Λ(λλλ) and Fe3 – Λ(δδδ)), [Co(MPT)](NO3)2, [Fe(TMPC)](CF3SO3)2 and [Co(TMPC)]Cl2.
| [Fe(MPT)](CF3SO3)2 | [Co(MPT)](NO3)2 | [Fe(TMPC)](CF3SO3)2 | [Co(TMPC)]Cl2 | ||||||
|---|---|---|---|---|---|---|---|---|---|
|
| |||||||||
| Fe4 | Fe3 | ||||||||
| Bond Lengths (Å) | |||||||||
| Fe4–N19 | 2.216(3) | Fe3–N13 | 2.202(3) | Co1–N1 | 2.1654(15) | Fe1–N1 | 2.260(8) | Co1–N1 | 2.1915(7) |
| Fe4–N20 | 2.216(3) | Fe3–N14 | 2.313(3) | Co1–N2 | 2.1973(16) | Fe1–N3 | 2.199(8) | Co1–N11 | 2.1915(7) |
| Fe4–N21 | 2.234(3) | Fe3–N15 | 2.234(3) | Co1–N3 | 2.1636(15) | Fe1–N5 | 2.213(8) | Co1–N3 | 2.1631(7) |
| Fe4–N22 | 2.209(3) | Fe3–N16 | 2.271(3) | Co1–N4 | 2.2249(16) | Fe1–N6 | 2.369(8) | Co1–N31 | 2.1631(7) |
| Fe4–N23 | 2.220(3) | Fe3–N17 | 2.237(3) | Co1–N5 | 2.1525(16) | Fe1–N7 | 2.206(8) | Co1–N4 | 2.3857(7) |
| Fe4–N24 | 2.222(3) | Fe3–N18 | 2.226(3) | Co1–N6 | 2.2031(15) | Fe1–N8 | 2.354(8) | Co1–N41 | 2.3857(7) |
| Bond Angles (deg) | |||||||||
| N19–Fe4–N20 | 77.88(11) | N13–Fe3–N14 | 74.48(12) | N1–Co1–N2 | 79.11(6) | N1–Fe1–N6 | 88.2(3) | N11–Co1–N1 | 92.37(4) |
| N19–Fe4–N21 | 78.68(11) | N13–Fe3–N15 | 78.17(12) | N1–Co1–N4 | 158.75(6) | N1–Fe1–N8 | 129.0(3) | N1–Co1–N41 | 130.43(2) |
| N19–Fe4–N23 | 79.14(12) | N13–Fe3–N16 | 107.08(11) | N1–Co1–N6 | 96.71(6) | N3–Fe1–N1 | 93.1(3) | N11–Co1–N41 | 87.08(2) |
| N19–Fe4–N24 | 158.01(12) | N13–Fe3–N17 | 77.30(12) | N2–Co1–N4 | 103.30(6) | N3–Fe1–N5 | 149.1(3) | N1–Co1–N4 | 87.08(2) |
| N20–Fe4–N21 | 156.56(11) | N13–Fe3–N18 | 150.08(12) | N2–Co1–N6 | 103.16(6) | N3–Fe1–N6 | 128.9(3) | N11–Co1–N4 | 130.43(2) |
| N20–Fe4–N23 | 98.05(11) | N15–Fe3–N14 | 150.67(12) | N3–Co1–N1 | 80.07(6) | N3–Fe1–N7 | 76.1(3) | N31–Co1–N11 | 77.70(3) |
| N20–Fe4–N24 | 106.77(11) | N15–Fe3–N16 | 74.56(11) | N3–Co1–N2 | 95.56(7) | N3–Fe1–N8 | 87.9(3) | N31–Co1–N1 | 149.10(3) |
| N22–Fe4–N19 | 96.95(11) | N15–Fe3–N17 | 77.32(11) | N3–Co1–N4 | 78.68(6) | N5–Fe1–N1 | 75.9(3) | N3–Co1–N1 | 77.70(3) |
| N22–Fe4–N20 | 105.26(11) | N16–Fe3–N14 | 103.53(11) | N3–Co1–N6 | 160.08(7) | N5–Fe1–N6 | 80.2(3) | N3–Co1–N11 | 149.10(3) |
| N22–Fe4–N21 | 77.27(11) | N17–Fe3–N14 | 106.36(11) | N5–Co1–N1 | 80.80(6) | N5–Fe1–N8 | 77.7(3) | N31–Co1–N3 | 124.47(4) |
| N22–Fe4–N23 | 155.04(11) | N17–Fe3–N16 | 149.81(11) | N5–Co1–N2 | 159.91(6) | N7–Fe1–N1 | 148.9(3) | N31–Co1–N41 | 78.80(2) |
| N22–Fe4–N24 | 102.29(11) | N18–Fe3–N14 | 99.10(11) | N5–Co1–N3 | 81.19(6) | N7–Fe1–N5 | 126.9(3) | N3–Co1–N41 | 78.00(2) |
| N23–Fe4–N21 | 77.79(12) | N18–Fe3–N15 | 109.94(11) | N5–Co1–N4 | 95.53(6) | N7–Fe1–N6 | 77.1(3) | N3–Co1–N4 | 78.81(2) |
| N23–Fe4–N24 | 78.93(11) | N18–Fe3–N16 | 102.84(10) | N5–Co1–N6 | 78.89(6) | N7–Fe1–N8 | 80.4(3) | N31–Co1–N4 | 78.00(2) |
| N24–Fe4–N21 | 95.17(11) | N18–Fe3–N17 | 76.66(11) | N6–Co1–N4 | 103.15(6) | N8–Fe1–N6 | 128.8(3) | N4–Co1–N41 | 128.86(3) |
The asymmetric unit of [Co(MPT)](NO3)2 contains one full Λ(λλλ) isomer of this complex having a single formula weight (Table 1). It crystallizes in the centrosymmetric space group Pbca; therefore, the crystal structure also contains the inversion isomer Δ(δδδ). The ORTEP structure of the C3-symmetrical [Co(MPT)]2+cation having the Λ(λλλ) configuration is shown in Figure 1C. The apical twist angle of θ = −45.4(3)° is found for the [Co(MPT)]2+ crystal structure. The selected bond lengths and angles are presented in Table 2, S17, S18.
The bond lengths and angles of the Fe4 – Λ(λλλ) isomer of [Fe(MPT)]2+ and the Λ(λλλ) isomer of [Co(MPT)]2+ are quite similar with slightly shorter Co–N bond lengths compared to Fe–N bond lengths (Table 2). The overlay of these two crystal structures clearly demonstrates similarity of two molecules (Fig. S1). The crystal structure of the Fe3 – Λ(δδδ) diastereomer is different from all other MPT complexes.
The complex cations of [Fe(TMPC)](CF3SO3)2 and [Co(TMPC)]Cl2 are six-coordinate with four aliphatic amine donor atoms from the macrocycle backbone (CYCLEN) and two donor nitrogen atoms from the 6-methyl-2-picolyl pendent groups bound to the metal ion (Figure 2). In both complexes, two pendents at the 4,10-nitrogen atoms of CYCLEN are not coordinated, while two metal ion-bound picolyl pendents at 1,7-nitrogen positions are on the same side (cis) relative to the plane of the CYCLEN macrocycles. The twist of the macrocycle ethylene units is also uniform within a particular complex cation. Therefore, both complex cations demonstrate approximately C2-symmetrical structures, where the metal ions are positioned above the CYCLEN plane. Moreover, the geometries of the TMPC complexes are best described as slightly distorted trigonal prismatic by using the quasi-C3 axis of the trigonal prism, which is perpendicular to the C2-symmetry axis of the molecule. In this case, the divalent metal ion is considered to be sandwiched between the planes of two triangles comprised of two NCYCLEN and one NPyr donor atoms each, as shown at the bottom of Figure 2. The twist angles (θ1-θ3) for each pair of apical points are calculated for these complexes as shown in Figure 2.
Figure 2.

ORTEP plots of (A) [Fe(TMPC)](CF3SO3)2 and (B) [Co(TMPC)]Cl2 that both have Λ(δδδδ) configuration. Hydrogen atoms, solvent molecules and counter ions are omitted for clarity. Ellipsoids are set at 50%. Twist angles (θ) are shown for the projections of two triangles formed by three donor atoms each when viewed down the quasi-C3 axis of symmetry perpendicular to the C2-axis of symmetry.
The asymmetric unit of [Fe(TMPC)](CF3SO3)2 contains one full complex of the Λ(δδδδ) isomer displaying a single formula weight (Table 1). This complex crystallizes in the centrosymmetric space group P1̄; therefore, the crystal structure also contains the Δ(λλλλ) enantiomer. The ORTEP structure of the [Fe(TMPC)]2+cation having Λ(δδδδ) configuration viewed down the C2-axis of symmetry from the bound pyridine pendents (top), and from the side (middle) is shown in Figure 2A. The selected bond angles are presented in Table 2, where the Fe2+-centered angle produced by two picolyl nitrogens is 93.1°.
The asymmetric unit of [Co(TMPC)]Cl2 contains one-half of a [Co(TMPC)]Cl2 complex, as the complex sits on a C2 rotation axis (Table 1). This complex crystallizes in the centrosymmetric space group C2/c; therefore, the crystal structure contains the enantiomeric pair of isomers Λ(δδδδ) and Δ(λλλλ). The ORTEP structure of the [Co(TMPC)]2+cation having Λ(δδδδ) configuration is shown in Figure 2B. Selected N(N1)–Co–N(N1) bond angles are presented in Table 2, where the Co2+-centered angle produced by two pyridine nitrogens is 92.4°. Notably, both Fe(II) and Co(II) TMPC-based complexes have quite similar bond lengths and angles as visualized by overlapping of these two crystal structures (Fig. S2).
Solution properties of Fe(II) and Co(II) complexes
The Evan’s method was used to characterize effective magnetic moments (μeff) of the complexes in solution. Values as given in Table 4 range from 5.7 ± 0.1 to 6.0 ± 0.3 BM, supporting high-spin Fe(II) and Co(II) complexes in all cases.
Table 4.
Kinetic inertness of Fe(II) and Co(II) complexes.a
| Complex | % Dissociation Acid b | % Dissociation Anions c | % Dissociation Zn(II) d | % Dissociation Ca(II) e | % Dissociation Albumin f |
|---|---|---|---|---|---|
| [Fe(MPT)]2+ | 2 | 0 | 0 | 0 | 0 |
| [Co(MPT)]2+ | 6 | 0 | 0 | 0 | 0 |
| [Fe(TMPC)]2+ | 5 | 2 | 0 | 0 | 0 |
| [Co(TMPC)]2+ | 8 | 3 | 0 | 0 | 0 |
All samples in D2O were incubated at 37 °C and % dissociation was reported after 48 h;
100 mM NaCl, pD 3.0(1);
100 mM NaCl, 0.40 mM Na2HPO4 and 25 mM K2CO3 at pD 7.2–7.7;
100 mM NaCl, 5 mM Zn2+, pD 6.5–6.8;
100 mM NaCl, 2.5 mM Ca2+, pD 7.0–7.5;
35 mg/mL of serum albumin;
1H NMR spectra of [Fe(MPT)]2+ and [Co(MPT)]2+ in D2O are shown in Figure 3. Both complexes produce ten proton resonances dispersed between −20 and 200 ppm at 25 °C, while two out of ten proton resonances of [Co(MPT)]2+ are found within the diamagnetic region of 1H NMR spectra. For both complexes, nine proton resonances have equivalent integrated intensities, while the tenth resonance demonstrates 3-fold higher intensity. This latter proton resonance falls at 21.22 ppm (207 Hz) for [Fe(MPT)]2+ and 8.03 ppm (66.5 Hz) for [Co(MPT)]2+, respectively, at 25 °C, and are assigned as the methyl groups (Table 4). The proton resonances at 52.14 ppm, 33.33 ppm and −4.34 ppm (Fig. 3A) demonstrate the narrowest linewidths in the [Fe(MPT)]2+ spectrum with their corresponding FWHM values of 75.1 Hz, 70.7 Hz and 73.4 Hz, respectively, at 25 °C (Table. S1). The peak widths of [Co(MPT)]2+ are the narrowest among all the complexes presented here. Three proton resonances of [Co(MPT)]2+ at 49.38 ppm, 33.21 ppm and 5.38 ppm (Fig. 3B) demonstrate exceptionally narrow linewidths with FWHM values of 16.5 Hz, 17.2 Hz and 15.0 Hz, respectively, at 25 °C (Table. S3).
Figure 3.

1H NMR spectra of [Fe(MPT)]2+ (A) and [Co(MPT)]2+ (B) in D2O, pD 7.0–7.6, at 25 °C. Insert B shows expanded region of the [Co(MPT)]2+ spectra around solvent peak. Solvent peaks are labeled “s”.
The 1H NMR spectra of two related complexes are shown for comparison. A complex with an amino-pyridine pendent, [Fe(AMPT)]2+, exhibits a similar pattern of proton resonances and corresponding linewidths to that of [Fe(MPT)]2+ (Tables S1, S2) as shown by their overlaid spectra (Fig. S9). The 1H NMR spectrum of [Fe(PT)]2+, a complex that lacks the methyl substituent in the pendent group, is shown in Fig. S19. This spectrum shows ten proton resonances of equal integrated intensities at both 25 °C and 55 °C with all proton resonances in the diamagnetic region.
The 1H NMR spectra of [Fe(TMPC)]2+ and [Co(TMPC)]2+ in D2O at 25 °C are shown in Figure 4. Nineteen proton resonances are found for [Fe(TMPC)]2+, of which fourteen proton resonances are paramagnetically shifted, while five peaks are located in the diamagnetic region (2.50 ppm to 11.21 ppm at 25 °C) as shown in Fig. S20. Out of these nineteen peaks total, seventeen proton resonances of [Fe(TMPC)]2+ have equivalent integrated intensities, while two other resonances at −52.34 ppm and 2.50 ppm (25 °C) demonstrate 3-fold higher intensity and are assigned to the methyl groups. Similarly, twenty proton resonances are found for [Co(TMPC)]2+, of which sixteen proton resonances are paramagnetically shifted, while four peaks are located in the diamagnetic region (5.10 ppm to 11.89 ppm at 25 °C) of the 1H NMR spectrum (Fig. S28). Eighteen proton resonances of [Co(TMPC)]2+ have equivalent integrated intensities, while two other resonances at −120.45 ppm and 5.10 ppm (25 °C) demonstrate 3-fold higher intensity and are assigned to the methyl groups. The line widths of the 1H NMR resonances of [Fe(TMPC)]2+ and [Co(TMPC)]2+ are summarized in Tables S4, S5.
Figure 4.

1H NMR spectra of (A) [Fe(TMPC)]2+ and (B) [Co(TMPC)]2+ in D2O, pD 7.0–7.4, at 25 °C. Inserts show expanded diamagnetic regions. Solvent peaks are labeled “s”.
To better understand the role of the picolyl pendent, an analog containing simple pyridine pendents ([Fe(TPC)]2+) was studied (Fig. S35). The 1H NMR spectrum of this complex demonstrates nine well-defined proton resonances and one extremely broad shoulder at 30.5–33.5 ppm for a total of ten resonances of equivalent integrated intensity. The 1H NMR spectrum of [Co(TPC)]2+ demonstrates six paramagnetically shifted proton resonances that span from −30 ppm to 190 ppm at 25 °C in D2O (Fig. S36). In this case, the resonances are too broad to accurately integrate.
T1 measurements
Among all complexes studied here, [Co(MPT)]2+ shows the three sharpest proton resonances (49.38 ppm, 33.21 ppm and 5.38 ppm, 25 °C) that have the longest associated longitudinal relaxation times (T1) of 50±1, 38±1, and 102±3 ms, respectively (Table S6). The T1 values for [Fe(MPT)]2+ proton resonances are about two times shorter as compared to the [Co(MPT)]2+ values. The methyl resonance of [Fe(MPT)]2+ and [Co(MPT)]2+ have associated T1 values of 2.4±0.1 and 5.7±0.1 ms, respectively (Table 3). Overall, the T1 values for [Fe(TMPC)]2+ proton resonances are significantly shorter as compared to both [Fe(MPT)]2+ and [Co(MPT)]2+ values (Table S6). The two sharpest peaks of [Fe(TMPC)]2+ at 58.26 ppm and 54.93 ppm demonstrate the longest T1 values of 4.9±0.0 and 9.8±0.1 ms, respectively, among all other hyperfine shifted proton resonances for this complex. On average, the T1 values for [Co(TMPC)]2+ proton resonances are the shortest among all complexes studied here. The methyl resonance of [Co(TMPC)]2+ at −120.45 ppm (25 °C) displays an extremely short T1 value of 0.37±0.01 ms (Table 3).
Table 3.
| Complex | μeff (BM) (j) | Properties of α-CH3 protons | |||||||||
|---|---|---|---|---|---|---|---|---|---|---|---|
| Numb. of equiv. protons | T1 (ms) (j) | Chemical shift (ppm) | CT (ppm/°C) | FWHM (Hz) | |CT|/FWHM (1/°C) (k) | ||||||
| 25 °C | 37 °C | 55 °C | 25 °C | 37 °C | 55 °C | ||||||
| [Fe(MPT)]2+ | 5.7 ± 0.1 | 9 | 2.4 ± 0.1 | 21.22 | 19.79 | 17.92 | −0.11 | 207 | 220 | 237 | 0.25 |
| [Co(MPT)]2+ | 5.8 ± 0.2 | 9 | 5.7 ± 0.1 | 8.03 | 7.80 | 7.52 | −0.02 | 66.5 | 54.9 | 48.5 | 0.16 |
| [Fe(TMPC)]2+ | 5.7 ± 0.1 | 6 | 1.1 ± 0.0 | −52.34 | −49.30 | −45.20 | 0.23 | 458 | 389 | 350 | 0.30 |
| [Co(TMPC)]2+ | 6.0 ± 0.3 | 6 | 0.37 ± 0.01 | −120.45 | −113.73 | −104.66 | 0.52 | 909 | 871 | 859 | 0.30 |
All measurements are performed in D2O solutions, pD 6.9–7.6.
– Values are obtained at 25 °C.
– Linewidths (FWHM) at 37 °C are used for calculations.
CT measurements
The temperature dependence of the 1H NMR resonances was studied for all [M(MPT)]2+ and [M(TMPC)]2+ (M2+ = Fe2+, Co2+) complexes. The stacked plots of 1H NMR spectra for [Fe(MPT)]2+, [Co(MPT)]2+, [Fe(AMPT)]2+, [Fe(TMPC)]2+ and [Co(TMPC)]2+ at 25 to 60 °C in 5 °C increments are shown in Figures S4–S31. The linear fits of the chemical shifts plotted as a function of temperature produce CT values (temperature dependence coefficient of the chemical shift). All CT coefficients are normalized to the linewidths (FWHM) at 37 °C of the corresponding proton resonances giving |CT|/FWHM values. Notably, some proton resonances broadened with temperature, whereas other resonances became sharper as described in the supplementary section.
The methyl resonance of [Fe(MPT)]2+ produces a CT value of −0.11 ppm/°C. The more shifted proton resonances of [Fe(TMPC)]2+ and [Co(TMPC)]2+ demonstrate even greater temperature dependence with the CT values of 0.23 and 0.52 ppm/°C ppm/°C (Table 3). The CT values of [Fe(TMPC)]2+ were also measured in H2O to compare with D2O data. The stacked plot of 1H NMR spectra of [Fe(TMPC)]2+ obtained in H2O using deuterium oxide as an external lock at variable temperature is shown in Figure S27. The value of CT = 0.24 ppm/°C for the methyl resonance of [Fe(TMPC)]2+ obtained in aqueous solution (Fig. S27) is similar, within a 5% error, to the one obtained in deuterium oxide.
The CT values of individual paramagnetically-shifted proton resonances versus their 1H NMR chemical shifts at 37 °C have been plotted for each complex. These plots, based on 1H NMR data of [Fe(MPT)]2+ and [Fe(AMPT)]2+, demonstrate significant non-linearity (Fig. S8, S12), while the plot of [Co(MPT)]2+ data has a more linear character expressed as (Fig. S17). The [Fe(TMPC)]2+ plot also demonstrates a linear dependence according to the expression (Fig. S26). Similarly, the expression is obtained for the [Co(TMPC)]2+ plot (Fig. S34). These linear function expressions allow us to estimate the change in CT values at the temperatures outside of the range studied here (25–60 °C).
pH effects: pH-induced chemical shifts and stability of the complexes
The pH dependence of [Fe(TMPC)]2+ chemical shifts has been studied over the range of pD 4.1–9.8. While the 1H NMR chemical shifts are not pH-dependent over the pD range of 6.0–9.0 units (pH 5.6–8.6), at a low pD of <6.0 there is a strong effect on both paramagnetically-shifted and diamagnetic proton resonances (Fig. S37). This effect alternates for different proton resonances shifting them either closer or farther away from the bulk water signal. In contrast, the proton resonances of [Fe(MPT)]2+ and [Co(MPT)]2+ demonstrate a negligible pH-dependence of their chemical shifts at the range of pD 5.5.0–9.5. Dissociation of complexes was followed by 1H NMR spectroscopy using TMSP as an internal standard. Incubation of solutions of complexes at pD 3.0(1) for 48 hours demonstrated limited dissociation of complexes (Table 4), as detected by the appearance of proton resonances corresponding to the free ligands (Fig. S38, S39).
The complexes studied here demonstrated high kinetic inertness towards biologically relevant anions (PO43−, CO32−) and cations (Zn2+, Ca2+). The most significant dissociation of 6% and 7% was observed for [Co(TMPC)]2+ and [Fe(TMPC)]2+ complexes incubated in anion-rich solutions in D2O (pD 7.0–7.4) at 37 °C for 48 h (Table 4). The product of dissociation is free ligand as detectable by 1H NMR, and the corresponding oxidized metal ions, which form precipitates. The MPT-based complexes are kinetically inert under the conditions of studies and show no evidence of dissociation.
These complexes are also kinetically inert in the presence of serum albumin (Fig. S40). While the diamagnetic regions of the 1H NMR spectra of the complexes are complicated by the proton resonances of the protein (Fig. S40B), there is no loss of intensity, line broadening or chemical shift drifting for the paramagnetic shifted proton resonances, demonstrating the integrity of the metal complexes for 48 h.
DISCUSSION
Our previous efforts in the synthesis of TACN-based Fe(II) complexes for MRI applications gave birth to [Fe(AMPT)]2+ (Scheme 1), a paramagnetic complex with extraordinarily sharp hyperfine-shifted proton resonances in aqueous solution.50 Further studies of the parent [Fe(MPT)]2+ complex with similarly sharp proton resonances demonstrated great stability and kinetic inertness under physiologically relevant conditions.67 The broadly dispersed proton resonances (−20 ppm to 200 ppm) of these complexes also showed pronounced temperature dependence of the chemical shifts (Fig. S4, S10). Thus, we became interested in utilization of transition metal complexes in 1H NMR para-SHIFT thermometry applications. Inspired by the MPT ligand framework, we have extended our approach and incorporated 6-methyl-2-picolyl pendents into 1,4,7,10-tetraazacyclododecane (CYCLEN) for metal coordination. We also considered using other transition metal ions. Since paramagnetic Co(II) complexes are known to produce strongly hyperfine-shifted proton resonances,72 our studies have also included this metal ion.51 Therefore, studies of Fe(II) and Co(II) complexes of TACN and CYCLEN azamacrocycles appended with 6-methyl-2-picolyl arms are presented here.
Scheme 1.

Structural properties of complexes
In this section we aim to demonstrate that 6-methyl-2-picolyl pendents are crucial in controlling both oxidation and spin states of Fe(II) and Co(II) metal ions, as well as in maintaining the high symmetry and rigidity of these complexes. Indeed, the most fascinating result of the crystallographic studies is the structural properties that produce the high-spin state of Fe(II) and Co(II) centers. Certainly, our choice of pyridine donors is important in this regard. The basicity of pyridine derivatives increases from unsubstituted pyridine (pKa = 5.22) to 2-picoline (pKa = 5.96) to 2,6-lutidine (pKa = 6.72).73 Thus, from the standpoint of pKa alone, 6-methyl substitution would make the MPT and TMPC ligands stronger donors. However, the steric effects produced by 6-methyl substituted pyridines, as discussed further below, play a dominant role in facilitating the weak-field ligand character that gives high-spin complexes for both Fe(II) and Co(II).
Indeed, the 6-methyl groups of the three 2-picolyl pendents make a crucial difference in the coordination sphere of TACN-based metal ion complexes. As was demonstrated in earlier studies, the TACN-based [Fe(PT)]2+ complex (Scheme 1) is diamagnetic, and three pyridines of the hexa-coordinate PT ligand bind Fe(II) to give shorter bond lengths of 1.979(6) A for Fe–NPyr.66 The [Fe(MPT)]2+ structures in Figure 1 differ significantly with the Fe–NPyr bond lengths ≥2.209(3) A (Table 2). The same applies to the Fe–NTACN bonds, which are 2.001(6) A and ≥2.216(3) A for [Fe(PT)]2+ and [Fe(MPT)]2+, respectively. The significantly elongated coordination bonds of [Fe(MPT)]2+ are characteristic of the high-spin state of the metal ion center as was shown for other picolyl-appended Fe(II) complexes with tripodal chelates.74 The longer coordination bonds in [Fe(MPT)]2+ are most likely controlled by the steric effects of the 6-methyl substituents that prevent the pyridines from approaching the metal center too closely. Curiously, the redox potentials of the Fe(II) TACN-based complexes are not substantially affected by the pendent group. The redox potential of [Fe(MPT)]2+ (Eo = 930 ± 10 mV vs. NHE) is strongly reducing,67 and it is only slightly lower than that of [Fe(PT)]2 (Eo = 970 ± 5 mV vs. NHE), demonstrating that coordination differences in 2-picolyl versus 6-methyl-2-picolyl do not change the relative stabilization of Fe(II) versus Fe(III) in these complexes.
Given that the 6-methyl-2-picolyl donors favor a metal center with larger ionic radius, we expected these pendents to stabilize Co(II) versus Co(III). Notably, it has been previously shown that Co(II) ion coordinated to PT ligand easily oxidizes (Eo = 0.06 V vs. NHE) to Co(III) under aerobic conditions.75 The ready oxidation of [Co(PT)]2+ is characteristic of Co(II) coordinated by six nitrogen donor atoms.76–78 What is remarkable is that the metal center in the [Co(MPT)]2+ complex cation is stabilized in the divalent state (Fig. 1C). The bond lengths of [Co(MPT)]2+ are typical for Co(II) high-spin as supported by literature values.79 Further examination of the Co–NPyr and Co–NTACN bond lengths, which are ≥2.197(2) A and ≥2.153(2) A, respectively, demonstrates their similarity to the ones observed for the high-spin [Fe(MPT)](CF3SO3)2 (Table 2).
The six-coordinate [Fe(MPT)]2+ and [Co(MPT)]2+ complexes demonstrate compact symmetrical structures. The pendent arms, as well as the macrocyclic backbones have well-defined orientations that produce structures with helical symmetry. As a result, these TACN complexes contain two elements of chirality.26 The [Co(MPT)]2+(NO3)2 is present as an enantiomeric mixture of Λ(λλλ) and Δ(δδδ) isomers with both pendents and backbone elements having the same helicity (Fig. 1C). These enantiomers have identical sets of bond lengths and angles, demonstrating the very rigid nature of the C3-symmetrical [Co(MPT)]2+ crystal structure. The determination of the [Fe(MPT)](CF3SO3)2 crystal structure was more complicated. There are two diastereomers of [Fe(MPT)](CF3SO3)2 found among four crystallographically independent molecules in the crystalline state. These Fe3 – Λ(δδδ) and Fe4 – Λ(λλλ) diastereomers have different helicities of the backbone ethylene units (Fig. 1A–B), even though both of them possess C3-symmetry. Moreover, the Fe1 – Δ(δδδ) and Fe2 – Δ(δδδ) structures are enantiomers to the Fe4 – Λ(λλλ) isomer, and these three structures have similar bond lengths and bond angles. The Fe3 – Λ(δδδ) diastereomer has slightly longer Fe3-NPyr bonds (Table 2), which is a result of the less compact structure due to the opposite helicity of chiral elements. The Fe3 diastereomer is definitely unique, since it has a twist angle of θ = −30.1(9)°, which places this structure exactly in between that of octahedral and trigonal prismatic geometries. The twist angles of 43.4(8)°, 43.6(5)° and −43.7(7)° are found for the other diastereomeric forms, and these Fe1, Fe2 and Fe4 structures, respectively, are described as having a distorted octahedral geometry (Fig. 1). Given that the unique Fe3 diastereromer (Λ(δδδ)) has a more expanded structure, the presence of two diastereomers in the [Fe(MPT)](CF3SO3)2 structure is attributed to the slightly larger ionic radius of Fe(II) compared to Co(II). Finally, the average M-CH3 distances are 3.57(2) A, 3.53(3) A and 3.60(6) A for [Co(MPT)]2+, [Fe4(MPT)]2+, and [Fe3(MPT)]2+, respectively. This information is important for understanding 1H NMR chemical shifts and line broadening of the methyl groups in close proximity to the metal ion center.42
The CYCLEN framework with four 6-methyl-2-picolyl pendent groups contains eight donor nitrogen atoms in the TMPC ligand. Interestingly, the TMPC ligand forms hexa-coordinate C2-symmetrical complexes that maintain both Fe(II) and Co(II) in the divalent states (Fig. 2). Two arms of TMPC complexes are unbound due to the steric effect produced by the 6-methyl substituted pyridines. Indeed, the 6-methyl groups of the coordinated pyridines in the [Fe(TMPC)]2+ and [Co(TMPC)]2+ structures block the direct contact of other donors with the metal ions. In this case, 6-methyl groups make a dramatic difference in the structure as compared with the TPC ligand containing only unsubstituted pyridines (Scheme 1). As was shown previously, all eight donor atoms of [Fe(TPC)]2+ are at least partially coordinated with the two sets of the average Fe-NPyr bond lengths of 2.23(1) A and 3.05(8) A.80 Similar to [Fe(TPC)]2+, the [Co(TPC)]2+ also maintains all four pyridine pendents pointed towards the metal ion center. Two pyridine nitrogen atoms are at 3.18(4) A from the Co(II) center, while two other pyridine nitrogens produce shorter bonds at an average of 2.20(1) A. Thus, only two out of four Fe-NPyr and Co-NPyr distances are assigned to coordination bonds of TPC, while two other distances are significantly elongated, and they are not considered to form a normal coordination bond. For the [Fe(TMPC)]2+ and [Co(TMPC)]2+ complexes, the average M-NPyr bond lengths for the bound 6-methyl-2-picolyls are 2.230 A and 2.192 A, respectively. The unbound pyridine nitrogen atoms are placed at 5.41 A and 5.50 A in [Fe(TMPC)]2+ and [Co(TMPC)]2+, respectively. This shows that the crystal structure of [Fe(TMPC)]2+ is slightly more compact and less elongated in the direction of unbound pendents when compared to [Co(TMPC)]2+ using the overlap of two structures (Fig. S2). The smaller Co(II) ionic radius might be a reason for the more pronounced structural difference between two TMPC-based complexes, while almost no structural differences between Fe(II) and Co(II) structures are found within the same diastereomeric form in the TACN framework (Fig. S1). However, the most interesting structural feature of the TMPC-based complexes is their six-coordinate geometry, where only two pendents form a helical turn around the C2-axis of symmetry. This interesting structural feature makes these complexes rigid as shown below by virtue of the intertwining (interlocking) bound pendent groups. The average M-CH3 distances for the bound pyridines are 3.47 A and 3.48 A for [Fe(TMPC)]2+ and [Co(TMPC)]2+, respectively.
The small values of the twist angles in [Fe(TMPC)]2+ and [Co(TMPC)]2+ complexes (Fig. 2) are consistent with the distorted trigonal prismatic geometry. These complexes are presented by a single Λ(δδδδ)/Δ(λλλλ) diastereomeric form in which the two bound pendents and four macrocycle elements demonstrate different chirality determined by the helicity of the structural elements.59 This differs from the CYCLEN-based Ln(III) complexes that usually have all eight donor groups coordinated to the metal ion, including four bound pendents. Notably, some Ln(III) complexes demonstrate a diastereomeric mixture in solution, as well as in the crystalline state.59,81 The lack of diastereomeric forms in the [Fe(TMPC)]2+ and [Co(TMPC)]2+ structures indicates their preference for a single, presumably low-energy, optimal structural conformation.
Solution Studies
Our aim is to define magnetic and structural properties of Fe(II) and Co(II) complexes in solution that are important for paraSHIFT applications. Notably, the variation in transition metal ion spin state requires additional consideration of the coordination sphere due to pronounced ligand field effects compared to Ln(III) complexes. Moreover, the more substantial covalent character of the coordination bonds in transition metal complexes, as compared to f-elements, makes both dipolar and contact contributions significant in the hyperfine shifted 1H NMR spectra of the macrocycles.47
The 1H NMR spectra of all four MPT and TMPC complexes (Scheme 1) demonstrate sharp paramagnetically shifted proton resonances (Fig. 3, 4). In the case of [Co(MPT)]2+ and [Co(TMPC)]2+, that is indicative of six-coordinate Co(II) high spin (HS) states (3d7, S = 3/2), since the alternative oxidation state of Co(III) (3d6) is diamagnetic. The situation is significantly more complicated with two iron complexes, because three alternative paramagnetic states can exist. Namely, Fe(II) HS, Fe(III) HS, and Fe(III) low spin (LS) complexes are paramagnetic. The Fe(III) HS alternative is ruled out based on the very long electronic relaxation time T1e = 10−4–10−11 s of the symmetrical 3d5 (S = 5/2) state, which produces extreme line broadening in proton NMR spectra.72 Thus, it is unusual to observe proton resonances closer than 5 A to the Fe(III) HS center, and this option is excluded from our considerations. An effective magnetic moment μeff = 5.7 ± 0.1 BM is found for both [Fe(MPT)]2+ and [Fe(TMPC)]2+ complexes (Table 3). In contrast, the magnetic moment of a typical Fe(III) LS (S = 1/2) complex is expected to be μeff ≤ 2.5 BM. Moreover, since Fe(III) LS complexes usually shift proton resonances within a range smaller than 100 ppm, we conclude that the Fe(II) HS state (3d6, S = 2) is produced by both MPT and TMPC ligands. Indeed, the Fe(II) HS state is more likely to produce highly dispersed and less broadened proton resonances since it has the shorter values of T1e = 10−12–10−13 s.72 Low spin Fe(II) is of course easily identified as shown by the 1H NMR (D2O) of [Fe(PT)]2+ which has proton resonances characteristic of diamagnetic metal ion complexes (Fig. S19).
As presented in Table 3, [Co(MPT)]2+ and [Co(TMPC)]2+ have magnetic moments of 5.8 ± 0.2 BM and 6.0 ± 0.3 BM, respectively. These large values of magnetic moments are expected for six-coordinate Co(II) complexes that have significant spin-orbit coupling. Similarly, a substantial orbital contribution is likely responsible for the large magnetic moments of [Fe(MPT)]2+ and [Fe(TMPC)]2+.
Our efforts to assign selected proton resonances of the MPT- and TMPC-based complexes were partially fruitful. While the paramagnetic 1H NMR spectra lack proton coupling information, assignments are aided by the sharp and dispersed proton resonances. Marvelously, the 1H NMR spectra of [Fe(MPT)]2+ and [Co(MPT)]2+ are quite similar and are consistent with their C3-symmetry in solution (Fig. 3). The three sharpest proton resonances of [Co(MPT)]2+ demonstrate the longest longitudinal relaxation times (T1, ms) at 25 °C as listed in Table S3. The narrow line widths, the long T1 values and relatively small chemical shifts suggest these 1H NMR resonances are produced by aromatic pyridine protons. Assignment of γ, β and β′ pyridine protons relative to the nitrogen donor atom, which is bound to paramagnetic metal ion, is presented in Figure 3. Thus, the most remote γ-H with the Co–γ-H distance of 5.91(1) A would be expected to demonstrate the smallest chemical shift and the longest T1 value, if pseudocontact contributions were dominant. The β-H has the Co–β-H distance of 5.30(2) A and shows the furthest shifted resonance with the longer T1 compared to the β′-H, which has the shortest Co–β′-H distance of 4.98(1) A. Indeed, the shorter distances from the Co(II) center to the aromatic protons correlate well with the shorter observed T1 values due to the paramagnetic relaxation enhancement (PRE) effect. Notably, our assignment of aromatic protons is similar to the 6-methyl-2-picolyl-appended tripodal paramagnetic Fe(II) complexes reported previously.74,82 A 2-D 1H-zTOCSY NMR experiment also supports this proton assignment (Fig. S18). For [Co(MPT)]2+, the cross-peaks of the proton resonance at 5.38 ppm with the resonances at 49.38 ppm and 33.21 ppm are the most pronounced, supporting the through-bond γ–β and γ–β′ interactions, respectively. At the same time, the cross-peak for the β–β′ protons’ interaction is less pronounced, which is typical for nuclei that are four bonds apart. The three sharpest proton resonances of [Fe(MPT)]2+, as shown in Figure 3A, with the longest longitudinal relaxation times (25 °C) at 52.14 ppm (T1 = 30±0.3 ms), 33.33 ppm (T1 = 21±1.5 ms) and −4.34 ppm (T1 = 63±1.3 ms) are assigned to the β, β′ and γ aromatic pyridine protons, respectively (Table S1). It is important to note that the γ-H has the longest T1, followed by the β-H, while T1 of the β′-H is the shortest one. This is supported by the fact that, the γ-H pyridine proton is the furthest from the Fe(II) center at the average Fe–γ-H distance of 5.94(6) A for the Λ(λλλ)/Λ(δδδ) diastereomers. While the γ-H is easy to assign due to its small paramagnetic chemical shift as well as T1 relaxation enhancement, the exact assignment of β and β′ is more challenging. However, the assignment of β and β′ protons is confirmed by the comparison of very similar 1H NMR spectra of [Fe(MPT)]2+ and [Fe(AMPT)]2+ in deuterium oxide at 25 °C (Fig. S9). In the AMPT ligand, the β-protons of the pyridines are substituted with the amino groups. Since the chemical shifts of proton resonances for [Fe(MPT)]2+ and [Fe(AMPT)]2+ display variability of less than 5 ppm, the lack of a proton resonance around 50 ppm for [Fe(AMPT)]2+ indicates that this proton is the one substituted with the amino group. Thus, the assignment of an aromatic β-proton at 52.14 ppm (T1 = 30±0.3 ms) for the parent [Fe(MPT)]2+ is supported by the comparison of these two 1H NMR spectra, leaving only one option for β′ proton at 33.33 ppm (T1 = 21±1.5 ms). The T1 values also correlate well with the shorter average Fe–β′-H distance of 5.02(3) A compared to the average Fe–β-H distance of 5.31(7) A. As was stated above, the same applies to the aromatic proton assignment of [Co(MPT)]2+. The proton resonances of [Fe(MPT)]2+ and [Co(MPT)]2+ having three-fold integration intensities and shifted at 21.22 ppm (T1 = 2.4±0.1 ms) and 8.03 ppm (T1 = 5.7±0.1 ms), respectively, are assigned to the α-CH3 groups. Significantly shorter T1 values of the α-CH3 protons, as compared to the ones for the aromatic protons, are consistent with significantly shorter through-space distances of 3.57 A from the methyl carbon atoms to the paramagnetic metal ion centers in both MPT complexes. Since the other six aliphatic proton resonances of [Fe(MPT)]2+ demonstrate significantly shorter T1 values (Table S1), it is challenging to make an assignment of all methylene protons using 2-D NMR techniques. Similarly, shorter T1 values of [Co(MPT)]2+ complicate assignment of distinct aliphatic protons of TACN and pendant methylene groups. Thus, assignment of aromatic pyridine protons and methyl groups in the MPT-based complexes is accomplished based on the chemical shift of 1H NMR resonances in conjunction with their integration intensity, line widths, T1 values, 2-D 1H-zTOCSY NMR cross-peaks, as well as by examining distances in the crystal structures.
The 1H NMR spectra of [Fe(TMPC)]2+ and [Co(TMPC)]2+ in Figure 4 are consistent with six-coordinate C2-symmetrical complex structures in solution, where metal ion centers are bound to four CYCLEN nitrogen atoms and only two 2-picolyl nitrogen donors. Thus, solution structures seem to be similar to the ones found in the solid state. Two highly-shifted sharp proton resonances of [Fe(TMPC)]2+, which also display longer T1 values, at 58.26 ppm and 54.93 ppm are tentatively assigned to the aromatic protons of bound 6-methyl-2-picolyl pendants. The third aromatic proton cannot be assigned due to line broadening, which makes its signal indistinguishable from the aliphatic proton resonances. Similarly, the highly-shifted, sharp proton resonances with longer T1 values of [Co(TMPC)]2+ at 132.69 ppm and 76.35 ppm may be assigned as aromatic protons. The methyl resonances are shifted to −52.34 ppm and −120.45 ppm for [Fe(TMPC)]2+ and [Co(TMPC)]2+, respectively. Since both complexes demonstrate a variety of broadened proton resonances with shortened T1 values, it is challenging to make precise assignments for the 1H NMR spectra, other than the two methyl groups.
In addition to providing intense resonances for paraSHIFT applications, the 6-methyl-2-picolyl pendents minimize fluxionality of the TMPC-based complexes as compared to unsubstituted 2-picolyl pendents. This is observed in the 1H NMR spectra of [Fe(TPC)]2+ and [Co(TPC)]2+, which demonstrate broadened proton resonances due to structural fluxionality which is likely resultant from the competing coordination of eight donor groups (Fig. S35, S36). For MPT, the methyl group lengthens the metal bond to the pyridine nitrogen to produce high-spin Fe(II) or Co(II).
The 1H NMR spectra of the two Co(II) complexes are remarkably different in appearance. The 1H NMR spectrum of [Co(TMPC)]2+ spans the largest range at −120 ppm to 320 ppm at 25 °C, but also demonstrates the most broadened resonances at 25 °C (Table S5). In comparison, [Co(MPT)]2+ demonstrates proton resonances with the narrowest line widths at 25 °C. This difference may be due, in part, to the very rigid nature of the [Co(MPT)]2+ complex and lack of dynamic processes as discussed below. However, there is a notable difference in the longitudinal relaxation times (T1) of [Co(TMPC)]2+ protons which are 1–2 orders of magnitude shorter than the T1 values observed for [Co(MPT)]2+ (Table 3). As a result, it is expected that transverse relaxation times (T2) of the [Co(TMPC)]2+ individual protons are also significantly shorter than that of the [Co(MPT)]2+. In this case, the shorter T2 relaxation times may be responsible, at least partially, for the line broadening of the [Co(TMPC)]2+ proton resonances. These short T1 and T2 values of the [Co(TMPC)]2+ protons may be a result of the longer electronic relaxation time (T1e) of the Co(II) center given that the proton relaxation enhancement (PRE) is normally dominated by the T1e for low molecular weight complexes.46,72 The complicated nature of electron spin relaxation processes in transition metal ions necessitates detailed experimental and theoretical studies for further elucidation of these observations.53,61 However, it is well known that the T1e values of Co(II) complexes change dramatically with coordination number and geometry. Thus, five-/six-coordinate Co(II) complexes are in the range of T1e = 5 × 10⁻¹² – 10−13 s, but complexes of lower coordination numbers are known exhibit slower electronic relaxation times of T1e ≥ 10−11 s.72 Similarly, longer magnetic relaxation of 1.5 × 10⁻⁶ s has been reported for the eight-coordinate Co(II) complex of a distorted square antiprism geometry.83 Further studies will be necessary to better understand the [Co(TMPC)]2+ complex and the relaxation processes responsible for the much greater PRE.
Analogously, the appearance of the 1H NMR spectra of the two Fe(II) complexes are quite different (Fig. 3A and 4A). Once again, the TMPC complex demonstrates the larger dispersion in proton resonances in comparison to the MPT analog. However, the peak widths of the proton resonances are not very different for [Fe(MPT)]2+ and [Fe(TMPC)]2+ at 25 °C (Table S1, S4). This is despite the fact that the T1 values of [Fe(MPT)]2+ are about one order of magnitude longer (on average) than those observed for the [Fe(TMPC)]2+ proton resonances.
Another interesting feature of these complexes is that certain resonances become broadened while others become narrower with the temperature increase. For example, the highly-shifted aliphatic proton resonances of [Fe(MPT)]2+ at 70–195 ppm become broadened (Fig. S5), while the β′-H and γ-H resonances become sharper at elevated temperatures. The [Fe(TMPC)]2+ complex also demonstrates proton resonances at 140–275 ppm that broaden with increasing temperature, while other resonances exhibit a decrease in FWHM with temperature increase. One possible explanation would be fluxional processes that broaden or sharpen different resonances upon temperature increase according to the frequency difference of the interconverting protons. However, alternate explanations are possible, given the number of unknown variables including mixing in of different excited states or even additional conformers that have different PRE. Similar observations are made for the line-broadening of different proton resonances of [Co(MPT)]2+ and [Co(TMPC)]2+. The line broadening effects appear to be the most dramatic (up to three-fold line width change in Hz) for the [Co(MPT)]2+ resonances when raising temperature from 25 to 60 °C. However, even for this complex, some aliphatic proton resonances become sharper with temperature increase. These temperature dependent changes in peak width of the proton resonances may be caused by several factors. This includes electronic relaxation times that are temperature dependent.61 Alternatively, certain hyperfine-shifted protons with T2 relaxivities dominated by Curie spin relaxation mechanisms such as iron(II) heme protons are proportional to T−3 and thus become narrower with an increase in temperature.43 An additional important consideration in interpretation of proton resonance peak widths in macrocyclic complexes are dynamic processes.57,59,84
Variable temperature NMR studies show a shift in proton resonances with temperature and some changes in resonance peak width. However, over the temperature range studied here, there is no evidence of multiple isomers and their dynamic interconversion by NMR spectroscopy. Potential dynamic processes would involve the interconversion between stereoisomers of the complexes. The Fe(II) and Co(II) complexes of MPT have four potential isomers that arise from the two chiral elements in the pendent group directionality and the macrocycle backbone helicity. Of the four isomers, two have an enantiomeric relationship and two have a diastereomeric relationship.85 This is observed in the solid state especially for [Fe(MPT)]2+ where both Fe4 – Λ(λλλ) and Fe3 – Λ(δδδ) diastereomers are present. It is known that dynamic processes may interconvert both enantiomers and diastereomers in solution.85 Yet in solutions of [Fe(MPT)]2+, [Fe(AMPT)]2+ or [Co(MPT)]2+, the number of proton resonances is consistent with a single diastereomeric form and there is no evidence of a second diastereomer. Dynamic interconversion between enantiomers has been shown to produce line broadening in variable temperature NMR studies.84 The same dynamic processes could potentially occur for interconversion between the Λ(δδδδ) and Λ(λλλλ) diastereomers of the TMPC-based complexes. In fact, such switching of helicity by interconversion of four different diastereomeric/enantiomeric structures has been previously observed by 1H NMR spectroscopy for other metal complexes.36,57 Also, structural fluxionality of TMPC-based complexes might arise from the dynamic behavior of two pairs of 2-picolyl pendents if they bind metal ion center in an on and off manner, producing a structure with “dancing pendents” on the time scale much faster than that of NMR. This dynamic model might explain the broadened proton resonances of [Co(TMPC)]2+, where absolutely all proton resonances, including diamagnetic region, are effected by the metal ion, as demonstrated by enhanced chemical shifts, PRE and short T1 values.
Studies of ParaSHIFT Properties for Thermometry and Complex Stability
Obtaining accurate and sensitive temperature measurements relies on both hyperfine chemical shift and line intensity. Thus structures of high symmetry with large number of identical and narrow proton resonances are preferable for paraSHIFT applications.36,45 Since the methyl protons of the MPT- and TMPC-based complexes produce three-fold higher integrated intensity, we examined their potential use for paraSHIFT thermometry. For MPT complexes, this gives nine methyl protons, while TMPC-based complexes have only six equivalent methyl protons. The methyl groups of [Co(TMPC)]2+ are the most shifted, while the [Co(MPT)]2+ methyl protons are found in diamagnetic region (Table 3). However, as was discussed earlier, [Co(TMPC)]2+ demonstrates significant line broadening. Thus, careful comparison of the temperature dependent 1H NMR properties of these Fe(II) and Co(II) complexes for the thermometry applications should be made, including line width analysis and temperature dependence of chemical shifts.
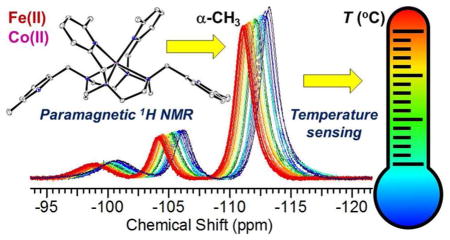
In paramagnetic complexes, the temperature dependence of proton chemical shifts is determined by a Fermi contact term involving T−1 and pseudocontact terms containing T−1 and T−2,86,87 which generally results in a simple inverse relationship between chemical shift and temperature for over a limited temperature range.27,29,32 Together, this paramagnetic interaction has a dominant effect on the chemical shift itself, as well as its temperature dependence. In other words, the most shifted proton resonances are expected to demonstrate the most pronounced temperature dependence of the corresponding chemical shifts. However, more efficient relaxation and, as a result, broader lines are typical for the most highly shifted proton resonances. The chemical shifts and the line widths of the methyl proton resonances as a function of temperature for all four complexes are summarized in Table 3. Remarkably, the line widths of methyl protons become sharper for [Co(MPT)]2+, [Co(TMPC)]2+ and [Fe(TMPC)]2+ with the temperature increase (25 to 55 °C), while the methyl resonance of [Fe(MPT)]2+ is only slightly broadened. The linear fits of the chemical shift versus temperature (Fig. 5A) give the temperature-dependent coefficients (CT) tabulated in Table 3. The highest CT value of 0.52 ppm/°C is observed for [Co(TMPC)]2+, while 0.23 ppm/°C, −0.11 ppm/°C, and −0.02 ppm/°C are also obtained from the linear fits for [Fe(TMPC)]2+, [Fe(MPT)]2+, and [Co(MPT)]2+, respectively. The methyl peak of [Co(MPT)]2+ is excluded from further consideration due to its small chemical shift. Given the greater shifts of methyl proton resonances of [Co(TMPC)]2+ and [Fe(TMPC)]2+, these two complexes are promising for in vivo studies. When the CT values are normalized for the proton line widths (FWHM), the obtained values are 0.30 °C−1 for both TMPC-based complexes (Table 3). Indeed, as shown by the overlaid methyl resonance of [Co(TMPC)]2+ in Figure 5B, this signal can serve as a temperature reporter in the biological range of 37–41 °C with at least 0.2 °C− resolution. These CT values and temporal resolution are comparable to the first generation of Ln(III) MRS agents.29,32,33 The |CT|/FWHM of the [Fe(MPT)]2+ methyl groups is 0.16 °C−1. Therefore, the [Fe(MPT)]2+ complex which demonstrates smaller changes in the hyperfine shifted resonances with temperature can function as a paraSHIFT agent for thermometry due to its narrower line widths. Another important feature of the temperature-dependent methyl resonances is that their line widths become narrower, or experience very slight line broadening when temperature is increased from 25 to 55 °C (Table 3). This is a unique feature, since the proton resonances of Ln(III) agents are known to broaden significantly.33 On the other hand, as required for paraSHIFT, the T1 values of the methyl protons are sufficiently short (0.37–2.4 ms), which allows for fast acquisition times. Thus, the 10 mM solution of [Fe(TMPC)]2+ in serum albumin (35 mg/mL) gives 1H NMR spectra with excellent signal-to-noise ratios when collected within only 12 seconds (Fig. S40C). The T1 = 1.1±0.0 ms of the [Fe(TMPC)]2+ methyl allowed us to collect spectra with the delay time (d1) of 10 ms, as shown in Figure S41. When 1H NMR data was collected in serum albumin within the 30 to 60 °C temperature range with a d1 of 40 ms, the CT value of 0.52 ppm/°C was obtained (Fig. S40D), which corresponds to the one measured in buffer (Table 3). Clearly, such fast data acquisition is only possible due to the short T1 value of the methyl protons. Moreover, the complexes stay intact while incubated with serum albumin for over 48 h (Table 4).
Figure 5.

(A) 1H NMR temperature dependence of α-CH3 chemical shift of [Fe(MPT)]2+ (●), [Co(MPT)]2+ (○), [Fe(TMPC)]2+ (▼) and [Co(TMPC)]2+ (Δ). Solid lines represent linear fits of the data. (B) 1H NMR overlaid plot: Temperature dependence of α-CH3 chemical shift of [Co(TMPC)]2+ in the range 37–41 °C.
Inspection of the temperature dependences for all resonances of the four complexes shows a promising and very sharp proton resonance at 53.43 ppm which shows little line broadening (FWHM = 71 Hz at 37 °C) of [Fe(TMPC)]2+ with |CT|/FWHM = 0.84 °C−1 (Fig. S20 and Table S4). Also promising are the most shifted proton resonances of [Fe(MPT)]2+ and [Co(MPT)]2+ which demonstrate large |CT|/FWHM values of 1.28 °C−1 and 3.24 °C−1, respectively and narrow line widths. While these |CT|/FWHM values of Fe(II) and Co(II) complexes are comparable with the best Ln(III) proton resonances, these signals lack high intensity due to the small number of identical protons.
There is no observable pH effect on the chemical shifts of the MPT-based complexes. On the other hand, the 1H NMR resonances of [Fe(TMPC)]2+ change their chemical shifts at pD ≤ 6.0 (Fig S37). This effect might be explained by protonation of the unbound 6-methyl-2-picolyl groups of [Fe(TMPC)]2+. That, in turn, results in alterations of the molecular geometry and, consequently, changes the relative contact and pseudocontact shifts. The fact that chemical shifts of MPT- and TMPC-based complexes are not affected within the biologically-relevant pH range of 6.5–7.5 is an advantage for use of these complexes for thermometry. In fact, the pH-independent properties of chemical shifts are unique for these complexes, since the majority of the Ln(III) MRS probes demonstrate dual pH and temperature dependence.38,44
Over extended periods of incubation (48 h) of these complexes at the lower pD 3.0(1) at 37 °C, partial dissociation of the complexes was observed with the most pronounced decomposition found for [Co(TMPC)]2+ (8%) and [Co(MPT)]2+ (6%). As was reported previously, only 2% of [Fe(MPT)]2+ dissociates at pD 3.9 after 48 h.67 Moreover in contrast to Ln(III) complexes, no changes in chemical shifts or line broadening is observed for these Fe(II) and Co(II) complexes when incubated in the presence of Ca2+ or Zn2+. Clearly, the cationic nature of these complexes prevents interactions with other cationic species. In contrast, the TMPC complexes demonstrate some slight dissociation in the presence of biologically relevant anions, as listed in Table 5.
The dependences of the CT values on chemical shifts are linear for the most part when plotted for [Co(MPT)]2+, [Fe(TMPC)]2+ and [Co(TMPC)]2+ (Fig. S17, S26, S34). The slight non-linearity found in these plots might be explained by protons having different relative contributions of contact versus dipolar paramagnetic induced chemical shifts. This observation differs from that of the Ln(III) complexes used for thermometry which have dominant dipolar contributions and typically have a linear dependence of CT values on chemical shifts.29
SUMMARY AND CONCLUSIONS
With an eye towards biomedical imaging applications, we have prepared paramagnetic Fe(II) and Co(II) complexes which are water- and air-stable. In our studies, both TACN and CYCLEN azamacrocyclic frameworks have been successfully employed for the coordination of metal ions. Moreover, the 6-methyl-2-picolyl pendents are found to be crucial for maintaining the divalent oxidation states and high-spin states of the metal ion centers. These pendents provide steric hindrance arising from the 6-methyl substituent. As a result, the M–NPyr bonds (M2+ = Fe2+, Co2+) are significantly elongated compared to the metal ion complexes that are appended with unsubstituted 2-picolyl donor groups. The exceptionally rigid and highly dispersed proton resonances of the MPT- and TMPC-based complexes make them excellent candidates for paraSHIFT applications.
The crystal structures of the MPT-based complexes show six-coordinate and C3-symmtrical geometries, which are also consistent with the observed solution structures. While a single diastereomeric form is present in aqueous solution, two diastereomers, Fe4 – Λ(λλλ) and Fe3 – Λ(δδδ), are found in the [Fe(MPT)]2+ crystal structure. The crystal structure of [Co(MPT)]2+ consists of a single diastereomeric form. The structures of both [Fe(TMPC)]2+ and [Co(TMPC)]2+ are six-coordinate and C2-symmetrical with two unbound 6-methyl-2-picolyl arms. Both structures are present in a single diastereomeric form in the solid and solution state. Interestingly, the MPT complexes demonstrate distorted octahedral geometries, while the TMPC complexes are best described as distorted trigonal prismatic structures.
Large temperature dependences of proton chemical shifts are observed for the metal complexes studied here. In terms of MRS applications, the narrowest resonances of higher intensities are important for the improved sensitivity of paraSHIFT agents. Thus, the narrow proton resonances of the methyl groups, which demonstrate no line broadening at elevated temperatures up to 60 °C, are considered for paraSHIFT applications. The most promising methyl resonances of [Fe(TMPC)]2+ and [Co(TMPC)]2+ demonstrate CT values of 0.23 and 0.52 ppm/°C, respectively. Other highly shifted proton resonances demonstrate temperature dependences with CT values up to −1.10 ppm/°C. The chemical shifts of these complexes are solely dependent on temperature and are independent of pH 5.6–8.6 and Ca2+ concentration. Notably, based on the present work, further 6-substitution of 2-picolyl donors with trifluoromethyl groups is synthetically feasible towards 19F-based paraSHIFT agents. Moreover, given that functional groups containing exchangeable protons can be introduced at the β, β′ and γ sites of the 6-methyl-2-picolyl pendents,50 these complexes may be developed for dual paraCEST/paraSHIFT temperature mapping.26,88
The exceptional stability and kinetic inertness of aza-macrocyclic complexes has led to the development of many promising MRI agents. As shown here, the same applies to Fe(II) and Co(II) paraSHIFT agents. Thus, TACN and CYCLEN are two promising azamacrocyclic scaffolds. Much needs to be learned about optimal placement of the reporter protons for MR spectroscopy, since transition metal ions demonstrate, in addition to the dipolar term, strong contact contributions to paramagnetic chemical shift enhancement and PRE. It is important to undertake the study of this problem and understand more about proton relaxivities (T1 and T2), electronic relaxation (T1e) of the metal ion centers, as well as structural properties and fluxionality.
Supplementary Material
Acknowledgments
JRM thanks the NIH (CA175858)) and NSF (CHE-1310374) for support of this work.
Footnotes
ASSOCIATED CONTENT
Supporting Information: Methods, NMR spectra, and additional crystal structure data. This material is available free of charge via the Internet at http://pubs.acs.org.
References
- 1.Datta NR, Ordonez SG, Gaipl US, Paulides MM, Crezee H, Gellermann J, Marder D, Puric E, Bodis S. Cancer Treat Rev. 2015;41:742. doi: 10.1016/j.ctrv.2015.05.009. [DOI] [PubMed] [Google Scholar]
- 2.Wust P, Hildebrandt B, Sreenivasa G, Rau B, Gellermann J, Riess H, Felix R, Schlag PM. Lancet Oncol. 2002;3:487. doi: 10.1016/s1470-2045(02)00818-5. [DOI] [PubMed] [Google Scholar]
- 3.Waterman FM. In: Thermoradiotherapy and Thermochemotherapy. Seegenschmiedt MH, Fessenden P, Vernon C, editors. Springer; Berlin Heidelberg: 1995. p. 331. [Google Scholar]
- 4.Quesson B, de Zwart JA, Moonen CTW. J Magn Reson Imaging. 2000;12:525. doi: 10.1002/1522-2586(200010)12:4<525::aid-jmri3>3.0.co;2-v. [DOI] [PubMed] [Google Scholar]
- 5.Orenstein A, Kostenich G, Tsur H, Kogan L, Malik Z. Cancer Lett. 1995;93:227. doi: 10.1016/0304-3835(95)03814-d. [DOI] [PubMed] [Google Scholar]
- 6.Young CC, Sladen RN. Int Anesthesiol Clin. 1996;34:149. doi: 10.1097/00004311-199603430-00009. [DOI] [PubMed] [Google Scholar]
- 7.Brugge J, Poon PF, So AP, Wu BM, Chan FY, Lam FK. Exp Brain Res. 1995;106:7. doi: 10.1007/BF00241352. [DOI] [PubMed] [Google Scholar]
- 8.Bertsch F, Mattner J, Stehling MK, Müller-Lisse U, Peller M, Loeffler R, Weber Ju, Mesmer K, Wilmanns W, Issels R, Reiser M. Magn Reson Imaging. 1998;16:393. doi: 10.1016/s0730-725x(97)00311-1. [DOI] [PubMed] [Google Scholar]
- 9.Rieke V, Butts Pauly K. J Magn Reson Imaging. 2008;27:376. doi: 10.1002/jmri.21265. [DOI] [PMC free article] [PubMed] [Google Scholar]
- 10.Hildebrandt B, Wust P, Ahlers O, Dieing A, Sreenivasa G, Kerner T, Felix R, Riess H. Crit Rev Oncol Hemat. 2002;43:33. doi: 10.1016/s1040-8428(01)00179-2. [DOI] [PubMed] [Google Scholar]
- 11.McDannold N, Fossheim SL, Rasmussen H, Martin H, Vykhodtseva N, Hynynen K. Radiology. 2004;230:743. doi: 10.1148/radiol.2303021713. [DOI] [PubMed] [Google Scholar]
- 12.Frich L, Bjornerud A, Fossheim S, Tillung T, Gladhaug I. Magn Reson Med. 2004;52:1302. doi: 10.1002/mrm.20289. [DOI] [PubMed] [Google Scholar]
- 13.Lindner LH, Reinl HM, Schlemmer M, Stahl R, Peller M. Int J Hyperther. 2005;21:575. doi: 10.1080/02656730500158410. [DOI] [PubMed] [Google Scholar]
- 14.Ponce AM, Viglianti BL, Yu D, Yarmolenko PS, Michelich CR, Woo J, Bally MB, Dewhirst MW. J Natl Cancer Inst. 2007;99:53. doi: 10.1093/jnci/djk005. [DOI] [PubMed] [Google Scholar]
- 15.Wang T, Hossann M, Reinl HM, Peller M, Eibl H, Reiser M, Issels RD, Lindner LH. Contrast Media Mol Imaging. 2008;3:19. doi: 10.1002/cmmi.226. [DOI] [PubMed] [Google Scholar]
- 16.Sanino A, Dastru W, Mainini F, Castelli DD, Aime S, Terreno E. J Biomed Nanotechnol. 2014;10:1620. doi: 10.1166/jbn.2014.1833. [DOI] [PubMed] [Google Scholar]
- 17.Terreno E, Castelli DD, Cravotto G, Milone L, Aime S. Invest Radiol. 2004;39:235. doi: 10.1097/01.rli.0000116607.26372.d0. [DOI] [PubMed] [Google Scholar]
- 18.Zhang S, Malloy CR, Sherry AD. J Am Chem Soc. 2005;127:17572. doi: 10.1021/ja053799t. [DOI] [PMC free article] [PubMed] [Google Scholar]
- 19.Li AX, Wojciechowski F, Suchy M, Jones CK, Hudson RHE, Menon RS, Bartha R. Magn Reson Med. 2008;59:374. doi: 10.1002/mrm.21482. [DOI] [PubMed] [Google Scholar]
- 20.Delli Castelli D, Terreno E, Aime S. Angew Chem Int Ed. 2011;50:1798. doi: 10.1002/anie.201007105. [DOI] [PubMed] [Google Scholar]
- 21.McVicar N, Li AX, Suchy M, Hudson RHE, Menon RS, Bartha R. Magn Reson Med. 2013;70:1016. doi: 10.1002/mrm.24539. [DOI] [PubMed] [Google Scholar]
- 22.Jeon IR, Park JG, Haney CR, Harris TD. Chem Sci. 2014;5:2461. [Google Scholar]
- 23.De Senneville DB, Quesson B, Moonen CTW. Int J Hyperther. 2005;21:515. doi: 10.1080/02656730500133785. [DOI] [PubMed] [Google Scholar]
- 24.Vescovo E, Levick A, Childs C, Machin G, Zhao S, Williams SR. NMR Biomed. 2013;26:213. doi: 10.1002/nbm.2840. [DOI] [PubMed] [Google Scholar]
- 25.Bainbridge A, Kendall GS, Vita ED, Hagmann C, Kapetanakis A, Cady EB, Robertson NJ. NMR Biomed. 2013;26:416. doi: 10.1002/nbm.2879. [DOI] [PubMed] [Google Scholar]
- 26.Tsitovich PB, Morrow JR. Inorg Chim Acta. 2012;393:3. [Google Scholar]
- 27.Aime S, Botta M, Fasano M, Terreno E, Kinchesh P, Calabi L, Paleari L. Magn Reson Med. 1996;35:648. doi: 10.1002/mrm.1910350504. [DOI] [PubMed] [Google Scholar]
- 28.Zuo CS, Bowers JL, Metz KR, Nosaka T, Sherry AD, Clouse ME. Magn Reson Med. 1996;36:955. doi: 10.1002/mrm.1910360619. [DOI] [PubMed] [Google Scholar]
- 29.Zuo CS, Metz KR, Sun Y, Sherry AD. J Magn Reson. 1998;133:53. doi: 10.1006/jmre.1998.1429. [DOI] [PubMed] [Google Scholar]
- 30.Hentschel M, Wust P, Wlodarczyk W, Frenzel T, Sander B, Hosten N, Felix R. Int J Hyperther. 1998;14:479. doi: 10.3109/02656739809018249. [DOI] [PubMed] [Google Scholar]
- 31.Sun Y, Sugawara M, Mulkern RV, Hynynen K, Mochizuki S, Albert M, Zuo CS. NMR Biomed. 2000;13:460. doi: 10.1002/nbm.676. [DOI] [PubMed] [Google Scholar]
- 32.Hekmatyar SK, Poptani H, Babsky A, Leeper DB, Bansal N. Int J Hyperther. 2002;18:165. doi: 10.1080/02656730110098598. [DOI] [PubMed] [Google Scholar]
- 33.Hekmatyar SK, Hopewell P, Pakin SK, Babsky A, Bansal N. Magn Reson Med. 2005;53:294. doi: 10.1002/mrm.20345. [DOI] [PubMed] [Google Scholar]
- 34.Hekmatyar SK, Kerkhoff RM, Pakin SK, Hopewell P, Bansal N. Int J Hyperther. 2005;21:561. doi: 10.1080/02656730500133801. [DOI] [PubMed] [Google Scholar]
- 35.Graedel NN, Polimeni JR, Guerin B, Gagoski B, Wald LL. Magn Reson Med. 2015;73:442. doi: 10.1002/mrm.25123. [DOI] [PMC free article] [PubMed] [Google Scholar]
- 36.Harvey P, Blamire AM, Wilson JI, Finney KLNA, Funk AM, Senanayake PK, Parker D. Chem Sci. 2013;4:4251. [Google Scholar]
- 37.Milne M, Hudson RHE. Chem Commun. 2011;47:9194. doi: 10.1039/c1cc13073k. [DOI] [PubMed] [Google Scholar]
- 38.Huang Y, Coman D, Ali MM, Hyder F. Contrast Media Mol Imaging. 2015;10:51. doi: 10.1002/cmmi.1604. [DOI] [PMC free article] [PubMed] [Google Scholar]
- 39.Chalmers KH, De Luca E, Hogg NHM, Kenwright AM, Kuprov I, Parker D, Botta M, Wilson JI, Blamire AM. Chem Eur J. 2010;16:134. doi: 10.1002/chem.200902300. [DOI] [PubMed] [Google Scholar]
- 40.Harvey P, Kuprov I, Parker D. Eur J Inorg Chem. 2012;2012:2015. [Google Scholar]
- 41.Neil ER, Funk AM, Yufit DS, Parker D. Dalton Trans. 2014;43:5490. doi: 10.1039/c3dt53000k. [DOI] [PubMed] [Google Scholar]
- 42.Geraldes CFGC, Luchinat C. Met Ions Biol Syst. 2003;40:513. [PubMed] [Google Scholar]
- 43.Johnson ME, Fung LWM, Ho C. J Am Chem Soc. 1977;99:1245. doi: 10.1021/ja00446a041. [DOI] [PubMed] [Google Scholar]
- 44.Coman D, Trubel HK, Rycyna RE, Hyder F. NMR Biomed. 2009;22:229. doi: 10.1002/nbm.1312. [DOI] [PMC free article] [PubMed] [Google Scholar]
- 45.Coman D, Trubel HK, Hyder F. NMR Biomed. 2010;23:277. doi: 10.1002/nbm.1461. [DOI] [PMC free article] [PubMed] [Google Scholar]
- 46.Bertini I, Turano P, Vila AJ. Chem Rev. 1993;93:2833. [Google Scholar]
- 47.Wicholas ML, Drago RS. J Am Chem Soc. 1969;91:5963. [Google Scholar]
- 48.Heise H, Kohler FH, Herker M, Hiller W. J Am Chem Soc. 2002;124:10823. doi: 10.1021/ja020026l. [DOI] [PubMed] [Google Scholar]
- 49.Liu K, Ryan D, Nakanishi K, McDermott A. J Am Chem Soc. 1995;117:6897. [Google Scholar]
- 50.Dorazio SJ, Tsitovich PB, Siters KE, Spernyak JA, Morrow JR. J Am Chem Soc. 2011;133:14154. doi: 10.1021/ja204297z. [DOI] [PMC free article] [PubMed] [Google Scholar]
- 51.Tsitovich PB, Spernyak JA, Morrow JR. Angew Chem Int Ed. 2013;125:14247. doi: 10.1002/anie.201306394. [DOI] [PMC free article] [PubMed] [Google Scholar]
- 52.Dorazio S, Olatunde A, Tsitovich P, Morrow J. J Biol Inorg Chem. 2014;19:191. doi: 10.1007/s00775-013-1059-4. [DOI] [PMC free article] [PubMed] [Google Scholar]
- 53.Rastrelli F, Bagno A. Chem Eur J. 2009;15:7990. doi: 10.1002/chem.200802443. [DOI] [PubMed] [Google Scholar]
- 54.Viswanathan S, Kovacs Z, Green KN, Ratnakar SJ, Sherry AD. Chem Rev. 2010;110:2960. doi: 10.1021/cr900284a. [DOI] [PMC free article] [PubMed] [Google Scholar]
- 55.Funk AM, Harvey P, Finney KLNA, Fox MA, Kenwright AM, Rogers NJ, Senanayake PK, Parker D. Phys Chem Chem Phys. 2015;17:16507. doi: 10.1039/c5cp02210j. [DOI] [PubMed] [Google Scholar]
- 56.Geraldes CFGC, Marques MPM, Sherry AD. Inorg Chim Acta. 1998;273:288. [Google Scholar]
- 57.Aime S, Botta M, Ermondi G. Inorg Chem. 1992;31:4291. [Google Scholar]
- 58.Schlager O, Wieghardt K, Grondey H, Rufinska A, Nuber B. Inorg Chem. 1995;34:6440. [Google Scholar]
- 59.Howard JAK, Kenwright AM, Moloney JM, Parker D, Port M, Navet M, Rousseau O, Woods M. Chem Commun. 1998:1381. [Google Scholar]
- 60.Yang CT, Sreerama SG, Hsieh WY, Liu S. Inorg Chem. 2008;47:2719. doi: 10.1021/ic7022506. [DOI] [PubMed] [Google Scholar]
- 61.Tierney DL. J Phys Chem A. 2012;116:10959. doi: 10.1021/jp309245e. [DOI] [PubMed] [Google Scholar]
- 62.Bertini I, Luchinat C, Parigi G, Pierattelli R. ChemBioChem. 2005;6:1536. doi: 10.1002/cbic.200500124. [DOI] [PubMed] [Google Scholar]
- 63.Dolomanov OV, Bourhis LJ, Gildea RJ, Howard JAK, Puschmann H. J Appl Crystallogr. 2009;42:339. doi: 10.1107/S0021889811041161. [DOI] [PMC free article] [PubMed] [Google Scholar]
- 64.Bourhis LJ, Dolomanov OV, Gildea RJ, Howard JAK, Puschmann H. Acta Crystallogr Sect A. 2015;71:59. doi: 10.1107/S2053273314022207. [DOI] [PMC free article] [PubMed] [Google Scholar]
- 65.Sheldrick G. Acta Crystallogr Sect A. 2008;64:112. doi: 10.1107/S0108767307043930. [DOI] [PubMed] [Google Scholar]
- 66.Christiansen L, Hendrickson DN, Toftlund H, Wilson SR, Xie CL. Inorg Chem. 1986;25:2813. [Google Scholar]
- 67.Dorazio SJ, Tsitovich PB, Gardina SA, Morrow JR. J Inorg Biochem. 2012;117:212. doi: 10.1016/j.jinorgbio.2012.06.007. [DOI] [PubMed] [Google Scholar]
- 68.Evans DF. J Chem Soc. 1959:2003. [Google Scholar]
- 69.Grant DH. J Chem Educ. 1995;72:39. [Google Scholar]
- 70.Piguet C. J Chem Ed. 1997;74:815. [Google Scholar]
- 71.Schubert EM. J Chem Educ. 1992;69:62. [Google Scholar]
- 72.Bertini I, Luchinat C, Parigi G. Solution NMR of paramagnetic molecules : applications to metallobiomolecules and models. Elsevier; Amsterdam [etc.]: 2001. [Google Scholar]
- 73.Kirk-Othmer concise encyclopedia of chemical technology. 4. Vol. 20 New York: Wiley; 1999. [Google Scholar]
- 74.Zang Y, Kim J, Dong Y, Wilkinson EC, Appelman EH, Que L. J Am Chem Soc. 1997;119:4197. [Google Scholar]
- 75.Wieghardt K, Schoeffmann E, Nuber B, Weiss J. Inorg Chem. 1986;25:4877. [Google Scholar]
- 76.Lawrance GA, Lay PA, Sargeson AM. Inorg Chem. 1990;29:4808. [Google Scholar]
- 77.Comba P, Sickmuller AF. Inorg Chem. 1997;36:4500. doi: 10.1021/ic9701625. [DOI] [PubMed] [Google Scholar]
- 78.Bernhardt PV, Chen KI, Sharpe PC. J Biol Inorg Chem. 2006;11:930. doi: 10.1007/s00775-006-0148-z. [DOI] [PubMed] [Google Scholar]
- 79.Massoud SS, Perkins RS, Louka FR, Xu W, Le Roux A, Dutercq Q, Fischer RC, Mautner FA, Handa M, Hiraoka Y, Kreft GL, Bortolotto T, Terenzi H. Dalton Trans. 2014;43:10086. doi: 10.1039/c4dt00615a. [DOI] [PubMed] [Google Scholar]
- 80.Bu XH, Lu SL, Zhang RH, Liu H, Zhu HP, Liu QT. Polyhedron. 2000;19:431. [Google Scholar]
- 81.Aime S, Barge A, Bruce JI, Botta M, Howard JAK, Moloney JM, Parker D, de Sousa AS, Woods M. J Am Chem Soc. 1999;121:5762. [Google Scholar]
- 82.Prat I, Company A, Postils V, Ribas X, Que L, Luis JM, Costas M. Chem Eur J. 2013;19:6724. doi: 10.1002/chem.201300110. [DOI] [PubMed] [Google Scholar]
- 83.Chen L, Wang J, Wei JM, Wernsdorfer W, Chen XT, Zhang YQ, Song Y, Xue ZL. J Am Chem Soc. 2014;136:12213. doi: 10.1021/ja5051605. [DOI] [PubMed] [Google Scholar]
- 84.Walters KM, Buntine MA, Lincoln SF, Wainwright KP. J Chem Soc, Dalton Trans. 2002:3571. [Google Scholar]
- 85.Huskens J, Dean Sherry A. J Chem Soc, Dalton Trans. 1998:177. [Google Scholar]
- 86.Bleaney B. J Magn Reson. 1972;8:91. [Google Scholar]
- 87.Bloembergen N, Morgan LO. J Chem Phys. 1961;34:842. [Google Scholar]
- 88.Coman D, Kiefer GE, Rothman DL, Sherry AD, Hyder F. NMR Biomed. 2011;24:1216. doi: 10.1002/nbm.1677. [DOI] [PMC free article] [PubMed] [Google Scholar]
Associated Data
This section collects any data citations, data availability statements, or supplementary materials included in this article.