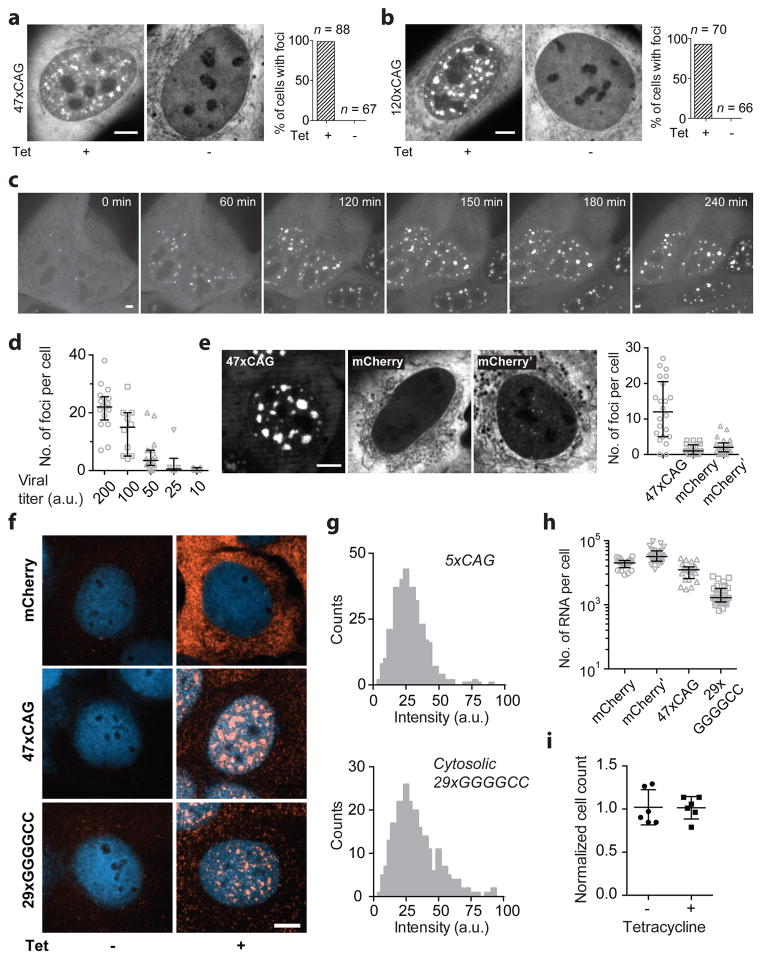
Extended Data Figure 3. Disease-associated, repeat-containing RNAs coalesce into nuclear foci in cells.
(a–b) Expression of 47xCAG (a) and 120xCAG (b) RNA leads to the formation of nuclear puncta. Representative images (left) and quantification of the percentage of cells showing RNA foci (right) with and without induction. n: number of cells analyzed. (c) Time-lapse images of 120xCAG RNA accumulation in the nuclei of U-2OS cells. Cells were induced with 1 μg/ml of doxycycline at t = 0. See also, Supplementary Video 3. (d) Number of foci per cell increases with increasing 47xCAG RNA expression levels. The expression levels were controlled by increasing the virus titer. (e) 47xCAG RNA accumulates in the nuclei as puncta, while control RNA with coding (mCherry) or a non-coding sequences (mCherry′, reverse complement of mCherry sequence) do not form nuclear inclusions, as shown in the representative MS2-YFP fluorescence micrographs (left) and quantification of the number of foci per cell (right). (f) U-2OS cells were transduced with the indicated constructs tagged with 12xMS2 hairpins under a tetracycline inducible promoter. RNA was visualized by FISH using Cy3 labeled oligonucleotide probes against MS2-hairpins. Representative micrographs showing the localization of mCherry (top), 47xCAG (middle) and 29xGGGGCC (bottom) RNA with (+ Tet) or without (−Tet) doxycycline induction. The probes do not bind in the absence of induction. Nuclei are counterstained with DAPI (depicted in blue). (g) Intensity distribution for single RNA spots in cells expressing 5xCAG (top) and in the cytoplasm of cells expressing 29xGGGGCC (bottom). (h) RNA copy number was determined by dividing the total Cy3 fluorescence intensity in a cell by that of a single RNA, as determined in (g). 47xCAG RNA copy number corresponds to highest viral titer used in (d). Similar results were obtained using NanoString (8,800 ± 1,500 copies per cell for 47xCAG RNA, mean ± s.d., n = 3 independent experiments). (i) Induction of 47xCAG RNA foci does not cause overt toxicity or a reduction in cell division rates over 7 days. Normalized cell counts in 47xCAG transduced cells with or without doxycycline induction. Cell counts were normalized to control cells (without 47xCAG transduction), grown under corresponding induction conditions. Each datum point in (d, e, h) represents one cell and error bars depict median and interquartile range. Data points in (i) represent technical replicates, and error bars depict mean and s.d. Scale bars represent 5 μm.

