

Abstract
Royal College of Surgeons rats are genetically predisposed to undergo significant visual loss caused by a primary dysfunction of retinal pigment epithelial (RPE) cells. By using this model, we have examined the efficacy of subretinal transplantation of two independent human RPE cell lines each exhibiting genetic modifications that confer long-term stability in vitro. The two cell lines, a spontaneously derived cell line (ARPE19) and an extensively characterized genetically engineered human RPE cell line (h1RPE7), which expresses SV40 large T (tumor) antigen, were evaluated separately. Both lines result in a significant preservation of visual function as assessed by either behavioral or physiological techniques. This attenuation of visual loss correlates with photoreceptor survival and the presence of donor cells in the areas of rescued photoreceptors at 5 months postgrafting (6 months of age). These results demonstrate the potential of genetically modified human RPE cells for ultimate application in therapeutic transplantation strategies for retinal degenerative diseases caused by RPE dysfunction.
In the Royal College of Surgeons (RCS) rat, the retinal pigment epithelial (RPE) cell fails to provide its normal supporting role to photoreceptors, which is most evident in its inability to phagocytose rod outer segments, because of a mutation of the receptor tyrosine kinase gene (Mertk; ref. 1). This mutation results in profound photoreceptor loss occurring over a several-month time period (2, 3). Degeneration can be slowed by subretinal injection of normal RPE cells, derived either from allogeneic or xenogeneic sources (4–9). These results have led to similar transplantation studies in humans with age-related macular degeneration, albeit without success so far (10–12). There are a number of problems that limit further progress. One is a need to find alternative sources of donor cells. Major restrictions are imposed by the limited supply of donor eyes and the finite numbers of phenotypically stable and functional RPE cells that can be harvested from primary culture. Furthermore, the impracticality of performing full safety testing on primary cultures from every donor further limits their wide-scale clinical use. A second is that little attention has been given to functional parameters in the systematic assessment of graft efficacy (13). Neither levels of photoreceptor rescue (4, 6–8) nor electroretinogram measurements (5) are indicators of how much vision is restored after intervention.
In this study, we have begun to address the question of providing a reliable, safe, well characterized and uniform cell source, by creating an RPE cell line that has been genetically modified to extend its in vitro lifespan and by testing this alongside a spontaneously derived human RPE line (ARPE19; ref. 14). These lines can undergo an extensive number of cell doublings and can be subjected to rigorous testing to produce cell banks of pathogen-free and phenotypically identical cells for use in transplantation. To address the question of functional assays of efficacy, we have used a simple behavioral test in which we monitor, over time, head-tracking to a rotating striped drum. Furthermore, we have measured threshold-sensitivity responses recorded from the superior colliculus to detail the degree of visual field preservation.
Materials and Methods
Human RPE Cell Lines.
Human RPE cells were cultured from an eye obtained from an informed and consented 50-year-old female Caucasian donor under local ethics committee approval. The RPE was isolated, the cells extracted and seeded onto tissue-culture flasks, and culture medium added (15). Culture medium consisted of Ham's F-10, 20% heat-inactivated FCS, 2 mM l-glutamine, 100 units/ml penicillin, 100 μg/ml streptomycin (all supplied by GIBCO Life Technologies, Paisley, Scotland), and 1 μg/ml amphotericin B (Roche Molecular Biochemicals). Medium was changed every 2–3 days, and all cells were cultured at 37°C in 5% CO2.
Primary cultures were genetically modified to extend their in vitro lifespan by transfection with a construct encoding SV40 large T (tumor) antigen that was deleted for the small t antigen (pVim TΔt) along with RSVpuro (which encodes a puromycin resistance gene). Lines were established by selection in 1 μg/ml puromycin.
Lines of genetically modified human RPE cells were screened for the expression of SV40 T antigens, cytokeratins (nos. 5 and 8), and for the junctional protein zonula occludens-1 (ZO-1). Cell monolayers were fixed with either 3.7% paraformaldehyde (for detection of ZO-1 and SV40 T antigens) or cold acetone— methanol (1:1; for cytokeratins), using primary Abs against SV40 T antigen (hamster polyclonal ascites; gift from M. Viquier, Paris), ZO-1 (rabbit polyclonal; Zymed), and cytokeratins 5 and 8 (mouse monoclonal, clone NCL-5D3; NovoCastra, Newcastle, U.K.), and the appropriate fluorophore-conjugated secondary Ab. They were viewed on a Zeiss epifluorescence or confocal laser-scanning microscope. By using these criteria, a single cell line designated h1RPE7 was selected.‡‡ A spontaneously derived line (ARPE19) obtained from the American Type Culture Collection and exhibiting an extended in vitro lifespan was also examined. These cells were cultured as described (14).
Transplantation Procedure.
Cultures of h1RPE7 or ARPE19 cells were trypsinized, washed, and delivered in suspension (2 × 10⁵ per injection) in 2 μl of Ham's F-10 medium through a fine glass pipette (internal diameter 75–150 μm) trans-sclerally. Injections were delivered into the dorso-temporal subretinal space of anesthetized 3–4-week-old dystrophic-pigmented RCS rats, at a stage before both functional deterioration and significant photoreceptor cell death.‡‡ All transplants were to the left eye. Viability of residual RPE cells remained at >90% as assessed by trypan blue exclusion at the end of a transplant session. Sham-injected rats received carrier medium alone. A total of 33 rats (20 with h1RPE7 and 13 with ARPE19) received subretinal grafts and 10 had sham injections. All animals were maintained on oral cyclosporine A (210 mg/liter of drinking water) from 2 days before transplantation until they were killed. Grafted rats (n = 5 h1RPE7; n = 6 ARPE19) were allowed to survive for 5 months postoperatively with the remainder being killed at earlier time points for histological assessment of short-term changes associated with transplantation. A further 6 nonoperated age-matched dystrophic and 3 nondystrophic RCS rats provided cyclosporine-treated controls. To examine donor cell survival, a separate group of rats (n = 5 h1RPE7 and n = 7 ARPE19) received grafts that were prelabeled with BrdUrd. Cells were cultured with BrdUrd (20 μM) in culture medium for 48 h before transplantation. Animal care was in accordance with institutional and government guidelines.
Functional Assessment.
Behavioral assessment was performed in a head-tracking apparatus that consisted of a circular drum rotating at a constant velocity of 12°/sec around a stationary holding chamber containing the animal. Interchangeable panels covered with black and white stripes with spatial frequencies of 0.125, 0.25, and 0.5 cycles per degree were the presenting stimuli (17, 18). The mean luminosity of the panels was 240 lux (photopic). A video camera mounted above the apparatus recorded head movements. Animals were tested at 10 weeks (h1RPE7 only) and 20 weeks (both h1RPE7 and ARPE19 groups) postoperatively. The BrdUrd group was tested at 20 weeks postoperatively. A single operator conducted all assessments blind, and codes were broken on completion of all data acquisition. Behavioral data were analyzed by using an ANOVA (two-way ANOVA with repeated measures). Post hoc analysis was performed on factors that were shown to be significant from the ANOVA.
For physiological studies (h1RPE7 group only), animals (under terminal urethane anesthesia, 1.25 g/kg i.p.) were individually tested at 20 weeks postgraft (i.e., 23–24-weeks-old) by recording multiunit extracellular activity in the superior colliculus to illumination of respective visual receptive fields (19). This procedure was repeated for 76 independent points (spaced 200 μm apart, each step corresponding to ≈10–15° displacements in the visual field), together covering the whole visual field. Visual thresholds were measured as the increase in intensity over background and maintained at 0.02 cd/m2 [at least 2.6 logarithm (log) units below rod saturation (20, 21)], required for activating units in the superficial 200 μm of the superior colliculus with a spot of light 3° in diameter. Thresholds from each point were assembled to generate a threshold map for each animal. They were illustrated as a retinal representation. Data collected from individual points of up to 5 animals were averaged and subjected to statistical analysis by using a randomization test and a t test to compare h1RPE7 thresholds against sham thresholds. The randomization test used was based on the ANOVA F statistic. Both statistical procedures produced identical results. The graphical representation of the statistical analysis is derived from the randomization results.
Histological Analysis.
At the end of the experiment, some animals were killed by using Euthatal (Rhone Merieux, Harlow, U.K.) and perfused transcardially with PBS followed by periodate-lysine-paraformaldehyde (PLP). Eyes were sectioned and stained with cresyl violet. Eyes from the BrdUrd group were labeled with mouse anti-BrdUrd Ab (1:1000; Sigma). The secondary Ab used was a preadsorbed goat anti-mouse (1:200; Jackson ImmunoResearch). The Ab was developed with Vector blue.
Other eyes were injected with 2.5% paraformaldehyde, 2.5% gluteraldehyde, and 0.01% picric acid in 0.1 M cacodylate buffer, postfixed in 1% osmium tetroxide, and dehydrated through graded alcohol to epoxypropane followed by embedding in resin (TAAB Laboratories, Aldermaston, U.K.). Semithin sections were cut and stained with 1% toluidine blue (Sigma) in 1% borate buffer.
PCR Amplification of SV40 T Antigen.
Globes from h1RPE7-grafted animals were removed and incubated in digestion buffer (50 mM Tris⋅HCl, pH 8.0/100 mM EDTA/100 mM NaCl/1% SDS) overnight at 55°C. Digested globes were subsequently extracted twice with phenol–chloroform (25:24:1). Genomic DNA was precipitated in 96% ethanol and removed with a sterile loop. DNA pellets were washed in 70% ethanol, air dried. and resuspended in 10 mM Tris⋅HCl/1 mM EDTA. PCR amplification of the SV40 T antigen was performed by using 1 unit of Qiagen HotStar Taq system and 10 pmols of primers (forward 5′-TGTATAGTGCCTTGACTAGAG-3′ and reverse 5′-GCTGTCAGCAAATATAGCAGC-3′) in a 50 μl reaction generating a 296-bp fragment of the SV40 T antigen gene sequence. Reactions were subjected to an initial denaturation step of 95°C for 15 min followed by 45 cycles of 95°C for 30 s, 57°C for 30 s, and 72°C for 30 s. Reactions were maintained at 72°C for 10 min before analysis on ethidium bromide-stained agarose TAE gels. Genomic DNA was isolated from cell cultures by using the GenElute Mammalian Genomic DNA kit (Sigma).
Results
Cell Line Characterization and Transplantation.
After extensive selection and characterization of the SV40 T transfected cells, a single line designated h1RPE7 was selected for subretinal transplantation into RCS rats, because it exhibited a nontransformed phenotype and expressed RPE markers including ZO-1, β-catenin, cytokeratins 5, 8, and 18, RPE-65, cellular retinaldehyde binding protein (CRALBP), brain-derived neurotrophic factor (BDNF), ciliary neurotrophic factor (CNTF), basic fibroblast growth factor (bFGF), nerve growth factor (NGF), platelet-derived growth factor-α (PDGF-α), insulin-like growth factor I (IGF-I), vascular endothelial growth factor (VEGF), and claudin-1.‡‡ Expression of ZO-1 and cytokeratins 5 and 8 in h1RPE7 cells is illustrated (Fig. 1). Independent assessment of phenotypic cell transformation was performed after s.c. injection of 10 million h1RPE7 cells in 200 μl of PBS plus 10 mM sucrose into 10 irradiated (5 grays) athymic Swiss mice at an age of 8 weeks. After 3 and 15 weeks, h1RPE7 cells failed to produce tumors in all examined mice, unlike U87 human glioblastoma cells that were injected as a positive control. h1RPE7 cells also failed to form aggregates or foci when plated into soft agar. ARPE19 cells were similarly characterized and shown to have generally similar expression patterns.‡‡
Figure 1.

Analysis of primary and genetically modified human h1RPE7 cells. (A) Phase contrast micrographs of contact-inhibited monolayer of primary cultured human donor RPE cells 10 days after seeding and (B) of immortalized human clone h1RPE7 cells derived from culture depicted in A. [Bar = 100 μm.] Both cultures exhibit cobblestone morphology characteristic of RPE cells. (C) Immunocytochemical detection by epifluorescence microscopy of SV40 T antigen showing correct nuclear expression. [Bar = 20 μm.] (D) Immunocytochemical detection by confocal scanning laser microscopy (projected images) of junctional protein ZO-1 showing an almost continuous pattern of peripheral staining. [Bar = 20 μm] (E) Immunocytochemical detection of the RPE cytokeratins 5 and 8. (F) Overlay of images depicted in immunomicrographs D and E plus an additional bisbenzimide (Hoechst Pharmaceuticals) DNA stain (blue) to highlight the cell nuclei. [Bar = 20 μm.]
Functional Assessment.
Efficacy of transplants in preventing visual loss was monitored by assessment of head-tracking performance (17, 18), and this revealed a distinction between graft- and sham-injected animals by 10 weeks postoperatively (Fig. 2). Both nondystrophic and dystrophic animals that received a transplant of h1RPE7 were able to track all grating stimuli and were significantly better than sham-operated and nonoperated dystrophic control animals (Fig. 2). By 20 weeks postoperatively, sham-operated controls were unable to track a visual stimulus, whereas h1RPE7- and ARPE19-transplanted animals performed as well as nondystrophic animals when tracking a visual stimulus of 0.125 cycles per degree. At a grating of 0.25 cycles per degree, grafted animals tracked significantly better than both sham-operated and dystrophic animals; at 0.5 cycles per degree, however, this ability was lost. Thus, in contrast to both sham-operated and dystrophic animals, h1RPE7-transplanted animals were able to track visual stimuli at both 10 and 20 weeks postoperatively. Animals in the BrdUrd group demonstrated a similar behavior profile as the main group (Fig. 3D). The unlabeled and labeled groups performed significantly better than the sham group at 20 weeks (P < 0.01) on post hoc analysis. There was no difference between ARPE19 and h1RPE7 groups (P > 0.05) at 20 weeks.
Figure 2.

Head-tracking to high contrast square-wave gratings. (A) Photograph of head-tracking apparatus showing RCS rat in holding chamber and rotating drum lined with square-wave grating. (B) Total amount of time h1RPE7-grafted animals spent tracking a moving square-wave grating in seconds over a period of 4 min after 10 weeks posttransplant. (C) Head-tracking 20 weeks after h1RPE7 transplantation. Error bars represent SEM. *, P < 0.05, represents statistical difference in nondystrophic h1RPE7-grafted animals as compared to sham and dystrophic groups. (D) Comparative analysis of mean tracking over all frequencies for ARPE19, h1RPE7, and sham showed a significant difference (F = 7.05; df = 2, 23; P < 0.01 Student–Neuman–Keuls post hoc analysis) between sham and both transplant groups but no significant difference between transplant groups.
Figure 3.

Threshold light-sensitivity maps of congenic, dystrophic, h1RPE7-transplanted, and sham-operated RCS rats. RCS rats were divided into four groups: (A) normal (3 nondystrophic rats); (B) no treatment (6 dystrophic rats); (C) h1RPE7 cells injected into one eye (5 dystrophic rats); and (D) sham-injected (5 dystrophic rats). Schematic representation of a dorsal view of the superior colliculus showing respective thresholds for 76 individual recording sites (color-coded squares). A log scale of thresholds measured in cd/m2 is shown. Each point shows the mean response for that position in the 3–6 animals used in each experimental group. Variance was calculated at each point, allowing statistical evaluation of differences between groups. To test efficacy of h1RPE7 grafts vs. sham-injected animals, significance was determined at each of the 76 points by using a randomization test (see Materials and Methods). An area of significantly preserved visual function was recorded for the h1RPE7-transplanted animals as shown in E. The letters D (dorsal), V (ventral), N (nasal), and T (temporal) indicate the corresponding topological representation of the retina onto the superior colliculus, and all figures retain the same orientation. The arrow represents the grafted quadrant.
After head-tracking testing was completed, visual performance was studied electrophysiologically in the h1RPE7 group. The threshold sensitivity response to light was used to define the area of visual field rescue. In nondystrophic rats, visual thresholds never exceeded 0.7 log cd/m2 above background (Fig. 3). By contrast, in nonoperated dystrophic rats, the thresholds were in the order of 4 log units. Sham-injected rats showed some highly localized functional rescue in the temporal retina with lowest averaged thresholds of 2.6 log units. However, the h1RPE7-transplanted rats exhibited substantially greater levels of visual preservation with thresholds averaged from data from 5 individual rats of as low as 1.6 log units and individual points as low as 0.7 log units. The precise region of maximal sensitivity varied slightly among animals, because of small variations in the siting of the graft, leading to higher values when superimposing individual maps to obtain averages. When the grafted retinae were averaged, 52% of the area was associated with thresholds lower than 3.0 log, and 16% with thresholds lower than 2.0 log units, whereas in sham-injected retinae, these proportions were 7% and 0%, respectively. When significance between the sham- and h1RPE7-injected rats was determined, 29 of the 76 points analyzed showed a significant improvement in visual function (P < 0.05; Fig. 3). The area of maximal rescue was invariably confined to the region of cell injection.
The mean blood cyclosporine level in these animals as assessed at the termination of the experiments was 321.6 μg/liter (±21.9).
Histology and PCR.
There was no histological evidence of an inflammatory reaction, and infiltrating immune cells were not observed in Nissl-stained sections. Histological analysis of nondystrophic rat retinae showed a robust outer nuclear layer (ONL) about 8–10 cells thick (Fig. 4A), whereas in nonoperated dystrophic rats, this was reduced to an occasional cell lying in the outer border of the inner nuclear layer. In sham-operated dystrophic rats, it was usual to find a few photoreceptors around the injection site in the region of the disciform scar. By contrast, retinae that had received cell transplants showed larger areas of photoreceptor survival, as much as six cells thick in the general area of the injection site, typically thinning to two cells further from the graft focus (Fig. 4B). Further analysis has shown that the area of retina over which a layer of photoreceptors two cells thick or greater was rescued corresponded quite closely with the area of visual field with threshold sensitivities 2 log units or better over baseline.††
Figure 4.

Anatomical rescue of photoreceptors after transplantation of h1RPE7 in RCS rats. Semithin sections of retinae taken from animals used in the electrophysiological studies are shown. (A) A 6-month-old nondystrophic RCS rat showing full ONL thickness. (B) h1RPE7-transplanted RCS rat 5 months postgraft demonstrating significant preservation of the ONL; this level of rescue corresponds to a threshold sensitivity 2 log units above background. Area shown was 1,400 μm from injection site. (C) Sham-operated RCS rat 5 months postoperative showing complete loss of the ONL; there is also marked disruption of the INL. All sections were stained with toluidine blue. GC, ganglion cell layer; IPL, inner plexiform layer; INL, inner nuclear layer; OPL, outer plexiform layer; ONL, outer nuclear layer; IS, inner segments; OS, outer segments. [Bar = 20 μm.]
PCR studies on eyecups from h1RPE7-grafted animals at selected time points post graft (1, 2, and 7 weeks and 5 months posttransplantation) suggest the presence of SV40 T (Fig. 5D). At 5 months posttransplantation, cells labeled with BrdUrd occupied sites on Bruch's membrane as a monolayer interspersed with unlabeled host cells and associated with regions of photoreceptor rescue (Fig. 5 A and B), and on occasion could be seen above the RPE monolayer. Pigment distribution in donor cells forming part of the RPE monolayer was polarized to the apical domain as in adjacent unlabeled host RPE.
Figure 5.
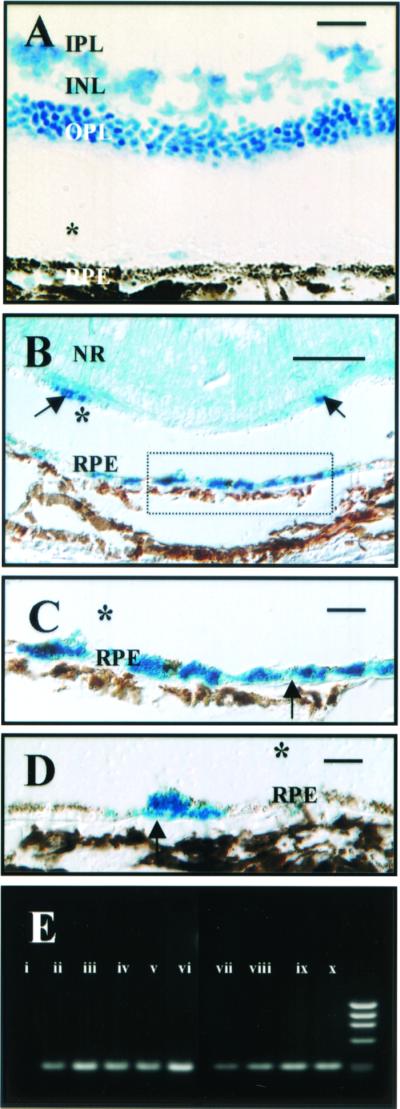
Localization of grafted cells after transplantation of human RPE in RCS rats. A representative cresyl violet-stained frozen section imaged under Nomarski optics (A) demonstrating rescue of photoreceptors in an eye that received a graft of BrdUrd-prelabeled ARPE19 cells. [Bar = 50 μm.] There is extensive rescue of photoreceptor cells that sit over the grafted cells illustrated in B and C. Cells exhibiting immunoreactivity to anti-BrdUrd Ab (B and C) are mainly located on Bruch's membrane (serial section to A above). [Bar = 50 μm.] Immunoreactive cells are also occasionally seen above the RPE monolayer (arrows) separated in this image by an artifactual detachment (*). A higher-power view of the cells seen in B are shown forming a monolayer on Bruch's membrane (arrows) in C. [Bar = 10 μm.] D is an image of an area of retina distant from A–C above in which labeled grafted cells (arrows) are integrated between nonlabeled host RPE cells on Bruch's membrane. Pigment is distributed apically as in surrounding host RPE cells. [Bar = 10 μm.] IPL, inner plexiform layer; INL, inner nuclear layer; OPL, outer plexiform layer; ONL, outer nuclear layer; NR, neural retina. PCR amplification of SV40 T-antigen DNA (E) is shown. Genomic DNA isolated from nontransplanted eyes (i), h1RPE7 cells (ii), or eyes transplanted with h1RPE7 cells at 1 (iii and iv), 2 (v and vi), and 7 (vii and viii) weeks and 5 months (ix and x) posttransplantation were subject to PCR amplification (see Materials and Methods). There is persistence of SV40 T antigen at 5 months postgraft, suggesting graft cell survival.
Discussion
These results show that genetically modified human cell lines, which in vitro exhibit long-term stability and phenotypic characteristics of RPE cells, support photoreceptor survival and limit the deterioration of visual function for up to 5 months after transplantation into the subretinal space of RCS rats. In these cyclosporine-treated animals, the grafted cells showed no evidence of inducing an overt inflammatory response. In addition, despite long-term immunosuppression, there was no evidence of uncontrolled growth of the grafted cells.
In cell-grafting strategies for clinical application, cell lines have the advantage that they can be expanded as required and readily tested for safety, including chromosome abnormalities, tumorigenicity, and potential pathogens. These important characteristics make them preferable to primary or short-term cultured cells in transplantation, which enter crisis after limited cell doublings. A number of other RPE cell lines have been described, although they have not been characterized as fully as the present cell lines nor have their efficacy in transplantation been examined. Other “immortalization” techniques are emerging, which may be preferable to the use of SV40 T antigen or spontaneously derived lines. The question of immune rejection of grafted human cell lines has yet to be addressed. Although the subretinal space may be regarded as an immunologically privileged site (22, ††), it is clear that in RCS rats, as in some forms of age-related macular degeneration, leaky vessels appear (24), which may abrogate such privilege, and there is evidence that allografts of primary cell cultures are likely to be subject to rejection (25). From the present studies, it might be possible to establish a collection of cell lines with different histocompatibilities or alternatively to further genetically modify the cells to express down-regulatory molecules, such as the cytokine IL-10, capable of inducing local immunosuppression (26).
The use of readouts of central visual function as an indication of graft success has not been generally applied when evaluating the efficacy of a repair strategy. The head-tracking method used here in RCS rats has the advantage of discriminating dystrophic from nondystrophic rats as early as 8 weeks of age.§§ This ability to discrimate makes it an effective, compact, and noninvasive screening method for following the progress of changes in visual responsiveness with time. Sham injections delay functional deterioration, perhaps by flushing debris from the subretinal space as well as by possibly provoking growth factor production; but by 10 weeks posttransplantation, the effect of the graft is clearly distinguishable from the sham effect. Presently, this test has been used as a simple screening method. Although it is clear that better scores are achieved for retinae with better photoreceptor rescue, a detailed correlation has yet to be made between this behavior and anatomy.
The measurement of collicular threshold sensitivity used in this study has not been previously applied to this model and provides an indication of relative preservation of visual field. Its importance lies in the fact that there is evidence of some degree of correlation between the amounts of functional rescue and anatomical preservation and that the data collected compares with visual field perimetry testing in humans (27). A reliance on functional assessment is clearly preferable when providing background to clinical treatments, because it is not clear what relation commonly used measures, such as thickness of photoreceptor layer, have to degree of functional rescue. ERG has been used extensively to assess visual function after photoreceptor loss, but although it gives information as to changed electrical activity in the retina, it does not provide direct information as to image-forming capability. Furthermore, ERG measures are known to correlate poorly with visual capacity in patients with retinitis pigmentosa (28). For these reasons, we have not recorded ERG activity in the present study.
This study shows clear evidence of functional efficacy of grafting human RPE cells into the subretinal space, and that rescue occurs in the general region in which the grafted cells are located. It is still not clear whether these cells function by phagocytosing outer segments or by producing trophic factors, which act on host RPE cells, or on cells of the outer retina. In vitro studies †† have shown that the donor cell line used here does phagocytose outer segment fragments and in addition produces a range of factors, such as brain-derived neurotrophic factor (BDNF) and basic fibroblast growth factor (bFGF), known to support photoreceptor survival. It should be noted that in parallel studies (18), we have found that Schwann cells grafted into the subretinal space of RCS rats also support prolonged photoreceptor survival. These cells do produce trophic factors, but do not appear to phagocytose outer segments themselves nor do they influence phagocytosis by host RPE cells.
In summary, the ability of human RPE cell lines to rescue visual function has been demonstrated in the RCS rat by using physiological and behavioral tests that are analogous to those used to assess visual function in humans. The use of cell lines provides a potential and very valuable approach to prevention of retinal degeneration that seems practical to explore in humans.
Acknowledgments
We thank Professor A. Bird, Professor P. Luthert, and Mr. J. Hungerford of Moorfields Eye Hospital (London) for their clinical contribution. We acknowledge Dr. D. Paulin (Univ. of Paris VII, Paris) for the SV40 T construct and Dr. L. Vignais and E. Clèrin-Duhamel (Neurotech S.A.) for the tumorigenicity assay. We also thank T. Pheby for technical support and Dr. A. Koman for his contribution in the initiation of this work. This work represents a joint collaboration between Neurotech S.A. and the Institute of Ophthalmology (London), the Moran Eye Center (Univ. of Utah), and the Department of Psychology (Univ. of Sheffield). This work was funded through grants from the Foundation Fighting Blindness (Owings Mills, MD), the Wellcome Trust, the Medical Research Council (U.K.), and Neurotech S.A.
Abbreviations
- RPE
retinal pigment epithelial
- RCS
Royal College of Surgeons
- ZO-1
zonula occludens-1
- log
logarithm
- T
(large) tumor
Footnotes
This paper was submitted directly (Track II) to the PNAS office.
Winton, H., Beuchène, L., Zerbib, A., Halford, S., Couraud, P. O., Lund, R. D., Adamson, P. & Greenwood, J. (2000) Invest. Ophthalmol. Visual Sci. 41, S857 (abstr.).
Keegan, D. J., Sauvé, Y., Winton, H., Coffey, P., Greenwood, J. & Lund R. D. (2000) Invest. Ophthalmol. Visual Sci. 41, S857 (abstr.).
Hetherington, L., Coffey, P., Simkins, M. & Whiteley, S. J. O. (2001) Invest. Ophthalmol. Visual Sci. 42, S63 (abstr.).
References
- 1.D'Cruz P M, Yasumura D, Weir J, Matthes M T, Abderrahim H, LaVail M M, Vollrath D. Hum Mol Genet. 2000;9:645–512. doi: 10.1093/hmg/9.4.645. [DOI] [PubMed] [Google Scholar]
- 2.Dowling J E, Sidman R L. J Cell Biol. 1962;14:73–109.3. doi: 10.1083/jcb.14.1.73. [DOI] [PMC free article] [PubMed] [Google Scholar]
- 3.Bourne M C, Campbell D A, Tansley K. Br J Ophthalmol. 1938;22:613–623. doi: 10.1136/bjo.22.10.613. [DOI] [PMC free article] [PubMed] [Google Scholar]
- 4.Gouras P, Lopez R, Kjeldbye H, Sullivan B, Brittis M. Prog Clin Biol Res. 1989;314:659–671. [PubMed] [Google Scholar]
- 5.Jiang L Q, Hamasaki D. Invest Ophthalmol Visual Sci. 1994;35:4300–4309. [PubMed] [Google Scholar]
- 6.Li L, Turner J E. Exp Eye Res. 1991;52:669–679. doi: 10.1016/0014-4835(91)90019-b. [DOI] [PubMed] [Google Scholar]
- 7.Little C W, Castillo B, DiLoreto D A, Cox C, Wyatt J, del Cerro C, del Cerro M. Invest Ophthalmol Visual Sci. 1996;37:204–211. [PubMed] [Google Scholar]
- 8.Lopez R, Gouras P, Kjeldbye H, Sullivan B, Reppucci V, Brittis M, Wapner F, Goluboff E. Invest Ophthalmol Visual Sci. 1989;30:586–588. [PubMed] [Google Scholar]
- 9.Whiteley S J, Litchfield T M, Coffey P J, Lund R D. Exp Neurol. 1996;140:100–104. doi: 10.1006/exnr.1996.0120. [DOI] [PubMed] [Google Scholar]
- 10.Algvere P V, Berglin L, Gouras P, Sheng Y. Graefes Arch Clin Exp Ophthalmol. 1994;232:707–716. doi: 10.1007/BF00184273. [DOI] [PubMed] [Google Scholar]
- 11.Algvere P V, Berglin L, Gouras P, Sheng Y, Kopp E D. Graefes Arch Clin Exp Ophthalmol. 1997;235:149–158. doi: 10.1007/BF00941722. [DOI] [PubMed] [Google Scholar]
- 12.Weisz J M, Humayun M S, De-Juan E J, del Cerro M, Sunness J S, Dagnelie G, Soylu M, Rizzo L, Nussenblatt R B. Retina. 1999;19:540–545. doi: 10.1097/00006982-199911000-00011. [DOI] [PubMed] [Google Scholar]
- 13.Little C W, Cox C, Wyatt J, del Cerro C, del Cerro M. Exp Neurol. 1998;149:151–160. doi: 10.1006/exnr.1997.6642. [DOI] [PubMed] [Google Scholar]
- 14.Dunn K C, Aotaki-Keen A E, Putkey F R, Hjelmeland L M. Exp Eye Res. 1996;62:155–169. doi: 10.1006/exer.1996.0020. [DOI] [PubMed] [Google Scholar]
- 15.Robey H L, Hiscott P S, Grierson I. J Cell Sci. 1992;102:329–340. doi: 10.1242/jcs.102.2.329. [DOI] [PubMed] [Google Scholar]
- 16.Sauvé Y, Girman S V, Wang S, Lawrence J M, Lund R D. Neuroscience. 2001;103:51–63. doi: 10.1016/s0306-4522(00)00557-1. [DOI] [PubMed] [Google Scholar]
- 17.Cowey A, Franzini C. Exp Brain Res. 1979;35:443–455. doi: 10.1007/BF00236763. [DOI] [PubMed] [Google Scholar]
- 18.Lawrence J M, Sauvé Y, Keegan D J, Coffey P J, Hetherington L, Girman S, Whiteley S J, Kwan A S L, Pheby T, Lund R D. Invest Ophthalmol Visual Sci. 2000;41:518–528. [PubMed] [Google Scholar]
- 19.Siminoff R, Schwassmann H O, Kruger L. J Comp Neurol. 1966;127:435–444. doi: 10.1002/cne.901270402. [DOI] [PubMed] [Google Scholar]
- 20.Blakema G W, Drager U C. Visual Neurosci. 1991;6:577–585. doi: 10.1017/s095252380000256x. [DOI] [PubMed] [Google Scholar]
- 21.Herreros de Tejada P, Green D G, Munoz Tedo C. Visual Neurosci. 1992;9:409–414. doi: 10.1017/s0952523800010816. [DOI] [PubMed] [Google Scholar]
- 22.Niederkorn J Y. Adv Immunol. 1990;48:191–226. doi: 10.1016/s0065-2776(08)60755-5. [DOI] [PubMed] [Google Scholar]
- 23.Jiang L Q, Jorquera M, Streilein J W. Exp Eye Res. 1994;58:719–728. doi: 10.1006/exer.1994.1069. [DOI] [PubMed] [Google Scholar]
- 24.Villegas-Pérez M P, Lawrence J M, Vidal-Sanz M, LaVail M M, Lund R D. J Comp Neurol. 1998;392:58–77. [PubMed] [Google Scholar]
- 25.Zhang X, Bok D. Invest Ophthalmol Visual Sci. 1998;39:1021–1027. [PubMed] [Google Scholar]
- 26.Croxford J L, Feldmann M, Chernajovsky Y, Baker D. J Immunol. 2001;15:4124–4130. doi: 10.4049/jimmunol.166.6.4124. [DOI] [PubMed] [Google Scholar]
- 27.Beck R W, Bergstrom T J, Lichter P R. Ophthalmology. 1985;92:77–82. doi: 10.1016/s0161-6420(85)34065-4. [DOI] [PubMed] [Google Scholar]
- 28.Szlyk J P, Fishman G A, Alexander K R, Revelins B I, Derlacki D J, Anderson R J. Arch Ophthalmol. 1997;115:53–59. doi: 10.1001/archopht.1997.01100150055009. [DOI] [PubMed] [Google Scholar]