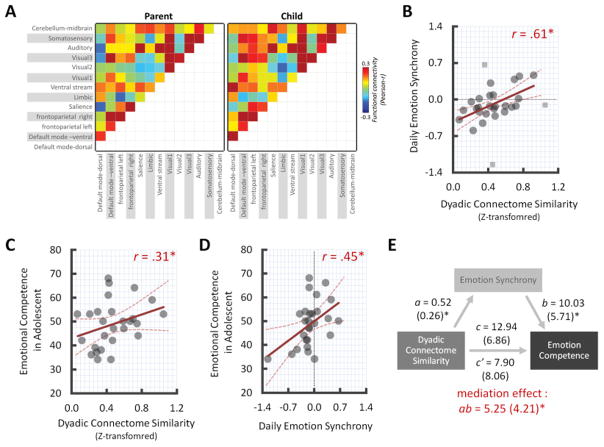
Figure 2.
(A) The averaged RSN connectomes for each parent and child groups. Scatter plots between the degree of dyadic RSN connectome similarity and (B) daily emotional synchrony score (C) emotional competence score (D) between of emotional competence score and daily emotional synchrony score and (E) mediation path. Note that Fisher’s z-transformed connectome similarity values were used for statistical analyses. The Colored-dash line indicates 95% confidence interval of regression lines. The gray dotted-line indicates zero point at each axis. *p < 0.05 at 95% CI after bootstrapping resampling (n=50,000). The squares were bivariate outliers identified and deweighted by robust-method but note that all significant effects remained significant when the outlieres were included (correlation r =0.34, p < 0.05, CI=[0.07, 0.65]; mediation effect ab=5.47, p < 0.05, CI=[0.05 14.50].

