

Abstract
The retina's photoreceptor cells adjust their sensitivity to allow photons to be transduced over a wide range of light intensities. One mechanism thought to participate in sensitivity adjustments is Ca2+ regulation of guanylate cyclase (GC) by guanylate cyclase-activating proteins (GCAPs). We evaluated the contribution of GCAPs to sensitivity regulation in rods by disrupting their expression in transgenic mice. The GC activity from GCAPs−/− retinas showed no Ca2+ dependence, indicating that Ca2+ regulation of GCs had indeed been abolished. Flash responses from dark-adapted GCAPs−/− rods were larger and slower than responses from wild-type rods. In addition, the incremental flash sensitivity of GCAPs−/− rods failed to be maintained at wild-type levels in bright steady light. GCAP2 expressed in GCAPs−/− rods restored maximal light-induced GC activity but did not restore normal flash response kinetics. We conclude that GCAPs strongly regulate GC activity in mouse rods, decreasing the flash sensitivity in darkness and increasing the incremental flash sensitivity in bright steady light, thereby extending the rod's operating range.
The photosensitivity of vertebrate rod photoreceptors changes adaptively in accord with the level of background illumination. Multiple Ca2+ feedback mechanisms, including those that regulate phosphodiesterase (PDE) activity, the activity of guanylate cyclases (GCs), and the ligand affinity of the cGMP-gated channel, are thought to contribute to photosensitivity control (reviewed in refs. 1 and 2). The separate contributions of each of these calcium-dependent processes have been inferred from previous studies on dialyzed rods (3–6). The purpose of this work is to investigate the specific contribution of one of these mechanisms, the Ca2+ regulation of GCs, to the control of photosensitivity in intact functioning rods.
The proteins that confer Ca2+ sensitivity to GCs, GC-activating proteins (GCAPs) have been identified and cloned: GCAP1, GCAP2, and GCAP3 (7–10). GCAP1 and GCAP2 are expressed in mouse rods, whereas GCAP3 has not been detected in rodents (10, 11). GCAPs inhibit GC when Ca2+ levels are high and activate GC when Ca2+ levels are low, modulating GC activity 5- to 20-fold over the physiological range of [Ca2+] (reviewed in ref. 12). Both GCAP1 and GCAP2 possess three high-affinity EF hand motifs that bind Ca2+ and appear to have similar Ca2+ dependence and cooperativity for GC activation by Ca2+ (7, 9, 13). Two distinct GCAP-regulated GCs, GC1 and GC2, have been identified in rod cells. In vitro, GCAP1 activates GC1 more efficiently than GC2 (10, 14), whereas GCAP2 activates both GC1 and GC2 with similar efficiency (15–17). The functional significance of multiple GCAPs remains unknown.
To examine the specific contribution of Ca2+ regulation of GCs to the control of photosensitivity, we disrupted the expression of GCAP1 and GCAP2 using gene-targeting techniques in mice. The removal of GCAPs abolished Ca2+ feedback to GCs but had little effect on the expression of other genes or retinal morphology. Observing the effects of this perturbation on the light response of intact rods allowed us to determine the specific effect of Ca2+ regulation of GCs in sensitivity control. We show that Ca2+ feedback to the cyclase strongly regulates the rod's flash sensitivity under both dark- and light-adapted conditions. In addition, our results suggest that GCAP1 and GCAP2 may make distinct contributions to the regulation of GC in wild-type rods.
Methods
Generation of GCAPs−/− Mice.
Care of experimental animals conformed to procedures approved by the University of Southern California and Stanford University Animal Care Committees. Genomic DNA fragments were obtained from the GCAP clones λMG2 and λMG3 derived from a 129SVJ mouse genomic library (11). The targeting construct consisted of a 7.8-kb NotI-XbaI fragment from GCAP2, a 2.0-kb PGK Neo-lox cassette (18), and a 2.3-kb XbaI-NotI fragment from intron 1 of GCAP1, assembled in pBluescript II SK (Stratagene). The construct was electroporated into CJ7 embryonic stem (ES) cells derived from 129SV mice. G418-resistant ES cell clones were expanded and analyzed by Southern hybridization. Clones that had undergone homologous recombination were injected into C57BL/6 blastocysts. High degree (>95%) male chimeras were bred to C57BL/6 females to obtain GCAPs+/− heterozygous mutants and subsequent GCAPs−/− mice.
Generation of Transgenic Mice Expressing Bovine GCAP2.
An expression vector was obtained by assembling the 4.4-kb KpnI/XhoI mouse opsin promoter (19), the 0.7-kb EcoRI/BamHI bovine GCAP2 cDNA (9), and a 0.6-kb BamHI/XbaI fragment containing the mouse protamine 1 polyadenylation sequence, into pBluescript II SK. The resulting fusion gene, 5.7 kb in size, was microinjected into the pronuclei of C57BL6/J × DBA/2J F1 hybrid mouse embryos. Bovine GCAP2 was immunolocalized in retinas from GCAPs−/− GCAP2+ mice with polyclonal Ab UW50, as previously described (11). GCAP2 standards for immunoblot analysis were obtained by expressing bovine and murine GCAP2 cDNAs in BL21(DE3) Escherichia coli. Both cDNAs were cloned in the NdeI and BamHI sites of the pET-15b vector (Novagen). His-tagged proteins were purified under denaturing conditions by Ni2+-NTA affinity chromatography.
Guanylate Cyclase Activity Assays.
For GC activity assays using retinal homogenates, four retinas from dark-adapted mice of each genotype were dissected under infrared illumination, pooled, and homogenized in 2× assay buffer. GC assays were performed as described (20), except that free [Ca2+] in the reaction was set by addition of EGTA to a final concentration of 0.4 mM (for “low Ca2+ ” conditions), or CaCl2 to 2 μM (for “high Ca2+ ” conditions). GC assays were performed under infrared illumination. For measurement of GC activity in rod outer segment (ROS) extracts, crude preparations of ROS were obtained under dim red light, and GC activity was assayed as previously described (21). Results are averaged from three independent experiments, performed at least in duplicate. Error bars indicate standard error.
Electrophysiology.
All animals for electrophysiology were housed in 12 h cyclic light and dark-adapted at least 15 h before use. Small pieces of retinas were perfused with bicarbonate-buffered Locke's solution (112.5 mM NaCl/3.6 mM KCl/2.4 mM MgCl2/1.2 mM CaCl2/10 mM Hepes/0.02 mM EDTA/20 mM NaHCO3/10 mM glucose) with 2 mM Na2 succinate, 0.5 mM Na glutamate and 0.1% vitamin and amino acid supplement (Sigma), gassed with 95% O2/5% CO2 and heated to 35–37°C (pH 7.4). Individual rods were drawn into a suction electrode containing 140 mM NaCl, 3.6 mM KCl, 2.4 mM MgCl2, 1.2 mM CaCl2, 3 mM Hepes, 0.02 mM EDTA, and 10 mM glucose (pH 7.4). Brief flashes (10 ms) of 500-nm light of calibrated intensity were used for stimulation in darkness or in the presence of continuous 520-nm light of calibrated intensity. Single-cell recording procedures were done as described (22).
The form of the single photon response was estimated by squaring the mean response to a series of at least 30 dim flashes of fixed strength. The squared mean response was then scaled so that the initial rising phase coincided with that of the time-dependent ensemble variance. The scaling factor that brings the squared mean response into alignment with the variance at early times is an estimate of 1/n, where n is the mean number of photoisomerizations per flash (23). The mean response was then divided by n to yield the estimated mean response to a single photoisomerization.
A dim flash response is defined as a response whose amplitude does not exceed 20% of the maximal response amplitude, the upper limit of the linear range. The integration time of the dim flash response was determined by dividing the time integral of the mean response by the peak amplitude (24). In GCAP2+ cells that displayed undershoots, integration was stopped at the onset of the undershoot. The time that a bright flash response remained in saturation was taken as the interval between the midpoint of the flash and the point at which the current recovered to 10% of its dark value.
To determine the incremental flash sensitivity during light adaptation,
the cell was illuminated with a steady background light (520 nm) of
known intensity. After the cell's membrane current had reached a
steady value, which typically required about 1 minute, a series of
brief flashes (10 ms) that evoked just-detectable incremental responses
was then delivered on top of the steady background. The amplitude of
the mean flash response was divided by the flash strength to calculate
the flash sensitivity. The dark-adapted flash sensitivity and dark
current were redetermined between each new steady light intensity. The
relative flash sensitivity
(SF/S )
was calculated by dividing the flash sensitivity in steady light by the
dark-adapted flash sensitivity. Background intensities for each cell
were scaled so that the cell's Io value
coincided with the mean Io value for the population (see values given
in Table 1).
)
was calculated by dividing the flash sensitivity in steady light by the
dark-adapted flash sensitivity. Background intensities for each cell
were scaled so that the cell's Io value
coincided with the mean Io value for the population (see values given
in Table 1).
Table 1.
Characteristics of dark-adapted GCAPs-deficient and wildtype mouse rods
| Dark current, pA | Flash sensitivity, pA φ−1 μm2 |
I , φ
μm−2 , φ
μm−2
|
Single photon response amplitude, pA | Time to peak, ms | Integration time, ms | |
|---|---|---|---|---|---|---|
| +/+ | 12.3 ± 0.5 (28) | 0.13 ± 0.02 (15) | 88.0 ± 7.0 (26) | 0.50 ± 0.05 (25) | 114 ± 5 (27) | 240 ± 14 (27) |
| GCAPs +/− | 12.2 ± 1.0 (20) | 0.31 ± 0.06 (18) | 46.9 ± 7.4 (20) | 0.89 ± 0.16 (18) | 254 ± 23 (18) | 500 ± 44 (18) |
| GCAPs −/− | 13.3 ± 0.8 (42) | 0.78 ± 0.10 (14) | 11.3 ± 0.8 (33) | 2.31 ± 0.20 (41) | 315 ± 13 (42) | 589 ± 19 (42) |
| GCAPs −/− GCAP2+ | 10.2 ± 0.9 (20) | 0.45 ± 0.13 (16) | 33.1 ± 6.9 (20) | 1.17 ± 0.30 (16) | 228 ± 19 (18) | 374 ± 36 (18) |
Error bars represent SEM. Number of cells is indicated in parentheses.
Flash strength required to elicit a half-maximal response.
The bold trace in Fig. 6 was drawn according to the Weber-Fechner relation.
 |
where I is the background light intensity, and
I is the background
intensity that decreased the incremental flash sensitivity to one-half
its dark value. Assuming flash sensitivity
(SF) decreases exponentially with
increasing background light intensity, the thin trace in Fig.
6B was calculated according to (adapted from ref. 32):
is the background
intensity that decreased the incremental flash sensitivity to one-half
its dark value. Assuming flash sensitivity
(SF) decreases exponentially with
increasing background light intensity, the thin trace in Fig.
6B was calculated according to (adapted from ref. 32):
 |
The time constant of the decline in the electrogenic Na+/Ca2+, K+ exchange current was measured by fitting a single exponential to the slow secondary rise of the mean response to 5–15 bright flashes of fixed strength that each held the cell in saturation for a minimum of 0.5 s. In many cells, the time constant could not be accurately determined because the exchange current was too small. In some experiments, 1 mM CsCl was included in the external solution to block an early positive-going notch that can obscure the exchange current (26).
Figure 6.

Adaptation of incremental flash sensitivity in wild-type and GCAPs−/− rods. Relative incremental flash sensitivity as a function of normalized background light intensity in wild-type (solid symbols) and GCAPs−/− rods (open symbols). Bold curve fitted to the wild-type data is the Weber–Fechner relation; the thin curve is the relation expected if the superposition of the elementary responses of GCAPs−/− rods exponentially saturated the cell (see Methods).
Results
Specific Targeting of GCAP1 and GCAP2 Expression.
The genomic organization of GCAP1 and GCAP2, arranged in a tail-to-tail array on mouse chromosome 17 (11), made it possible to target the expression of both genes with a single replacement vector (Fig. 1A; see Methods). Disruption of the GCAP1 and GCAP2 genes with this vector resulted in 50% reduction of expression of GCAP1 and GCAP2 in +/− mice and a complete loss of expression in −/− retinas (Fig. 1C). There were no detectable changes in the expression levels of other proteins directly involved in cGMP turnover, such as GC1, GC2, and PDE subunits (Fig. 1C). Similarly, there were no detectable changes in the expression level of rhodopsin, transducin, rhodopsin kinase, arrestin, recoverin, or RGS9 (data not shown). Expression analysis with DNA chips that interrogated ≈11,000 murine genes and expressed sequence tags (Mu11K set, Affymetrix, Santa Clara, CA) revealed minimal differences in the expression of mRNAs for other photoreceptor proteins (Yanxiang Cao and Lubert Stryer, personal communication). Light microscopy revealed that the retinal morphologies of GCAPs−/− and wild-type mice were indistinguishable for the first 8 months of age (data not shown).
Figure 1.

Disruption of GCAP1 and GCAP2 expression in mice. (A) Genomic organization of GCAP1 and GCAP2 and targeting strategy. GCAP1 and GCAP2 genes are organized in a tail to tail array (Top). The targeting vector replaces a 6.3-kb XbaI genomic DNA fragment comprising GCAP1 exons 2 to 4 and GCAP2 exons 3 and 4, with a neomycin resistance cassette (Middle). The resulting recombinant loci can be distinguished from the wild-type loci by Southern hybridization (Bottom). Exons are shown as boxes; intron and flanking sequences as bold lines. Arrows indicate the direction of transcription. (B) Southern blot analysis of GCAPs+/+, +/−, and −/− mouse genomic DNA. (C) Immunoblot analysis of GCAPs+/+, +/−, and −/− retinal homogenates, with polyclonal antibodies against GCAP1 (UW83), GCAP2 (p24ΔN; ref. 9), GC1 and GC2 (a gift from D. Garbers, University of Texas Southwestern Medical Center, Dallas), and PDE αβγ2 (Cytosignal, Irvine, CA).
GCAP2 Expression in GCAPs −/− Mice.
To examine the specific contribution of GCAP2 to the Ca2+ modulation of GCs, we generated a transgenic line in which bovine GCAP2 was expressed under the control of the mouse opsin promoter (19). The expression level of heterologous GCAP2 was determined from an immunoblot in which serial dilutions of a retinal extract from a transgene-positive mouse were compared with known amounts of recombinant bovine and murine GCAP2 (Fig. 2A). Expression of the bovine GCAP2 transgene in this line was estimated to be 2-fold higher than that of endogenous GCAP2. Mice expressing the transgene were bred to GCAPs−/− to establish the GCAPs−/− GCAP2+ line. The expression level of the transgene was maintained in this new line (data not shown). The normal pattern of localization of GCAP2 was confirmed by indirect immunofluorescent labeling of GCAP2 in GCAPs−/− GCAP2+ retinal sections (Fig. 2B).
Figure 2.

Expression of heterologous GCAP2 in the retina. (A) Fractions corresponding to 1/40 and 1/80 of a retina expressing both endogenous mGCAP2 and transgenic bGCAP2 (3 aa different in size) were separated by SDS/PAGE (lanes 1 and 2) and compared with the indicated amounts of bovine and murine recombinant His-tagged GCAP2 (lanes 3 to 10). Proteins were detected with polyclonal antibody p24ΔN. The amount of bGCAP2 and mGCAP2 in lane 1 were estimated to be 39 and 19 ng, respectively, from the standards calibration curves (Right, eaglesight software, Stratagene). Heterologous GCAP2 concentration in this transgenic line was therefore determined to be 2-fold higher than that of endogenous GCAP2. (B) Immunolocalization of bGCAP2 in the GCAPs−/− GCAP2+ retina. GCAP2 staining was detected in the outer plexiform, outer nuclear, inner segment (is) and outer segment (os) layers of the retina in wild-type (Left), and GCAPs−/− GCAP2+ (right) mice. No staining was observed in the retina of GCAPs−/− mice (Center).
Ca2+ Dependence of GC Activity in GCAPs−/− Mice.
To study how the absence of GCAP1 and GCAP2 affected the Ca2+ dependence of GC activity, we carried out in vitro assays of GC activity in retinal homogenates from GCAPs+/+, +/−, and −/− retinas under low (≤50 nM) and high (2 μM) [Ca2+] conditions (Fig. 3A). Whole retinal homogenates, rather than ROS preparations, were used in this assay to prevent any loss of GCAPs or other soluble factors that might occur during ROS isolation. In wild-type (+/+) homogenates, the GC activity was 8-fold higher at low [Ca2+] than at high [Ca2+] (Fig. 3A). This stimulation of GC activity at low [Ca2+] was completely absent in the GCAPs−/− homogenates. Furthermore, the Ca2+-dependent GC activity was absent in GCAPs−/− ROS extracts throughout the entire physiological range of [Ca2+] (Fig. 3B Left). These results demonstrate that removing GCAP1 and GCAP2 effectively abolished Ca2+ regulation of retinal GCs. Addition of exogenous recombinant GCAP1 restored the Ca2+-sensitive GC activity to similar levels in GCAPs−/− and GCAPs+/+ ROS extracts, indicating that the quantity of GC was similar in both samples (Fig. 3B Right). Expression of GCAP2 alone, in 2-fold excess of the endogenous GCAP2 level, fully restored Ca2+ dependence to GC activity as measured by in vitro GC assays on retinal homogenates (Fig. 3A). These results suggest that GCAP1 and GCAP2 entirely account for Ca2+ regulation of GC in mouse retinas, and that other recently characterized GC-regulatory proteins, such as GCIP in frog (27) and GCAP3 in higher vertebrates (10), are not expressed or cannot compensate for the absence of GCAP1 and GCAP2 in mouse photoreceptors.
Figure 3.

GC activity in retinal homogenates or ROS extracts from wild-type and GCAP-deficient mice. (A) GC activity at low (≤50 nM) or high (2 μM) free [Ca2+] in retinal homogenates from the indicated mice. Note that +/+ homogenates showed an 8-fold stimulation at low Ca2+ (white column) over the level measured at high Ca2+ (shaded column). This stimulation was lost in −/− homogenates. Expression of GCAP2 in the GCAPs−/− background fully restored GC stimulation at low Ca2+. (B) Ca2+ titration of GC activity in ROS preparations from wild-type and GCAPs−/− mice in the absence (Left) or presence (Right) of 3 μM recombinant GCAP1. Note that GC activity in GCAPs−/− ROS does not respond to changes in [Ca2+] (Left). The total amount of GC, as assessed by adding excess recombinant GCAP1, was similar between GCAPs−/− and +/+ ROS (Right). Values are averages from three experiments performed at least in duplicate. Error bars represent the standard errors.
Effect of GCAPs Deletion on Dark-Adapted Flash Responses.
To assess the physiological functions of GCAPs, we examined the flash responses of wild-type and GCAPs−/− rods (Fig. 4). The mean maximal response amplitude, which reflects the size of the inward current in darkness, was slightly higher in GCAPs−/− than in wild-type rods, but the difference was not statistically significant (t test, P = 0.3; Table 1). Assuming that GCAPs−/− and wild-type rods have the same complement of cGMP-gated channels with the same sensitivity for cGMP, this result suggests that the dark [cGMP] is similar in GCAPs−/− and wild-type rods. Assuming that the dark PDE activity is the same in wild-type and GCAPs−/− rods, this in turn implies that both wild-type and GCAPs −/− rods have similar dark (basal) levels of GC activity.
Figure 4.

Flash responses from wild-type and GCAP-deficient mouse rods. Representative families of responses from wild-type (A), GCAPs−/− (B), GCAPs−/− GCAP2+ (C), or GCAPs+/− (D) rods to flashes that ranged in strength from 4–1890 (A), 1–453 (B), 8–1850 (C), or 4–1010 (D) photons/μm2. Dark currents (in pA) were 13.2 (A), 14.4 (B), 14.1 (C), and 15.0 (D). Each trace is the average of 2–116 responses. Flashes were delivered at t = 0.
Rods that did not express GCAPs were much more sensitive to light than wild-type rods. Dim flash responses from GCAPs−/− rose for a longer time and to a larger peak amplitude than wild-type responses (Fig. 4 A and B; Table 1). The mean single photon response amplitude in GCAPs−/− was nearly five times larger than that of wild-type rods (Fig. 5A; Table 1). The flash sensitivity, which is defined as the peak amplitude of the linear response divided by the strength of the flash (24), was about six times higher in GCAPs−/− rods (Table 1). Likewise, the flash strength required to elicit a half-maximal response (Io) was about 8-fold lower in the GCAPs−/− rods (Table 1; see Methods). These results indicate that Ca2+ feedback to GC via GCAP1 and/or GCAP2 potently reduced the flash sensitivity of dark-adapted wild-type rods but had little effect on the size of the dark current.
Figure 5.
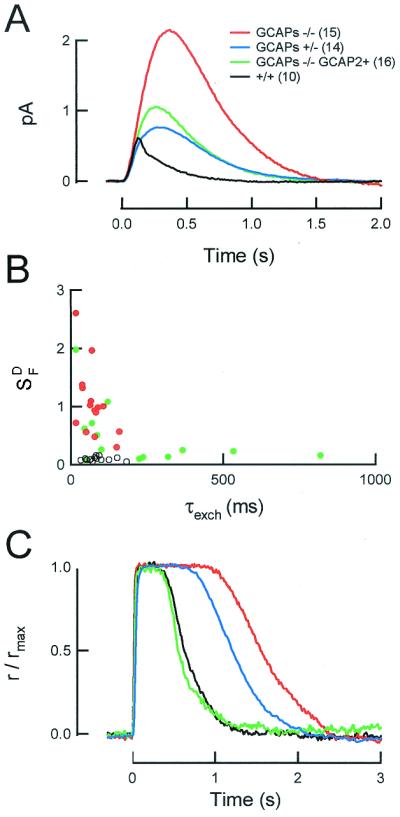
GCAPs regulate the dark flash sensitivity of rod photoreceptors.
(A) Population mean single photon responses from
wild-type and GCAP-deficient rods. Flashes were delivered at
t = 0. (B) Dark-adapted flash
sensitivity
(S ) and
the time constant of the Na+/Ca2+,
K+ exchange current in wild-type, GCAPs−/− and
GCAPs−/− GCAP2+ rods. The rate of Ca2+ extrusion in
GCAPs−/− GCAP2+ rods was highly variable, suggesting that the
expression of GCAP2 varied widely in different cells.
(C) Representative responses of wild-type and
GCAP-deficient rods to a bright flash (560
photons/μm2). Traces are averages of two
responses. Dark currents (in pA) were 13.1 (wild type, +/+), 12.4
(GCAPs+/−), 13.3 (GCAPs−/−), and 10.8 (GCAPs−/− GCAP2+). The
time constant of Na+/Ca2+, K+
exchange in this GCAPs−/− GCAP2+ rod was slightly longer than that
of wild-type rods (100.2 ms; see Fig. 5C), suggesting
there was overexpression of GCAP2 in this rod.
) and
the time constant of the Na+/Ca2+,
K+ exchange current in wild-type, GCAPs−/− and
GCAPs−/− GCAP2+ rods. The rate of Ca2+ extrusion in
GCAPs−/− GCAP2+ rods was highly variable, suggesting that the
expression of GCAP2 varied widely in different cells.
(C) Representative responses of wild-type and
GCAP-deficient rods to a bright flash (560
photons/μm2). Traces are averages of two
responses. Dark currents (in pA) were 13.1 (wild type, +/+), 12.4
(GCAPs+/−), 13.3 (GCAPs−/−), and 10.8 (GCAPs−/− GCAP2+). The
time constant of Na+/Ca2+, K+
exchange in this GCAPs−/− GCAP2+ rod was slightly longer than that
of wild-type rods (100.2 ms; see Fig. 5C), suggesting
there was overexpression of GCAP2 in this rod.
The absence of GCAPs also slowed the time course of the dim flash response (Fig. 5A; Table 1). Thus, the integration time of responses of GCAPs−/− rods was 2.5-fold longer than that of wild-type rod responses. In addition, GCAPs−/− responses from all cells examined (n = 42) displayed broad rounded peaks lacking the rapid phase of recovery that typically follows the peak in responses of wild-type mouse rods (compare Fig. 4 B to A). This phase of recovery in the responses of wild-type mouse rods is caused by one or more Ca2+ feedback mechanisms, because it can be slowed or abolished by incorporation of the Ca2+ buffer BAPTA (28). The lack of this phase in the recovery of GCAPs−/− responses indicates that the rapid initial phase of recovery results from Ca2+ feedback to GC. Together, these results show that Ca2+ feedback to GCs significantly shortened the dark-adapted flash response in wild-type rods.
Heterozygous knockout rods that expressed roughly half the normal levels of GCAP1 and GCAP2 (GCAPs+/−) had flash sensitivities and response kinetics between those of knockout and wild-type rods (Fig. 4D and Fig. 5A; Table 1). Thus, GCAPs expressed at subnormal levels could not support normal Ca2+ regulation of GC during the dim flash response.
Differential Effects of GCAP2 on Responses to Dim and Saturating Flashes.
To test whether GCAP2 alone could mediate normal Ca2+ feedback to GC in intact rods, we recorded flash responses from GCAPs−/− GCAP2+ rods. The flash responses of these rods were unusually variable from cell to cell, suggesting variable GCAP2 expression between cells. Consistent with this interpretation, the rate of the decline of the Na+/Ca2+, K+ exchange current after a bright flash varied widely from cell to cell (Fig. 5B). The rate of decline of the exchange current depends on the total Ca2+ buffering capacity of the rod, which in turn should vary with the expression level of GCAP2. In general, cells whose exchange current time constant was the same or longer than that of wild-type rods had dark flash sensitivities that were nearly normal. Cells with briefer exchange transients had higher flash sensitivities comparable to those of GCAPs−/−, suggesting that GCAP2 expression in these cells was low (Fig. 5B).
The rapid initial decline after the peak of wild-type rod responses was not observed in any of the GCAPs−/− GCAP2+ rods (n = 20), even in cells that had approximately normal Na+/Ca2+, K+ exchange time constants. Instead, all GCAPs−/− GCAP2+ rods (n = 20) displayed the broad rounded response peak characteristic of responses of GCAPs−/− and GCAPs+/− rods (see Fig. 4). Apparently GCAP2 alone was not sufficient to mediate the rapid feedback to GC that accounts for the initial rapid decline of the normal flash response. In addition, in some GCAPs−/− GCAP2+ cells (n = 4), the recovery of the flash response ended in a prominent undershoot resembling that observed in rods loaded with exogenous Ca2+ buffers (29, 30) and in mouse rods that do not express GC1 (31). The undershoot will occur when activation of the cyclase is delayed relative to the fall of the light-evoked PDE activity and is consistent with a delayed activation of GC by GCAP2 (see Discussion).
After a bright flash, the responses of GCAPs−/− GCAP2+ rods remained in saturation for times that were more variable from cell to cell than the responses of wild-type or GCAPs−/− rods, again consistent with variable expression of GCAP2 in different cells. However, on average, saturating responses from GCAPs−/− GCAP2+ rods were very similar to those of wild-type rods (e.g., Fig. 5C) at all flash strengths examined. Because the time at which a rod comes out of saturation is determined by the maximal cyclase activity (as well as the light-triggered PDE activity), the similarity of wild-type and GCAPs−/−GCAP2+ responses to saturating flashes indicates that GCAP2 alone was capable of producing maximal GC activation.
Effect of GCAPs Deletion on Flash Sensitivity During Light Adaptation.
To assess the contribution of GCAPs to light adaptation, we measured the flash sensitivities of wild-type and GCAPs−/− rods in the presence of background lights of varying intensities (see Methods). In wild-type rods, the incremental flash sensitivity decreases with increasing background light intensity as described by the Weber–Fechner relation (Fig. 6, filled symbols). In rods lacking GCAPs, the incremental flash sensitivity began to fall at lower background intensities and then proceeded to decline much more rapidly as the background intensity increased (Fig. 6, open symbols). The incremental flash sensitivity of GCAPs−/− rods fell to one-half the dark value at a background intensity of 70 photons/μm2⋅s, compared with a value of 159 photons/μm2⋅s in wild-type rods. At brighter background intensities, the difference between GCAPs−/− and wild-type rods became still more pronounced. In GCAPs−/− rods, the incremental flash sensitivity fell to 1% of the dark-adapted level when the background intensity was 800 photons/μm2⋅s, whereas more than 13,000 photons/μm2⋅s was required for a comparable sensitivity reduction in wild-type rods (Fig. 6). Thus, although Ca2+-dependent activation of GC by GCAPs reduced the dark-adapted flash sensitivity of wild-type rods, it served to increase the incremental flash sensitivity in the presence of bright steady light by restoring current to rods that would otherwise have saturated (e.g., ref. 1).
If adaptation were completely absent in GCAPs−/− rods, the incremental flash sensitivity would decline exponentially with increasing background intensity, as the superposition of elementary excitations saturated the cell's steady response (32). Using the average properties of dark-adapted responses from GCAPs−/− rods (Table 1), we estimated the theoretical dependence of the incremental flash sensitivity on background intensity for a GCAPs−/− rod lacking any adaptation to background light (Fig. 6, thin trace; see Methods). In the absence of adaptation, one would expect the relative flash sensitivity to decrease to 1% of the dark value at a background intensity of about 70 photons/μm2⋅s. The difference between the experimental results and this simple theory indicates that other adaptational mechanism(s) extend the operating range by about one order of magnitude in GCAPs−/− rods. In wild-type rods, the Ca2+ regulation of GC extends the operating range by an additional order of magnitude.
Discussion
Disruption of the GCAP1 and GCAP2 gene array resulted in a complete loss of expression of both GCAPs (Fig. 1) and a loss of any detectable Ca2+-dependent GC activity (Fig. 3) in ROS or in whole retinal homogenates. We could thus directly examine the functions of Ca2+-regulated GC activity in intact functioning rods. We have found that Ca2+ feedback to GCs plays a key role in setting the flash sensitivity in the dark- and light-adapted states. In addition, our experiments suggest that GCAP1 and GCAP2 may subserve different specific functions in mouse rods.
Basal GC Activity in Rods Lacking GCAP Expression.
Removal of GCAPs had little effect on the size of the inward current in darkness. This result suggests that the [cGMP] and thus the basal GC activity were similar in wild-type and GCAPs−/− rods. In contrast, rods overexpressing GCAP2 had slightly smaller dark currents than wild-type rods (t test, P = 0.03; Table 1). Biochemical studies suggest that the GC activity in the presence or absence of GCAPs is similar at free [Ca2+] of about 1 μM for GCAP1 (33, 34) and 400 nM for GCAP2 (17, 34). Our results are consistent with a dark free [Ca2+] in mouse rods that lies between these values. For example, at a dark free [Ca2+] of about 500 nM, GCAP1 would be expected to slightly activate GC1 and GCAP2 to slightly inhibit both GCs.
GCAP2 Alone Did Not Restore Normal Ca2+ Regulation of GC in Mouse Rods.
To approach the functional significance of multiple GCAPs in vivo, we selectively expressed GCAP2 in GCAPs−/− rods. This did not restore normal response kinetics. The increased amplitude, broad response peak, and occasional undershoots in GCAPs−/− GCAP2+ rod responses resemble similar features of flash responses of rods lacking GC1 (31), in which the most likely functional pair is GC2-GCAP2. However, the average maximal cyclase activation in GCAPs−/− GCAP2+ rods was indistinguishable from that in wild-type rods, indicating that GCAP2 expression was sufficient to maximally activate GCs, given a larger or a longer lasting change in intracellular free [Ca2+]. The implication that GCAP1 may be essential for rapid Ca2+ regulation of GCs in wild-type mouse rods needs to be confirmed by further experiments.
GCAP Regulation of GCs: A Powerful Determinant of the Rod's Flash Sensitivity.
Flash responses from GCAPs−/− were larger and slower than those of wild-type rods. These changes resemble those observed in previous experiments that slowed the rate of change of intracellular free Ca2+ (35–37). Our results also seem consistent with results of Gorczyca et al. (7), who found that dialyzing GCAP1 into lizard ROS lowered the amplitude and speeded the recovery of the dim flash response.
Loss of GCAPs resulted in a 5-fold increase in the single photon response amplitude. In contrast, preventing rhodopsin phosphorylation produces a long-lasting single photon response about 2- to 3-fold larger than normal (22, 38). This indicates that the amplitude of the response generated by nonphosphorylated rhodopsin is not limited by local saturation (e.g., depletion of PDE molecules available for activation, or complete local closure of the channels) but instead by activation of GCs by GCAPs.
Ca2+ feedback via GCAPs is also required for proper adjustment of the rod's flash sensitivity in the presence of steady light (refs. 26, 36; reviewed in ref. 2). Previous studies on truncated salamander rods suggested that Ca2+ regulation of GC decreased flash sensitivity primarily in darkness and dim light (3, 6). Indeed, our experiments on GCAPs−/− rods directly support the conclusion that Ca2+ feedback to GC decreases the flash sensitivity in darkness. Ca2+ feedback to GC appears to be even more important in increasing the incremental flash sensitivity in the presence of bright steady light.
The light intensity at which GCAPs−/− rods failed to generate detectable incremental flash responses was about an order of magnitude greater than that predicted by the exponential saturation model and about an order of magnitude less than that observed in wild-type rods (Fig. 6). Thus, the combined contribution of all of the other adaptational mechanisms operating in GCAPs−/− rods [which would presumably include the Ca2+-dependent adaptation of PDE activity, the increase in steady-state PDE activity (1, 25) and the Ca2+-dependent change in the channel's sensitivity for cGMP (39)] accounts for about one decade of extension of the rod's operating range in background light. The other decade is mediated by GCAPs. In contrast, the principal mechanism underlying odorant adaptation in olfactory neurons involves Ca2+ feedback regulation of the sensitivity of cAMP-gated channels via calmodulin (40). The difference in the principal Ca2+ feedback target in these two sensory cells serves as a reminder that the specific mechanisms regulating G protein signaling need to be evaluated separately in each system encountered.
Acknowledgments
We thank Dr. H. J. Fülle for critical reading of the manuscript. Financial support for this work was provided to J.C. from the National Eye Institute (NEI) (EY 12703); to D.A.B. from the NEI (EY 05750), to K.P. from the NEI (EY08061), by an award from Research to Prevent Blindness (RPB) to the Department of Ophthalmology at the University of Washington and by the E. K. Bishop Foundation; to W.B. from the NEI (EY08123), the Foundation Fighting Blindness, Inc., and the Macular Vision Research Foundation, and to A.M.D. from the NEI (EY11522) and RPB.
Abbreviations
- GC
guanylate cyclase
- PDE
phosphodiesterase
- GCAP
GC-activating protein
- ROS
rod outer segment
References
- 1.Pugh E N, Jr, Nikonov S, Lamb T D. Curr Opin Neurobiol. 1999;9:410–418. doi: 10.1016/S0959-4388(99)80062-2. [DOI] [PubMed] [Google Scholar]
- 2.Fain G L, Matthews H R, Cornwall M C, Koutalos Y. Physiol Rev. 2001;81:117–151. doi: 10.1152/physrev.2001.81.1.117. [DOI] [PubMed] [Google Scholar]
- 3.Koutalos Y, Nakatani K, Yau K W. J Gen Physiol. 1995;106:891–921. doi: 10.1085/jgp.106.5.891. [DOI] [PMC free article] [PubMed] [Google Scholar]
- 4.Koutalos Y, Nakatani K, Tamura T, Yau K W. J Gen Physiol. 1995;106:863–890. doi: 10.1085/jgp.106.5.863. [DOI] [PMC free article] [PubMed] [Google Scholar]
- 5.Nakatani K, Koutalos Y, Yau K W. J Physiol (London) 1995;484:69–76. doi: 10.1113/jphysiol.1995.sp020648. [DOI] [PMC free article] [PubMed] [Google Scholar]
- 6.Koutalos Y, Yau K W. Trends Neurosci. 1996;19:73–81. doi: 10.1016/0166-2236(96)89624-x. [DOI] [PubMed] [Google Scholar]
- 7.Gorczyca W A, Gray-Keller M P, Detwiler P B, Palczewski K. Proc Natl Acad Sci USA. 1994;91:4014–4018. doi: 10.1073/pnas.91.9.4014. [DOI] [PMC free article] [PubMed] [Google Scholar]
- 8.Palczewski K, Subbaraya I, Gorczyca W A, Helekar B S, Ruiz C C, Ohguro H, Huang J, Zhao X, Crabb J W, Johnson R S, et al. Neuron. 1994;13:395–404. doi: 10.1016/0896-6273(94)90355-7. [DOI] [PubMed] [Google Scholar]
- 9.Dizhoor A M, Olshevskaya E V, Henzel W J, Wong S C, Stults J T, Ankoudinova I, Hurley J B. J Biol Chem. 1995;270:25200–25206. doi: 10.1074/jbc.270.42.25200. [DOI] [PubMed] [Google Scholar]
- 10.Haeseleer F, Sokal I, Li N, Pettenati M, Rao N, Bronson D, Wechter R, Baehr W, Palczewski K. J Biol Chem. 1999;274:6526–6535. doi: 10.1074/jbc.274.10.6526. [DOI] [PubMed] [Google Scholar]
- 11.Howes K, Bronson J D, Dang Y L, Li N, Zhang K, Ruiz C, Helekar B, Lee M, Subbaraya I, Kolb H, et al. Invest Ophthalmol Visual Sci. 1998;39:867–875. [PubMed] [Google Scholar]
- 12.Palczewski K, Polans A S, Baehr W, Ames J B. BioEssays. 2000;22:337–350. doi: 10.1002/(SICI)1521-1878(200004)22:4<337::AID-BIES4>3.0.CO;2-Z. [DOI] [PubMed] [Google Scholar]
- 13.Gorczyca W A, Polans A S, Surgucheva I G, Subbaraya I, Baehr W, Palczewski K. J Biol Chem. 1995;270:22029–22036. doi: 10.1074/jbc.270.37.22029. [DOI] [PubMed] [Google Scholar]
- 14.Krylov D M, Niemi G A, Dizhoor A M, Hurley J B. J Biol Chem. 1999;274:10833–10839. doi: 10.1074/jbc.274.16.10833. [DOI] [PubMed] [Google Scholar]
- 15.Dizhoor A M, Lowe D G, Olshevskaya E V, Laura R P, Hurley J B. Neuron. 1994;12:1345–1352. doi: 10.1016/0896-6273(94)90449-9. [DOI] [PubMed] [Google Scholar]
- 16.Lowe D G, Dizhoor A M, Liu K, Gu Q, Spencer M, Laura R, Lu L, Hurley J B. Proc Natl Acad Sci USA. 1995;92:5535–5539. doi: 10.1073/pnas.92.12.5535. [DOI] [PMC free article] [PubMed] [Google Scholar]
- 17.Laura R P, Hurley J B. Biochemistry. 1998;37:11264–11271. doi: 10.1021/bi9809674. [DOI] [PubMed] [Google Scholar]
- 18.Mombaerts P, Wang F, Dulac C, Chao S K, Nemes A, Mendelsohn M, Edmondson J, Axel R. Cell. 1996;87:675–686. doi: 10.1016/s0092-8674(00)81387-2. [DOI] [PubMed] [Google Scholar]
- 19.Lem J, Applebury M L, Falk J D, Flannery J G, Simon M I. Neuron. 1991;6:201–210. doi: 10.1016/0896-6273(91)90356-5. [DOI] [PubMed] [Google Scholar]
- 20.Domino S E, Tubb D J, Garbers D L. Methods Enzymol. 1991;195:345–355. doi: 10.1016/0076-6879(91)95179-n. [DOI] [PubMed] [Google Scholar]
- 21.Otto-Bruc A, Buczylko J, Surgucheva I, Subbaraya I, Rudnicka-Nawrot M, Crabb J W, Arendt A, Hargrave P A, Baehr W, Palczewski K. Biochemistry. 1997;36:4295–4302. doi: 10.1021/bi963000d. [DOI] [PubMed] [Google Scholar]
- 22.Mendez A, Burns M E, Lem J, Wu N, Simon M, Baylor D A, Chen J. Neuron. 2000;28:153–164. doi: 10.1016/s0896-6273(00)00093-3. [DOI] [PubMed] [Google Scholar]
- 23.Rieke F, Baylor D A. Biophys J. 1998;75:1836–1857. doi: 10.1016/S0006-3495(98)77625-8. [DOI] [PMC free article] [PubMed] [Google Scholar]
- 24.Baylor D A, Hodgkin A L. J Physiol (London) 1973;234:163–198. doi: 10.1113/jphysiol.1973.sp010340. [DOI] [PMC free article] [PubMed] [Google Scholar]
- 25.Nikonov S, Lamb T D, Pugh E N., Jr J Gen Physiol. 2000;116:795–824. doi: 10.1085/jgp.116.6.795. [DOI] [PMC free article] [PubMed] [Google Scholar]
- 26.Nakatani K, Yau K W. Nature (London) 1988;334:69–71. doi: 10.1038/334069a0. [DOI] [PubMed] [Google Scholar]
- 27.Li N, Fariss R N, Zhang K, Otto-Bruc A, Haeseleer F, Bronson D, Qin N, Yamazaki A, Subbaraya I, Milam A H, Palczewski K, Baehr W. Eur J Biochem. 1998;252:591–999. doi: 10.1046/j.1432-1327.1998.2520591.x. [DOI] [PubMed] [Google Scholar]
- 28.Tsang S H, Burns M E, Calvert P D, Gouras P, Baylor D A, Goff S P, Arshavsky V Y. Science. 1998;282:117–121. doi: 10.1126/science.282.5386.117. [DOI] [PubMed] [Google Scholar]
- 29.Matthews H R, Torre V, Lamb T D. Nature (London) 1985;313:582–585. doi: 10.1038/313582a0. [DOI] [PubMed] [Google Scholar]
- 30.Torre V, Matthews H R, Lamb T D. Proc Natl Acad Sci USA. 1986;83:7109–7113. doi: 10.1073/pnas.83.18.7109. [DOI] [PMC free article] [PubMed] [Google Scholar]
- 31.Yang R B, Robinson S W, Xiong W H, Yau K W, Birch D G, Garbers D L. J Neurosci. 1999;19:5889–5897. doi: 10.1523/JNEUROSCI.19-14-05889.1999. [DOI] [PMC free article] [PubMed] [Google Scholar]
- 32.Schnapf J L, Nunn B J, Meister M, Baylor D A. J Physiol (London) 1990;427:681–713. doi: 10.1113/jphysiol.1990.sp018193. [DOI] [PMC free article] [PubMed] [Google Scholar]
- 33.Rudnicka-Nawrot M, Surgucheva I, Hulmes J D, Haeseleer F, Sokal I, Crabb J W, Baehr W, Palczewski K. Biochemistry. 1998;37:248–257. doi: 10.1021/bi972306x. [DOI] [PubMed] [Google Scholar]
- 34.Dizhoor A M, Hurley J B. Methods. 1999;19:521–531. doi: 10.1006/meth.1999.0894. [DOI] [PubMed] [Google Scholar]
- 35.Lamb T D, Matthews H R, Torre V. J Physiol (London) 1986;372:315–349. doi: 10.1113/jphysiol.1986.sp016011. [DOI] [PMC free article] [PubMed] [Google Scholar]
- 36.Mattews H R, Murphy R L, Fain G L, Lamb T D. Nature (London) 1988;334:67–69. doi: 10.1038/334067a0. [DOI] [PubMed] [Google Scholar]
- 37.Nikonov S, Engheta N, Pugh E N., Jr J Gen Physiol. 1998;111:7–37. doi: 10.1085/jgp.111.1.7. [DOI] [PMC free article] [PubMed] [Google Scholar]
- 38.Chen J, Makino C L, Peachey N S, Baylor D A, Simon M I. Science. 1995;267:374–377. doi: 10.1126/science.7824934. [DOI] [PubMed] [Google Scholar]
- 39.Hsu Y T, Molday R S. Nature (London) 1993;361:76–79. doi: 10.1038/361076a0. [DOI] [PubMed] [Google Scholar]
- 40.Kurahashi T, Menini A. Nature (London) 1997;385:725–729. doi: 10.1038/385725a0. [DOI] [PubMed] [Google Scholar]