

Abstract
Early psychosocial deprivation has profound adverse effects on children’s brain and behavioral development, including abnormalities in physical growth, intellectual function, social cognition, and emotional development. Nevertheless, the domain of emotional face-processing has appeared in previous research to be relatively spared; here, we test for possible sleeper effects emerging in early adolescence. The present study employed event-related potentials (ERPs) to examine the neural correlates of facial emotion processing in 12-year-old children who took part in a randomized controlled trial of foster care as an intervention for early institutionalization. Results revealed no significant group differences in two face and emotion-sensitive ERP components (P1 and N170), nor any association with age at placement or percent of lifetime spent in an institution. These results converged with previous evidence from this population supporting relative sparing of facial emotion processing. We hypothesize that this sparing is due to an experience-dependent mechanism in which the amount of exposure to faces and facial expressions of emotion children received was sufficient to meet the low threshold required for cortical specialization of structures critical to emotion-processing.
Keywords: Institutionalization, foster care, intervention, face processing
Early institutional rearing has been shown to be detrimental to the physical, neural, cognitive, psychological, and social development of young children. The Bucharest Early Intervention Project (BEIP), a randomized controlled trial of foster care as an intervention for early institutional exposure, has provided a unique opportunity to explore the development of face-processing abilities following early childhood adversity (see Zeanah et al., 2003; Nelson et al., 2007 for details). In previous studies, we examined the neural responses of BEIP participants who viewed facial expressions of emotion by measuring the mean amplitudes of early face-related ERP components (Parker & Nelson, 2005a,b; Moulson et al., 2009; Nelson, Furtado, Fox, & Zeanah, 2009; Nelson et al., 2013). Of particular interest were two components: the P1, an early positive deflection reliably elicited 90–150ms post-stimulus in the lateral occipital cortex that reflects visual processing and shows some sensitivity to face processing; and the N170, a negative component evoked over posterior visual cortical areas approximately 170ms post-stimulus that is specifically sensitive to the structural aspects of face processing (Csibra, Kushnerenko, & Grossmann, 2008; Eimer, 2011; Olivares et al., 2015).
Findings from prior analyses indicated that institutionalized Romanian children between the ages of 7–32 months showed larger amplitude ERP components in response to fearful versus sad faces, while family-reared children showed the opposite (Parker & Nelson, 2005a,b). In the same study, the institutionalized group displayed altered hemispheric specialization as well as longer latencies and reduced amplitudes for several ERP components (Parker & Nelson, 2005a,b; Nelson, Furtado, Fox, & Zeanah, 2009). These findings – though subtle – suggested that there might be meaningful differences in face processing associated with institutional placement.
Contrary to expectations, these differences became less pronounced over time. For instance, children assigned to foster care showed a more “typical” P1 response to emotional faces (i.e., more like the never-institutionalized children) at 42 months of age. And by 8 years old, this effect had disappeared entirely, such that there was no significant variation by group or emotion (Nelson et al., 2013). The N170 displayed a similar trend throughout development, although group differences were less prominent from the beginning. At the baseline assessment, the right-hemisphere mean amplitude was somewhat larger (more negative) in the never-institutionalized group than the institutionalized group (Moulson et al., 2009), but by 30 months, this difference was no longer evident, nor did it resurface at 42 months (Moulson et al., 2009) or at 8 years (Nelson et al., 2013). To date, therefore, we found only modest effects on early emotional face-processing components, making this the only developmental domain not seriously impacted by institutional rearing.
Despite this apparent sparing, early experience has been shown to shape development in a variety of ways, including through so-called “sleeper effects” (e.g., Maurer, Mondloch & Lewis, 2007). Maurer and colleagues (2007) describe this phenomenon as follows: “when the early experience is lacking, the capability fails to develop normally many years later” (p. 40, italics added), and they note that face processing is a domain which may be particularly prone to this sort of protracted, obscured developmental pattern. The current study extends our earlier findings by completing a follow-up with BEIP participants a full decade after their enrollment in the study. Now having assessed the children at 12 years of age, we are able to determine whether emotional face processing is an area in which sleeper effects are observed in the BEIP.
Furthermore, recent studies have suggested that effects of intervention may become more apparent when age of placement is considered (e.g., Stamoulis et al., 2015; Vanderwert et al., 2016). More specifically, children transitioned from institutional care to foster care before 24 months of age showed EEG responses indistinguishable from those of never-institutionalized children, while children placed in foster care after 24 months did not (Vanderwert et al., 2010). Similarly, another study found that children showed larger amplitudes for certain ERP components the earlier they were placed in foster care (Nelson et al., 2013). Taken together, these results emphasize that increased time spent in an environment of psychosocial neglect, especially during early periods of development, can profoundly affect brain activity. In addition to investigating the potential presence of sleeper effects in this population, therefore, we also sought to determine whether within-group differences in emotion processing abilities could be found in the foster care sample based on the age at which they left the institution.
In this study, we analyzed the amplitudes of the P1 and N170 components in response to passive viewing of high and low intensity expressions of 3 emotions (angry, fearful, and happy), to determine whether pronounced group differences had emerged. We present a series of analyses including: (1) an “intent to treat” approach, comparing children’s ERP responses according to their original group assignment (foster care or care as usual); (2) a comparison of children’s ERP responses across both institutionalized groups, as well as the never-institutionalized group; and (3) an analysis of the association between age at placement, percentage of time spent in institutional care, and ERP response at age 12. Our expected results were guided by a hypothesized sleeper effect, evidenced by dampened and/or slowed ERP responses (1) in the care as usual group relative to the foster care group; and (2) in children with a history of institutionalization relative to those with no history of institutionalization. In analyses #3, children placed in foster care at younger (vs. older) ages were expected to show larger ERP responses and shorter latencies, as were children with lower (vs. higher) percentage of time institutionalized.
Methods
Participants
Participants in the original RCT included a total of 208 children. The institutionalized group (IG) comprised 136 children between 5 and 31 months of age who had been abandoned and placed in institutions in Bucharest, Romania. Following baseline assessments, children from the IG were randomly assigned either to continued institutional care (care as usual group, or CAUG) or to placement in high-quality foster care (foster care group, or FCG). A comparison group of 72 children who had never been institutionalized were recruited from the community (the never institutionalized group, or NIG). The children were then compared across multiple domains throughout their development.
Of the 147 children who completed their 12 year-old follow-up visits, 17 were excluded due to noise or artifact contamination, 1 due to corrupted data, 1 due to EEG system differences, and 1 for insufficient usable trials. Eleven of these excluded participants were from the NIG, 6 from the CAUG, and 3 from the FCG. The analyses reported below included data from the remaining 127 participants. Thus, at age 12 years, the groups included 44 children in the CAUG (23 male, 21 female), 46 children in the FCG (25 male, 21 female), and 37 children in the NIG (16 male, 21 female). For all groups, the mean age was 12.7 years at the time of evaluation (see Table 1).
Table 1.
Sample Descriptive Characteristics
| Group | Statistic | ||
|---|---|---|---|
| N | Number Male (%) | Mean Age at Evaluation (SD) | |
| CAUG | 44 | 23 (52.3) | 152.11 (7.35) |
| FCG | 46 | 25 (54.3) | 151.88 (6.52) |
| NIG | 37 | 16 (43.2) | 152.43 (6.33) |
Note. Mean age at evaluation is reported in months. CAUG = care as usual group; FCG = foster care group; NIG = never-institutionalized group.
The study protocol was approved by the local commissions on child protection in Bucharest, the Romanian Ministry of Health, and a multidisciplinary ethics committee, in addition to the institutional review boards of the three principal investigators. Ethical issues in BEIP have been discussed extensively by the three Principal Investigators (see Zeanah et al., 2006; Zeanah et al., 2012, Nelson, Fox & Zeanah, 2014).
Measures and Procedures
Stimuli
At the 12-year assessment, ERPs were recorded while children passively viewed images of human faces displaying emotional expressions of varying type and intensity. The task relied on passive (rather than active) viewing in order to isolate the neural networks integral to visual recognition of basic emotional expressions from those involved in higher-level visual processing and comprehension, and to parallel previous work with this sample. Taken from the NimStim set of stimuli (Tottenham et al., 2009), the RGB color photographs had a resolution of 506 x 650 pixels and featured Caucasian female adult actors, one blonde and one brunette. Caucasian faces were chosen from this stimuli set to be most representative of the faces encountered by Romanian children. Each participant was presented with images from only one of the models, displaying a neutral face as well as emotional expressions of happiness, fear, and anger. With permission, stimuli were adopted from a previous study in which faces had been morphed to display a range of emotional intensities, ranked by percentage according to the physical displacement of facial features, from 0% (neutral) to 100% (prototypical; Gao & Maurer, 2009). Participants viewed each of the three emotions at intensities of 0% (neutral), 20%, 40%, and 60% (Figure 1). Recent studies of children’s ability to discriminate emotional expressions from neutral faces suggest a slow development of sensitivity to most emotions, with varying thresholds for identification (Gao & Maurer, 2010). By incorporating variations in intensity, we hoped to first identify potential group differences in response to subtle emotional expressions that might otherwise be masked by more obvious representations; and second, to more realistically represent the range faces children would encounter in their natural settings. Each of the 10 expressions described was randomly presented 25 times, for a total of 250 trials.
Figure 1.
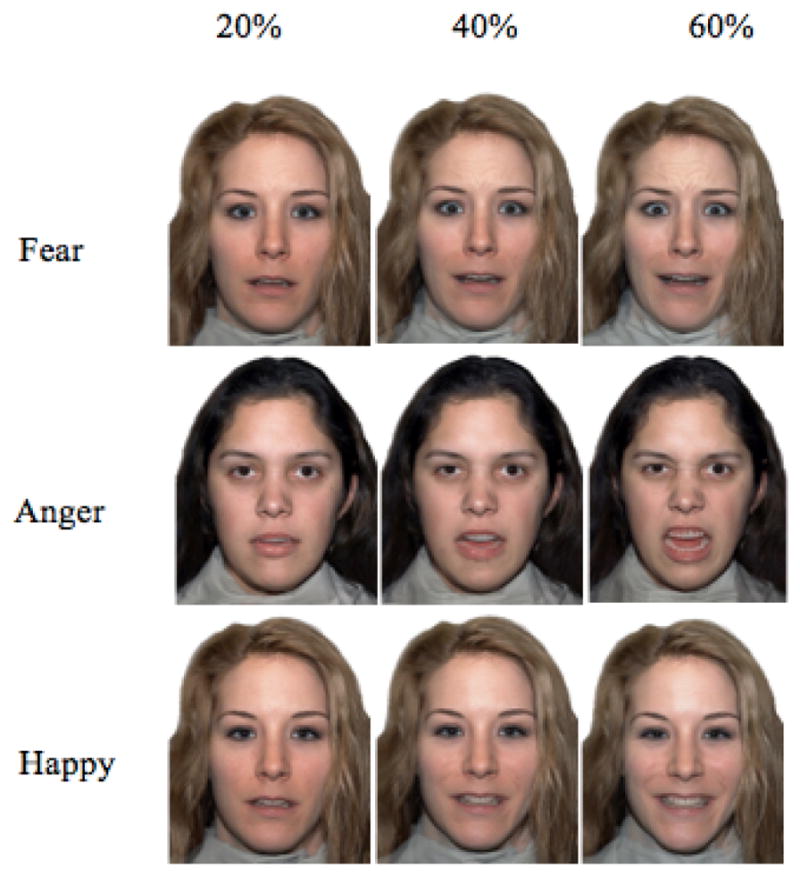
Examples of stimuli depicting fearful, angry, and happy emotions at 20, 40, and 60 percent intensities.
EEG Recording
While viewing the stimuli, participants wore 64-channel HydroCel Geodesic Sensor Nets (Electrical Geodesics, Inc., Eugene, OR) to facilitate electrophysiological recording. The nets connected to a NetAmps 300 amplifier located within the testing room, which referenced on-line to a single vertex electrode (Cz) and applied a 0.1 Hz high-pass filter to the signal. On a nearby computer, NetStation 4.3.1 (Electrical Geodesics Inc., Eugene, OR) recorded the data with a sampling rate of 250 Hz.
Procedure
Subjects were individually seated in a testing room, where they viewed the stimuli on a 17-inch standard TFT computer monitor (Dell, Inc., Round Rock, TX). The screen was positioned approximately 60 centimeters in front of them, subtending a visual angle of 15 degrees. Black curtains surrounded the monitor and covered the walls of the testing room to minimize the presence of any distractions in the visual field. Impedances were maintained under 100 kΩ. EEG recording began with a two-minute baseline period during which the eyes were open for one minute and closed for one minute. Scripts created in E-Prime Professional 2.0.8.22 (Psychology Software Tools, Inc., Sharpsburg, PA) initiated the series of trials, randomly selecting one of the two models to be shown in all 250 trials. Each trial began with a fixation cross, located approximately 2 cm below the center of the screen and appearing for a randomly chosen interval between 300–500 milliseconds (ms). Next, a face stimulus appeared for 500 ms, followed by a scrambled face image for 200 ms. The scrambled face acted as a mask to interrupt cognitive processing of the target stimulus, an empirical technique described in detail by Breitmeyer & Ogmen (2000). A blank screen was then displayed during a 500 ms intertrial interval. After every 62 trials, the presentation of stimuli was automatically paused to offer participants a break. The session ended when the child had viewed all 250 trials or as otherwise necessary.
ERP Data Processing
Following data collection, each recorded file was processed using NetStation 4.4 (Electrical Geodesics Inc., Eugene, OR). A 0.3–30 Hertz (Hz) filter was applied, and the file was segmented and corrected to include a 100 ms pre-stimulus baseline period and a 500 ms post-stimulus recording period. Using artifact detection, the file was then screened for bad channels, eye blinks, and eye movements. Channels were considered bad if they contained high frequency noise, a voltage difference of at least 150 microvolts (μV), or if artifact disrupted the first 350 ms of stimulus presentation. Any segments containing 6 or more bad channels were excluded from analysis. Subjects with fewer than 10 acceptable trials in any of the emotion categories were excluded from further analysis. If any 2 categories of emotion differed in the number of acceptable trials by 5 or more, trials with the greatest number of bad channels were removed until acceptable trial numbers were balanced across all categories. Individual means were then computed by averaging all accepted trials within each category for a single participant. During this process, NetStation’s channel replacement tool was used to replace any bad channels with information from the surrounding electrodes. All files were then baseline corrected a second time to account for recalculations that occurred during the averaging process. Averaged files were also examined to ensure that the processed data was acceptable for statistical analysis.
ERP Data Extraction
Grand means were constructed to aid in the identification of components and selection of electrode groupings. The P1 and N170 were identified as the major components of interest, and corresponding electrode regions of interest were selected. The 9 electrodes selected for the P1 component included 3 over the midline, 3 over the left hemisphere, and 3 over the right hemisphere. The 16 electrodes of interest for the N170 component included 6 over the central parieto-occipital region, 5 over the left hemisphere, and 5 over the right hemisphere. See Figure 2 for component regions of interest. Time windows for the two ERP components of interest, the P1 and N170, were selected based on individual averages (P1: 80–160ms post-stimulus; N170: 130–210ms post-stimulus). Using a waveform tool, peak amplitudes and latencies to peak were extracted from electrodes in the regions of interest during the selected time windows.
Figure 2.

Electrode regions of interest for the 64-channel HydroCel Geodesic Sensor Net, adapted from Electrical Geodesics, Inc. product layout.
Data Analytic Plan
Three sets of analyses were planned: 1) comparisons across groups with a history of institutionalization (CAUG and FCG) and without (NIG); 2) an “intent to treat” approach, in which the CAUG and FCG were compared in ERP peak amplitude and latency to peak for the P1 and N170 components, permitting a direct assessment of the efficacy of the intervention; and 3) associations between ERP measures and age at placement/percentage of lifetime spent in institutional care. Hemispheric region (left, center, right), intensity of expressed emotion (0%, 20%, 40%, 60%), and emotion type (anger, fear, happiness) were included as within-subjects variables in a series of repeated measures ANOVAs. Greenhouse-Geisser correction was used for violations of sphericity. Post-hoc analyses used a Bonferroni adjustment for multiple comparisons.
Results
History of Institutionalization
We examined group differences in peak amplitude and latency to peak for the P1 and N170 components for the three groups (CAUG, FCG and NIG) (Figure 3 and Table 2). With regard to the P1, no group differences in peak amplitude were detected in response to any of the three emotions— anger, fear, or happiness— at any intensity based on repeated measures ANOVAs. However, there were significant differences by region, such that the maximum amplitude was greatest over the right hemisphere, intermediate over the midline, and least over the left hemisphere, F(1.57)= 15.87, p=.0.00, ηp2 = 0.196. Similarly, only regional differences were found in latency to peak for the P1 component, with a longer latency over the midline region than the left or right hemispheres, F(1.79)= 30.16, p=0.00, ηp2 = 0.196.
Figure 3.

Grand averaged event-related potential (ERP) waveforms of all three groups at the 12-year assessment for (A) angry, (B) fearful, and (C) happy faces at 60% intensity. Electrodes in the midline P1 and right-hemisphere N170 regions were included in separate averages to obtain waveforms representative of each region of interest. See corresponding statistical values in Table 2.
Table 2.
(A) Statistical values for ERP components of all three groups at the 12-year assessment for angry, fearful, and happy faces at 60% intensity, to accompany the waveforms displayed in Figure 3. (B) Significance testing for between-group differences in each ERP component.
| A | ||||||||
|---|---|---|---|---|---|---|---|---|
| Emotion Type | P1 Peak Amplitude (midline) | P1 Latency to Peak (midline) | N170 Peak Amplitude (right hemisphere) | N170 Latency to Peak (right hemisphere) | ||||
| Mean | SEM | Mean | SEM | Mean | SEM | Mean | SEM | |
| Angry (60%) | ||||||||
|
| ||||||||
| CAUG | 10.09 | 0.81 | 122.88 | 2.92 | −0.80 | 0.54 | 162.36 | 2.51 |
| FCG | 9.40 | 0.61 | 123.42 | 2.38 | −0.96 | 0.46 | 173.50 | 2.31 |
| NIG | 10.52 | 0.75 | 123.17 | 2.48 | −0.44 | 0.45 | 166.12 | 2.49 |
|
| ||||||||
| Fearful (60%) | ||||||||
|
| ||||||||
| CAUG | 10.83 | 0.78 | 121.09 | 2.76 | −0.15 | 0.48 | 165.67 | 2.44 |
| FCG | 10.08 | 0.84 | 121.51 | 2.75 | −0.23 | 0.52 | 163.36 | 1.98 |
| NIG | 9.79 | 0.84 | 118.05 | 2.52 | −0.84 | 0.54 | 164.93 | 2.75 |
|
| ||||||||
| Happy (60%) | ||||||||
|
| ||||||||
| CAUG | 10.21 | 0.78 | 122.64 | 2.63 | −0.08 | 0.51 | 161.26 | 2.45 |
| FCG | 10.16 | 0.73 | 120.61 | 2.49 | −0.11 | 0.49 | 171.17 | 2.58 |
| NIG | 9.83 | 0.83 | 120.83 | 2.85 | −0.36 | 0.64 | 165.06 | 2.89 |
| B | |||
|---|---|---|---|
| ERP Component | df | F-value | p-value |
| P1 Peak Amplitude | 2 | 0.135 | 0.874 |
| P1 Latency to Peak | 2 | 0.145 | 0.865 |
| N170 Peak Amplitude | 2 | 0.052 | 0.949 |
| N170 Latency to Peak | 2 | 2.494 | 0.087 |
Results from the N170 component converged with those from the P1 in revealing no significant differences between groups using repeated measures ANOVAs, although some within-group effects regional differences were found. Peak amplitude was greatest in the midline region, intermediate over the right hemisphere, and least over the left hemisphere F(1.80)= 241.17, p<.00, ηp2 = 0.66. Results for latency to peak for the N170 revealed significant main effects of emotion [F(1.94)= 4.84, p<.009, ηp2 = 0.038] and intensity [F(2.69)= 9.58, p=.00, ηp2 = 0.072]. Pairwise comparisons indicated that latency was longer for anger (165.95ms) than for fear (164.76ms, p=.045) or happiness (164.71ms, p=.022). Additionally, latencies were significantly longer for 60% intensity faces (167.19ms) than for 40% intensity (165.19ms, p=.008), 20% intensity (164.37ms, p=.00), and neutral faces (163.80ms, p=.00). An emotion by intensity interaction was also present. Follow-up comparisons showed that at 60% intensity, latencies were longer for angry faces (169.63ms) than for fearful (165.74ms, p=.001) or happy faces (166.20ms, p=.003). In addition, for angry faces, latencies were significantly longer in response to faces of 60% intensity (169.63ms, p) than 40% intensity (165.21ms), 20% intensity (165.15ms) and neutral faces (163.80ms, all ps < 0.00).
Intent-to-Treat
The CAUG and FCG were compared in their neural response (peak amplitude and latency to peak) to emotional faces of high (60%), intermediate (40%), low (20%) and no (0%) intensities for the P1 and N170 components. There was no main group effect (nor any interactions) for the P1 peak amplitude. There was a main effect of region [F(1.63)= 8.42, p=.001, ηp2 = 0.087] such that maximum amplitude was largest over right hemisphere leads (10.35 μV), but not significantly different than the midline (10.02 μV, p=0.47). However, peak amplitude measured over the left hemisphere (9.43 μV) was significantly lower than both the midline (p=.008) and right hemisphere (p<.004). No other main effects or interactions were found for peak amplitude. Results were similar for latency to peak of the P1 component: only a main effect of region was found, F(1.71)= 21.14, p=.00, ηp2 = 0.194. Latency measured over the left hemisphere was shortest (116.06 ms), followed by the right hemisphere (117.41 ms), both of which were shorter than midline (121.52 ms, ps <.00) but not different from each other.
For N170 peak amplitude, there was a significant main effect of region [F(1.77)= 167.11, p=.00, ηp2 = 0.655] and a significant emotion by intensity interaction, F(4.68)= 2.88, p=.017, ηp2 = 0.32. Follow up comparisons for the main effect of region indicated that peak amplitudes over the left hemisphere (−1.27 μV) and right hemisphere (−0.43 μV) were no different from each other but both significantly more negative than the midline (5.28 μV, ps=0.00). Follow-up tests for the emotion by intensity interaction revealed that, at 60% intensity, the peak amplitude of the N170 was more negative for angry faces than for fearful faces (p=.02). Additionally, for angry faces, 60% intensity yielded a more negative response than 20% (p=.04).
For the N170 peak latency, we found significant main effects of emotion, F(1.91) =4.08, p=.02, ηp2 = 0.044), and intensity, F(2.68)=6.21, p=.001, ηp2 = 0.066). The follow-up pair-wise comparisons for the main effect of emotion were not significant. However, pairwise comparisons for the main effect of intensity revealed that latency to peak for expressions of 60% intensity (166.57ms) was significantly longer than for 20% intensity (163.85ms, p=0.003) and neutral faces (163.21ms, p=0.005). We also found an emotion by intensity interaction, F(4.56)= 2.32, p=.048, ηp2 = 0.026). Follow-up analyses showed that for angry expressions, the latency of the N170 component was significantly longer for faces of 60% intensity (169.26ms) than those of 40% intensity (165.08ms, p= 0.008), 20% intensity (164.47ms, p=0.001), and 0% intensity (163.21ms, p=0.00). The same analyses also revealed that at 60% intensity, angry faces yielded a longer latency (169.26ms) than fearful (164.68ms, p=0.002) or happy faces (165.76ms, p=0.019). Lastly, there was a four-way interaction between emotion, intensity, region, and group [F(7.35)= 2.18, p=0.032, ηp2 = 0.024], which was not further analyzed due the difficulty in interpretation.
Age at Placement/Percent Time in Institution
To determine whether within-group differences in emotion processing abilities could be found in the foster care sample based on the age at which they left the institution, we examined the correlations between placement age and both components of interest in response to all three emotions at 20%, 40%, and 60% intensities. Age of placement was not significantly correlated to the maximum P1 amplitude measured over the midline in response to any of the emotions displayed at any intensity. There was a significant correlation between age of placement and maximum N170 amplitude measured over the right hemisphere in response to expressions of anger at 60% intensity but not fear or happiness at any intensities [r(45) = 0.30, p=.04]. When corrected for multiple comparisons, this correlation was no longer significant.
We also conducted follow-up analyses to determine whether peak amplitudes for the P1 (measured over the midline) and N170 (measured over the right hemisphere) were associated with the percent of time individuals spent within the institution, rather than the age at which they left. Percent of time spent in institutional care was calculated as a percent of total lifetime up to age 12, and emotional expressions of 20%, 40%, and 60% intensities were used. These analyses included individuals in the CAUG and FCG. Percent of time spent in the institution was found to be negatively correlated with the peak midline amplitude of the P1 in response to fearful expressions at 40% intensity [r(90) = −0.25, p=.02], and positively correlated with the peak amplitude of the N170 measured over the right hemisphere in response to angry expressions at 20% intensity [r(90) = −0.26, p=.01]. However, when corrected for multiple comparisons, these correlations were no longer significant.
Discussion
We previously reported only minimal effects of institutional rearing on emotion-processing abilities (Moulson et al., 2009; Nelson et al., 2013), and now – with these children entering early adolescence – we considered the possibility that there might be latent (or “sleeper”) effects in face processing as a result of early social deprivation. In this study, children’s neural responses to human facial expressions of fear, anger, or happiness of any intensity, as measured by the peak amplitude and latency to peak of the P1 and N170 components, were unaffected by exposure to institutional rearing.
These results are not only consistent with the developmental trajectory prior to age 12 in this population, but also with behavioral patterns assessed contemporaneously. In one study, for example, twelve year-old children were asked to identify the emotion of neutral faces as well as others displaying happiness, sadness, anger, and fear at varying levels of intensity. While the recognition of happy and fearful faces was affected by early deprivation, the identification of sad and angry faces was comparable to that of children from the community. The authors therefore concluded that some aspects of emotion processing are unaffected by early institutional rearing (NAMES REMOVED, in press). Similarly, recent studies of social decision-making in the same population identified only subtle deficits in some aspects of facial emotion processing among children 8–10 years of age, providing no evidence of a sleeper effect in this particular domain (Moulson et al., 2015). In conjunction with these findings, our results suggest that emotional face-processing may therefore be a rare domain in which relative sparing can be found, in contrast to the profoundly adverse effects of early institutionalization found in all other areas examined to date. The question that remains is: why?
In earlier work, Nelson and colleagues have argued that experience is required for cortical systems to become specialized, including the networks involved in face-processing (Nelson et al., 2006; Nelson, 2001). Support for this reasoning can be found in a study of patients with congenital cataracts who were deprived of patterned visual input in their first months of life. When tested years after deprivation, these patients were able to normally process featural information from both faces and geometric patterns, but suffered from impaired processing of configural information specific to faces (e.g., distance between the eyes; see Le Grand, Mondloch, Maurer, & Brent, 2001; Geldart, Mondloch, Maurer, de Schonen, & Brent, 2002; Nelson et al., 2006). Studies of the “other species effect” and “other race effect” also demonstrate that typically developing infants retain the ability to discriminate types of faces to which they have been exposed, but lose the ability to identify other types (Pascalis et al., 2005; Kelly et al., 2007). Further evidence confirming the effect of early experience on development can be found in Pollak’s studies of physically abused children, who over-identified expressions of anger in comparison to healthy, non abused children (Pollak & Kistler, 2002). These studies suggest that in addition to species and race components, the emotional encoding of faces is also subject to experience-dependent mechanisms.
It is worth noting that participants in this study repeatedly viewed the same model image, though the type and intensity of each emotional expression varied. As described in the literature regarding habituation (Megela & Teyler, 1979; Turk-Browne, Scholl, & Chun, 2008), the peak amplitudes of interest may have gradually decreased due to the cumulative effect of repetition. To minimize this interference, we limited trial stimuli to expressions of fear, anger, and happiness, although faces displaying sadness or other emotions could have also been included. Additionally, a scrambled face briefly appeared after each stimulus presentation to interrupt further cognitive processing of the faces (as described in the methods above). Future extensions of this study could explore these questions of repetition and emotional variation. Another potential area for further inquiry pertains to the complexity of social interaction involved. Specifically, neural firing patterns in response to static emotional faces may not be fully representative of those underlying more complex social interactions.
Notwithstanding these limitations, our current findings coupled with previous studies about the relative sparing of facial emotion processing raise an important question: how do we account for the persistent social and behavioral abnormalities seen in this population? In other words, if across multiple tasks and multiple ages children growing up in institutions are largely indistinguishable from never institutionalized children in their ability to “read” facial emotion, what accounts for the severe deficits we and others have observed in social-emotional behavior? For instance, we know from other studies that institutionalized children suffer from a number of lasting social abnormalities including attachment disturbances and disorders and quasi-autistic symptoms (Levin, Fox, Zeanah & Nelson, 2015; Humphreys et al., 2015). One possibility is that the perceptual apparatus involved in decoding facial emotion is unaffected by social deprivation and exists independently of children’s social–emotional development. Thus, for example, we cannot explain children’s indiscriminate behavior (e.g., approaching a stranger; Gleason et al., 2014), altered attachment relationships generally (Zeanah et al., 2005), or poor peer relations (Almas et al., 2014), through the lens of “reading” emotion; the ability to accurately decode facial expressions appears to exist independently of more complex social behavior. Explaining why this is remains an active area of inquiry.
Further studies of institutionalized children and their peers are clearly necessary to answer these questions about emotional face-processing and to elucidate the neural patterns underlying more complex social interactions. The relative sparing found only in this domain provides an unparalleled opportunity for scientific exploration of a critical social skill from both an individual and evolutionary perspective. Rarely are we presented with such a window into the neural underpinnings of social abilities, and more importantly, the chance to understand how the plasticity of the human brain allows certain skills to be relatively spared in the face of early childhood adversity.
Acknowledgments
This project was supported by the John D. and Catherine T. MacArthur Foundation, the Sinneave Family Foundation, the National Institute of Mental Health and the Binder Family Foundation.
Footnotes
Financial disclosures: The authors report no biomedical financial interests or potential conflicts of interest.
References
- Almas AN, Degnan KA, Walker OL, Radulescu A, Nelson CA, Zeanah CH, Fox NA. The effects of early institutionalization and foster care intervention on children’s social behaviors at age 8. Soc Dev. 2015;24(2):225–239. doi: 10.1111/sode.12089. [DOI] [PMC free article] [PubMed] [Google Scholar]
- NAMES REMOVED. Effects of early institutionalization on emotion processing in 12 year-old youth. Dev Psychopathol. doi: 10.1017/S0954579417001377. In press. [DOI] [PMC free article] [PubMed] [Google Scholar]
- Breitmeyer BG, Haluk O. Recent models and findings in visual backward masking: a comparison, review, and update. Percept Psychophys. 2000;62(8):1572–1595. doi: 10.3758/bf03212157. [DOI] [PubMed] [Google Scholar]
- Csibra G, Kushnerenko E, Grossmann T. Electrophysiological methods in studying infant cognitive development. In: Nelson CA, Luciana M, editors. Handbook of developmental cognitive neuroscience. 2. Cambridge, MA: MIT Press; 2008. pp. 247–262. [Google Scholar]
- Eimer M. The Face-sensitivity of the N170 component. Front Hum Neurosci. 2011;5(119) doi: 10.3389/fnhum.2011.00119.. [DOI] [PMC free article] [PubMed] [Google Scholar]
- Gao X, Maurer D. A happy story: developmental changes in children’s sensitivity to facial expressions of varying intensities. J Exp Child Psychol. 2010;107:67–86. doi: 10.1016/j.jecp.2010.05.003. [DOI] [PubMed] [Google Scholar]
- Gao X, Maurer D. Influence of intensity on children’s sensitivity to happy, sad, and fearful facial expressions. J Exp Child Psychol. 2009;102:503–521. doi: 10.1016/j.jecp.2008.11.002. [DOI] [PubMed] [Google Scholar]
- Geldart S, Mondloch CJ, Maurer D, De Schonen S, Brent HP. The effect of early visual deprivation on the development of face processing. Dev Sci. 2002;5(4):490–501. doi: 10.1111/1467-7687.00242. [DOI] [Google Scholar]
- Gleason MM, Fox NA, Drury SS, Smyke AT, Nelson CA, Zeanah CH. Indiscriminate behaviors in previously institutionalized young children. Pediatrics. 2014;133(3):e657–e665. doi: 10.1542/peds.2013-0212. [DOI] [PMC free article] [PubMed] [Google Scholar]
- Humphreys KL, Zeanah CH, Scheeringa MS. Infant development. The first 3 years of life. In: Tasman A, Kay J, Lieberman JA, First MB, Riba M, editors. Psychiatry. 4. Wiley-Blackwell; 2015. [Google Scholar]
- Kelly DJ, Quinn PC, Slater AM, Lee K, Ge L, Pascalis O. The other-race effect develops during infancy. Psychol Sci. 2007;18:1084–1089. doi: 10.1111/j.1467-9280.2007.02029.x. [DOI] [PMC free article] [PubMed] [Google Scholar]
- Le Grand R, Mondloch CJ, Maurer D, Brent HP. Neuroperception: early visual experience and face processing. Nature. 2001;410:890. doi: 10.1038/35073749. [DOI] [PubMed] [Google Scholar]
- Levin AR, Fox NA, Zeanah CH, Nelson CA. Social communication difficulties and autism in previously institutionalized children. J Am Acad Child Adolesc Psychiatry. 2015;54(2):108–115. doi: 10.1016/j.jaac.2014.11.011. [DOI] [PMC free article] [PubMed] [Google Scholar]
- Maurer D, Mondloch CJ, Lewis TL. Sleeper effects. Dev Sci. 2007;10(1):40–47. doi: 10.1111/j.1467-7687.2007.00562.x. [DOI] [PubMed] [Google Scholar]
- Megela AL, Teyler TJ. Habituation and the human evoked potential. J Comp Physiol Psychol. 1979;93(6):1154–1170. doi: 10.1037/h0077630. [DOI] [PubMed] [Google Scholar]
- Moulson MC, Fox NA, Zeanah CH, Nelson CA. Early adverse experiences and the neurobiology of facial emotion processing. Dev Psychol. 2009;45:17–30. doi: 10.1037/a0014035. [DOI] [PubMed] [Google Scholar]
- Moulson MC, Shutts K, Fox NA, Zeanah CH, Spelke ES, Nelson CA. Effects of early institutionalization on the development of emotion processing: a case for relative sparing. Dev Sci. 2015;18(2):298–313. doi: 10.1111/desc.12217. [DOI] [PMC free article] [PubMed] [Google Scholar]
- Nelson CA. The development and neural bases of face recognition. Infant Child Dev. 2001;10:3–18. doi: 10.1002/icd.239. [DOI] [Google Scholar]
- Nelson CA, de Haan M, Thomas KM. Neural bases of cognitive development. In: Damon W, Lerner R, Kuhn D, Siegler R, editors. Handbook of Child Psychology, 6th Edition, Volume 2: Cognitive, Perception, and Language. New Jersey: John Wiley & Sons, Inc; 2006. pp. 3–57. [Google Scholar]
- Nelson CA, Fox NA, Zeanah CH. Romania’s Abandoned Children: Deprivation, Brain Development and the Struggle for Recovery. Cambridge, MA: Harvard University Press; 2014. [Google Scholar]
- Nelson CA, Furtado EA, Fox NA, Zeanah CH. The deprived human brain. Am Sci. 2009;97:222–229. doi: 10.1511/2009.78.222. [DOI] [Google Scholar]
- Nelson CA, Westerlund A, McDermott JM, Zeanah CH, Fox NA. Emotion recognition following early psychosocial deprivation. Dev Psychopathol. 2013;25(2):517–525. doi: 10.1017/S0954579412001216. [DOI] [PMC free article] [PubMed] [Google Scholar]
- Nelson CA, Zeanah CH, Fox NA, Marshall PJ, Smyke A, Guthrie D. Cognitive recovery in socially deprived young children: The Bucharest Early Intervention Project. Science. 2007;318:1937–1940. doi: 10.1126/science.1143921. [DOI] [PubMed] [Google Scholar]
- Olivares EI, Iglesias J, Saavedra C, Trujillo-Barreto NJ, Valdés-Sosa M. Brain Signals of Face Processing as Revealed by Event-Related Potentials. Behav Neurol. 2015;2015:514361. doi: 10.1155/2015/514361. [DOI] [PMC free article] [PubMed] [Google Scholar]
- Parker SW, Nelson CA. The impact of early institutional rearing on the ability to discriminate facial expressions of emotion: an event-related potential study. Child Dev. 2005a;76:54–72. doi: 10.1111/j.1467-8624.2005.00829.x. [DOI] [PubMed] [Google Scholar]
- Parker SW, Nelson CA. An event-related potential study of the impact of institutional rearing on face recognition. Dev Psychopathol. 2005b;17:621–639. doi: 10.1017/S0954579405050303. [DOI] [PubMed] [Google Scholar]
- Pascalis O, Scott LS, Shannon RW, Nicholson E, Coleman M, Nelson CA. Plasticity of face processing in infancy. P Natl Acad Sci USA. 2005;102:5297–5300. doi: 10.1073/pnas.0406627102. [DOI] [PMC free article] [PubMed] [Google Scholar]
- Pollak SD, Kistler DJ. Early experience is associated with the development of categorical representations for facial expressions of emotion. P Natl Acad Sci USA. 2002;99:9072–9076. doi: 10.1073/pnas/142165999. [DOI] [PMC free article] [PubMed] [Google Scholar]
- Seligman MEP. Phobias and preparedness. Behav Ther. 1971;2(3):307–320. [Google Scholar]
- Stamoulis C, Vanderwert RE, Zeanah CH, Fox NA, Nelson CA. Early psychosocial neglect adversely impacts developmental trajectories of brain oscillations and their interactions. J Cogn Neurosci. 2015;27:2512–2528. doi: 10.1162/jocn_a_00877. [DOI] [PMC free article] [PubMed] [Google Scholar]
- Tottenham N, Tanaka JW, Leon AC, McCarry T, Nurse M, Hare TA, Marcus DJ, Westerlund A, Casey BJ, Nelson C. The NimStim set of facial expressions: judgments from untrained research participants. Psych Res. 2009;168:242–249. doi: 10.1016/j.psychres.2008.05.006. [DOI] [PMC free article] [PubMed] [Google Scholar]
- Turk-Browne NB, Scholl BJ, Chun MM. Babies and brains: habituation in infant cognition and functional neuroimaging. Front Hum Neurosci. 2008;2(16) doi: 10.3389/neuro.09.016.2008. [DOI] [PMC free article] [PubMed] [Google Scholar]
- Vanderwert RE, Zeanah CH, Fox NA, Nelson CA. Normalization of EEG activity among previously institutionalized children placed into foster care: A 12-year follow-up of the Bucharest Early Intervention Project. Dev Cogn Neurosci. 2016;17:68–75. doi: 10.1016/j.dcn.2015.12.004. [DOI] [PMC free article] [PubMed] [Google Scholar]
- Vanderwert RE, Marshall PJ, Nelson CA, Zeanah CH, Fox NA. Timing of intervention affects brain electrical activtity in children exposed to severe psychosocial neglect. PLoS ONE. 2010;5:e11415. doi: 10.1371/journal.pone.0011415. [DOI] [PMC free article] [PubMed] [Google Scholar]
- Zeanah CH, Fox NA, Nelson CA. The Bucharest Early Intervention Project: Case study in the ethics of mental health research. J Nerv Ment Dis. 2012;200(3):243–247. doi: 10.1097/NMD.0b013e318247d275. [DOI] [PMC free article] [PubMed] [Google Scholar]
- Zeanah CH, Koga SF, Simion B, Stanescu A, Tabacaru CL, Fox NA, Nelson CA the BEIP Core Group. Ethical considerations in international research collaboration: The Bucharest Early Intervention Project. Infant Ment Health J. 2006;27(6):559–576. doi: 10.1002/imhj.20107. [DOI] [PubMed] [Google Scholar]
- Zeanah CH, Nelson CA, Fox NA, Smyke AT, Marshall P, Parker SW, Koga S. Designing research to study the effects of institutionalization on brain and behavioral development: The Bucharest Early Intervention Project. Dev Psychopathol. 2003;15:885–907. doi: 10.1017/s0954579403000452. [DOI] [PubMed] [Google Scholar]
- Zeanah CH, Smyke AT, Koga SF, Carlson E The Bucharest Early Intervention Project Core Group. Attachment in institutionalized and community children in Romania. Child Dev. 2005;76(5):1015–1028. doi: 10.1111/j.1467-8624.2005.00894.x. [DOI] [PubMed] [Google Scholar]