

Abstract
A clinical consequence of symptomatic Alzheimer's disease (AD) is impaired driving performance. However, decline in driving performance may begin in the preclinical stage of AD. We used a naturalistic driving methodology to examine differences in driving behavior over one year in a small sample of cognitively normal older adults with (n = 10) and without (n = 10) preclinical AD. As expected with a small sample size, there were no statistically significant differences between the two groups, but older adults with preclinical AD drove less often, were less likely to drive at night, and had fewer aggressive behaviors such as hard braking, speeding, and sudden acceleration. The sample size required to power a larger study to determine differences was calculated.
Keywords: Alzheimer's disease, older adults, naturalistic methodology, driving
Introduction
Approximately 190 million individuals in the United States are licensed to drive. With more than 30,000 annual fatalities among drivers of all age due to motor vehicle crashes, driving-related crashes are a leading cause of injury in older adults in the United States (Federal Highway Administration, 2012; National Center for Statistics and Analysis, 2015). Almost 5,000 older adults are killed and more than 200,000 are injured in crashes annually (Centers for Disease Control Prevention, 2011). In the next 40 years, the number of older adults in the United States is expected to double, resulting in a dramatic increase in the number of older drivers on the road and an additional increase in the number of years they will continue to drive (Administration on Aging, 2015; Insurance Institute for Highway Safety, 2014; Mizenko, Tefft, Arnold, & Grabowski, 2014).
Alzheimer's disease (AD) is currently the sixth leading cause of death in the United States. By 2050, one million persons will be newly diagnosed and living with symptomatic AD every year (Alzheimer's Association, 2016). Preclinical AD is defined as cognitive normality with biomarker evidence (e.g., brain imaging and cerebrospinal fluid [CSF] assays) that the disease process has begun (Carrillo et al., 2009; Clark et al., 2011; Fagan et al., 2009; Klunk et al., 2004). Individuals with preclinical AD eventually progress to symptomatic AD and will develop cognitive and functional impairments that affect complex activities such as driving (Fagan et al., 2007; Morris et al., 2009; Roe et al., 2016). As a result, preclinical AD has become a significant research area for studying the course of cognitive and functional decline, as well as a prime target for therapeutic intervention (Sperling et al., 2011; Sperling, Karlawish, & Johnson, 2013; Vos et al., 2013).
Standardized road tests and driving simulators are currently the mainstays of driving evaluation. Yet, limitations with these assessment methods include high equipment cost, difficulty replicating test conditions, observer bias, the confound of anxiety, and questionable generalizability to real-world driving behavior (Davis & Ohman, 2016; De Winter, Van Leuween, & Happee, 2012). Therefore, trends in driving research are shifting to examine naturalistic driving behaviors using GPS (Eby, Silverstein, Molnar, LeBlanc, & Adler, 2012; Molnar et al., 2014; Molnar & Eby, 2008). These in-vehicle devices gather driving data on a day-to-day basis from the actual environments that drivers access and navigate (Guo, Brake, Edwards, Blythe, & Fairchild, 2010). Studies by Eby et al. (2012) and Uc, Rizzo, Anderson, Shi, and Dawson (2004) used instrumented vehicles to examine difference in driving behaviors and errors among persons with AD and healthy controls. However, little is known about the driving behaviors of participants with and without preclinical AD in naturalistic settings. Our prior work adapted and modified a commercial, off-the-shelf, in-vehicle device for capturing daily driving behavior (Babulal et al., 2016a; Babulal et al., 2016b). The objective of this pilot study was to obtain driving behavior data in a small sample of older adults with and without preclinical AD for use in conducting power analyses to determine the sample size for a larger study. We also examined the level of agreement between objective and self-reported data on driving behavior.
Method
Participants
Participants in this pilot study were enrolled in a longitudinal study assessing preclinical AD and driving performance (R01-AG043434) at Washington University School of Medicine in St. Louis. All participants were enrolled in longitudinal studies of aging and dementia at the Knight Alzheimer's Disease Research Center of Washington University, were cognitively normal (Clinical Dementia Rating [CDR] = 0; Morris, 1993), were 65 years or older, had a valid driver's license, drove at least once per week, met minimal visual acuity for state requirements, and had in vivo imaging of cerebral beta-amyloid (Aβ42) using positron emission tomography (PET) with the amyloid tracer Pittsburgh compound B (PiB). Washington University Human Research Protection Office approved study protocols, documents, and questionnaires (no. 201412024).
AD biomarkers and clinical data measured closest to the driving behavior collection period were used. Amyloid imaging was used to assign participants to study groups. The mean cortical binding potential (MCBP) reflects fibrillar amyloid, a pathological hallmark of AD. MCBP is the average PiB retention in the prefrontal cortex, precuneus, lateral temporal cortex, and gyrus rectus, using the cerebellum as the reference. Higher levels of MCBP reflect greater burden (amyloid plaques) indicative of AD. Prior studies support use of a MCBP cutoff of ≥0.18 indicating preclinical AD (biomarker positive) that is present in ∼30% of older adults aged 65 or older (Roe et al., 2013; Roe et al., 2008; Vos et al., 2013). Participants were selected for inclusion if they endorsed “yes” on Question 15 of the Driving Habits Questionnaire (DHQ) indicating that they were always the driver when in the car (Owsley, Stalvey, Wells, & Sloane, 1999). Participants were contacted every three months to determine whether anyone else drove their vehicle. If someone else drove the vehicle, the trip was identified and excluded. Eligible participants with a MCBP of ≥0.18 were identified and randomized. These participants were contacted for recruitment until 10 participants were enrolled. We then identified participants with MCBP less than 0.18 and used frequency matching to pair them based on age with the previously enrolled. Similarly, this list of participants was contacted for recruitment until 10 participants were enrolled. All participants were unaware of their amyloid status.
Outcome Measures
Driving behavior was evaluated using a commercial GPS data logger that plugged into a vehicle's on-board diagnostics–II (OBD-II) port and sampled data every 30 seconds (G2 Tracking Device™, Model 850: Azuga Inc, San Jose, California). Each 30-s sample was a single breadcrumb, containing vehicle speed, latitude, longitude, date, and time. Raw data and trips could be reviewed using Google Maps application programming interface (API). In our research program, we labeled this process as the driving real-world in-vehicle evaluation system (DRIVES). The methodology and creation of a driving profile using the DRIVES chip has been published (Babulal et al., 2016a; Babulal et al., 2016b). Data on driving behavior were collected from July 1, 2015, to June 30, 2016, for each participant across the continental United States. Nonspatial and spatial variables were computed in R and ArcGIS (Environmental Systems Research Institute, Redlands, CA), respectively. Variables obtained from the DRIVES chip included number of trips, average miles per trip, total days with driving, number of unique destinations (outside of home/work), number of trips with hard braking, sudden acceleration, speeding, aggression, and night driving and daylight driving. Participants also completed the DHQ, a widely used self-report measure of their driving behavior over the past year (Owsley et al., 1999).
Statistical Analysis
Differences between the AD biomarker groups were examined using t tests. Power analyses to determine the number of participants needed to show a significant difference between the groups were conducted using the means and standard deviations of each group on each variable from the DRIVES chip: An alpha/significance level of .05 and power of 0.80%, β = .20) were used. Power analyses were conducted assuming equal sample sizes in the preclinical and cognitively normal (biomarker negative) groups. A p value less than .05 was considered statistically significant between variables. Pearson's correlations examined the extent to which objective data (DRIVES) captured over the year were associated with self-reported responses (DHQ). An r coefficient greater than .5 was considered to be moderately strong (Cohen, 1988). All statistical analyses were performed in SPSS Version 23 (Chicago, IL).
Results
Participants in our sample were cognitively normal, well educated, predominately Caucasian, and ranged in age from 66.4 to 80.8 years (Table 1). With the exception of MCBP, there were no group differences among demographic variables; however, participants in the PiB+ group were slightly older, had less education compared with the PiB– group, and as expected, had higher MCBP. We examined group differences across 10 metrics derived from the DRIVES chip, and determined estimated sample sizes needed for each group to power a larger study (Table 2). There were no statistically significant differences between the groups on any of the metrics. However, means and standard deviations indicated some key differences in driving behavior that trended in expected directions. As shown in Figure 1, participants with preclinical AD took fewer trips overall, but drove more miles per trip on average, and they had fewer trips with aggressive behaviors. In addition, participants with pre-clinical AD drove less at night and had fewer trips with hard braking, speeding, and sudden acceleration compared with participants without preclinical AD. There were strong (r > .50), statistically significant correlations between the DRIVES Chip and DHQ on total miles driven and mean driving area/space (Table 3), and perfect agreement on whether participants drove at night. There were no statistically significant relationships between participant report and the DRIVES chip on number of days driven each week or number of speeding occasions. Finally, there was considerable variability on the sample size required for a larger study across the different DRIVES variables; however, the majority of the variables are estimated to require fewer than 150 participants to show significant differences between the groups.
Table 1.
Participant Demographics.
| PiB-(n = 10) | PiB+ (n = 10) | Total (N = 20) | |
|---|---|---|---|
| Age, M (SD), years | 72.4 (3.7) | 73.9 (4.1) | 73.1 (3.9) |
| Women, n (%) | 4 (40.0) | 3 (30.0) | 7 (35.0) |
| African American, n (%) | 1 (10.0) | 1 (10.0) | 2 (10.0) |
| Education, M (SD), y | 16.8 (1.7) | 15.8 (2.7) | 16.3 (2.3) |
| APOE4+, n (%) | 3 (30.0) | 4 (40.0) | 7 (35.0) |
| MMSE, M (SD) | 29.2 (1.3) | 29.1 (1.0) | 29.1 (1.1) |
| MCBP for PET PiB, M (SD)* | 0.21 (0.5) | 0.44 (0.3) | 0.25 (0.3) |
Note. APOE4 = apolipoprotein E ε4; MMSE = mini-mental state examination (0-30 with 30 = perfect score); MCBP = mean cortical binding potential; PiB = Pittsburgh compound B.
p < .05.
Table 2.
Means, Standard Deviations, and Number of Participants Needed in Each Group to Show Significant Differences on Naturalistic Driving Outcomes Derived From DRIVES Chip.
| Naturalistic driving outcomes | PiB– M (SD) | PiB+ M (SD) | p value | Sample size needed for each group (α, β) |
|---|---|---|---|---|
| Total number of trips | 1,457.7 (507.5) | 1,194.8 (498.5) | .26 | 97 |
| Average miles per trip | 6.18 (2.91) | 7.97 (5.0) | .34 | 137 |
| Total days driven | 281.8 (51.0) | 271.9 (54.8) | .68 | 744 |
| Number of unique destinations | 216.4 (78.4) | 189.9 (85.4) | .47 | 250 |
| Total trips with hard braking | 170.6 (122.0) | 104.6 (64.6) | .15 | 58 |
| Total trips with sudden acceleration | 139.8 (129.3) | 82.0 (91.6) | .26 | 99 |
| Total trips with speeding | 77.5 (157.8) | 50.8 (62.9) | .63 | 15 |
| Total trips with aggression | 314.9 (208.0) | 200.9 (135.4) | .16 | 68 |
| Total trips at night | 81.0 (45.9) | 50.5 (54.6) | .19 | 73 |
| Total trip in daylight | 1,224.8 (438.4) | 988.4 (466.7) | .26 | 97 |
Note. α = .5; β = .20. PiB- = No preclinical Alzheimer's disease as determined by PET Pittsburgh compound B imaging; PiB+ = Evidence of preclinical Alzheimer's disease as determined by PET Pittsburgh compound B imaging.
Figure 1.
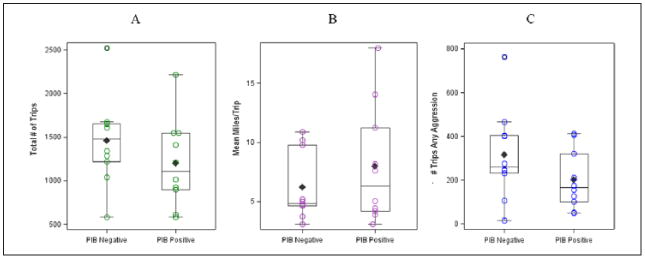
Box plots with distributions of scores, medians, and interquartile ranges for the total number of trips, mean miles per trip, and number of trips with any aggressive behaviors captured with the DRIVES chip during the 1-year pilot study.
Note. DRIVES = driving real-world in-vehicle evaluation system; PiB = Pittsburgh compound B.
Table 3.
Correlations Between DRIVES Chip and DHQ Outcomes.
| DRIVES days per week | DHQ days per week | DRIVES number of trips | DHQ number of trips | DRIVES number of miles | DHQ number of miles | DRIVES drive area/space | DHQ drive area/space | |
|---|---|---|---|---|---|---|---|---|
| DRIVES days per week | 1 | |||||||
| DHQ days per week | .401 | 1 | ||||||
| DRIVES number of trips | 799** | .483* | 1 | |||||
| DHQ number of trips | .191 | .655** | .412 | 1 | ||||
| DRIVES number of miles | .294 | .308 | .648** | .566** | 1 | |||
| DHQ number of miles | .069 | .389 | .467* | .770** | .829** | 1 | ||
| DRIVES drive area/space | .166 | .243 | .441 | .263 | .702** | .581** | 1 | |
| DHQ drive area/space | −.428 | −.173 | −.279 | .013 | .047 | −.030 | −.269 | 1 |
Note. DRIVES chip = driving real-world in-vehicle evaluation system; DHQ = Driving Habits Questionnaire.
Correlation is significant at the .05 level (two-tailed).
Correlation is significant at the .01 level (two-tailed).
Discussion
This pilot study sought to characterize driving behaviors among 10 older adults with and 10 older adults without preclinical AD over a 1-year period using a naturalistic driving methodology, and to use this information to determine the number of participants needed to power a larger study. As expected given the small sample size, differences between the two groups were not significant on the variables from the DRIVES chip. However, the results are consistent with the direction of differences found when comparing cognitively normal persons with those with mild symptomatic AD. Older adults with mild AD have been found to drive fewer miles overall and not take as many trips (Eby et al., 2012), but may drive more per trip due to challenges with navigation and getting lost (Uc et al., 2004), and were found to be more cautious in their driving, thus not engaging in active and aggressive behaviors such as speeding or sudden acceleration (Cox, Quillian, Thorndike, Kovatchev, & Hanna, 1998). Continued longitudinal follow-up will be instrumental in delineating group differences and the impact of preclinical and symptomatic AD on daily driving behavior.
When we examined the associations between self-reported driving behavior on the DHQ and objective data captured by the DRIVES chip, there was stronger agreement for global driving behavior but less so for trip-specific daily driving behaviors. There was strong agreement between both measures on whether participants drove at night, number of days driven per week, and number of trips/miles per week. However, self-report on driving behaviors such as speeding or driving area/space was weak and underreported on the DHQ. Given that self-reported data are influenced by both memory and perception, perfect correlations were not expected. However, our findings indicate that the data captured with the DRIVES chip correspond reasonably well with self-reported driving data.
Small samples have been cited as a consistent and significant barrier in driving research due to the expense and feasibility of many driving studies (Hird, Egeto, Fischer, Naglie, & Schweizer, 2016). Given this obstacle, it is important to take into account study design, cost, and overall participant burden, especially in the AD population. Although some granting agencies and institutes require sample size justification, power calculations are fundamental considerations for most study designs and are extremely beneficial in conserving resources, time, and reducing participant burden (Aberson, 2011; Murphy, Myors, & Wolach, 2014). Computed sample sizes needed to find significant difference might require up to 300 participants (150 per group). However, some for the DRIVES variables (e.g., hard braking, aggression, and trips driven at night) may be more sensitive in predicting driving problems in a preclinical cohort. Persons with AD who still drive tend to self-regulate their driving by avoiding inclement weather, speeding, high traffic, congested roads, night driving, and single, short trips (Davis & Ohman, 2016; Eby et al., 2012). These self-regulatory practices may start in preclinical AD and be identifiable during naturalistic driving. Other factors that may affect driving and self-regulation include vision problems, comorbidities, anxiety, and change mobility needs (Chapman, Sargent-Cox, Horswill, & Anstey, 2014; Meng & Siren, 2012; Siren & Haustein, 2016; Weeks, Stadnyk, Begley, & MacDonald, 2015). It is important to consider each factor in future naturalistic driving studies.
There were some limitations including a small sample size for this pilot. The DRIVES chip can only function in vehicles built in 1996 or newer. PET PiB testing may not be available in clinics and hospitals, nor is it covered by insurance. Although every effort was made to exclude trips not made by the participant, recall and self-report are limited and another driver may have made a small percentage of trips. However, this is not expected to affect the volume of data collected over the year for each participant. Finally, although all participants were cognitively normal (CDR = 0) and performed well on the mini-mental state examination (MMSE), robust neuropsychological testing may be more sensitive in detecting impairments in cognitive functioning.
Conclusion
Driving is an important activity that affords the ability to maintain independence, work outside the home, manage health, and participate in communities. Decline in driving performance among older drivers is becoming an increasing area of public and research interest especially with a projected increase in AD and as older adults continue to drive much longer. Naturalistic methodologies such as the DRIVES chip offer an affordable, objective, and data-driven alternative to examine driving behavior over time to identify changes and decline. We have demonstrated the feasibility, acceptability, and utility of the DRIVES chip in this pilot study. Larger studies, together with longer longitudinal follow-up periods (e.g., five years), are needed to determine group differences between those with and without preclinical AD. Naturalistic driving such as the DRIVES chip has real potential to provide correlates of driving safety, assist with fitness to drive decisions, and strategically map out safer and more efficient driving routes. Finally, identifying older adults who are moving toward driving retirement could assist with timely mobility counseling or suggest interventions to improve confidence and extend driving for those that are still safe.
Acknowledgments
Funding: The authors disclosed receipt of the following financial support for the research, authorship, and/or publication of this article: Funding for this study was provided by Washington University (University Research Strategic Alliance [URSA] 2016), the National Institute on Aging (R01-AG043434, R01-AG43434-03S1, P50-AG05681, P01-AG03991, P01-AG026276), Fred Simmons and Olga Mohan, the Charles and Joanne Knight Alzheimer's Research Initiative of the Washington University Knight Alzheimer's Disease Research Center, and the Washington University Institute of Clinical and Translational Sciences (UL1 TR000448 from the National Center for Advancing Translational Sciences [NCATS]). Imaging facilities were supported by the Washington University Institute of Clinical and Translational Sciences (UL1 TR000448 from the NCATS of the National Institutes of Health [NIH]). Imaging analyses used the services of the Neuroimaging Informatics and Analysis Center, supported by the NIH (5P30NS048056).
Biographies
Ganesh M. Babulal is a postdoctoral fellow. He is also a licensed and registered occupational therapist with 6 years of geriatric practice experience. He led the recent development of the driving real-world in-vehicle evaluation system (DRIVES) naturalistic driving methodology and conducted a pilot study on that methodology.
Sarah H. Stout is a licensed social worker and clinical research coordinator of the Roe Laboratory. She supported the methodological development of the DRIVES, tests participants, and maintains operations of all lab protocols.
Tammie L. S. Benzinger is associate professor of radiology and neurological surgery and a board-certified neuroradiologist. She is also the clinical director of Neuromagnetic Resonance Imaging, the physician director for Magnetic Resonance (MR) at the Center for Clinical Imaging Research (CCIR), and the MR Safety Officer for Barnes-Jewish Hospital.
Brian R. Ott is a professor of neurology at the Warren Alpert Medical School of Brown University and directs the Alzheimer's Disease and Memory Disorders Center at Rhode Island Hospital. He has been continually funded by National Institute on Aging (NIA) since 2001 for his research on the effects of cognitive impairment on driving in older adults, including naturalistic driving methodologies and preclinical Alzheimer's disease (AD) biomarkers.
David B. Carr is a professor of geriatric medicine and neurology at Washington University School of Medicine (WUSM) and medical director of The Rehabilitation Institute of St. Louis. He has published extensively on driving performance in clinical populations including those with Alzheimer disease.
Mollie Webb is a geographic information system (GIS) programmer analyst in the Department of Earth and Planetary Science. She has extensive experience using GIS software to conduct spatial analyses, spatial data management, and curation.
Cindy M. Traub is a data specialist in data and GIS services at Washington University. She specializes in applied mathematics, geometry and topology, computing spatial algorithms, and data mining.
Aaron Addison is the director of Data and GIS Services at Washington University, He and his team bring expertise and experience in data management and GIS to support data analytics and mapping visualization.
John C. Morris is The Harvey and Dorismae Hacker Friedman Distinguished Professor of neurology and director and principal investigator for the Knight Alzheimer's Disease Research Center at Washington University. Under his leadership, the Knight ADRC conducts innovative research examining preclinical AD biomarkers.
David K. Warren is a professor of medicine. He is an infectious disease physician and hospital epidemiologist at Barnes-Jewish Hospital who has research experience in health care-associated infections and public health. He is also the program director for the master of science in Clinical Investigation Program at WUSM and has extensive experience in clinical and epidemiological research methodology.
Catherine M. Roe is an associate professor of neurology. She has led and published several studies examining the impact of preclinical AD measured using cerebrospinal fluid and imaging biomarkers. She has produced work detailing the importance of cognitive and brain reserve in the prediction of preclinical AD, and she was a cocreator of the Assessing Dementia 8 (AD8).
Footnotes
Declaration of Conflicting Interests: The authors declared no potential conflicts of interest with respect to the research, authorship, and/or publication of this article.
Reprints and permissions: sagepub.com/journalsPermissions.nav
References
- Aberson CL. Applied power analysis for the behavioral sciences. New York, NY: Routledge; 2011. [Google Scholar]
- Administration on Aging. Profile of Older Americans: 2015. 2015 Retrieved from http://www.aoa.gov/AoARoot/Aging_Statistics/Profile/index.aspx.
- Alzheimer's Association. 2016 Alzheimer's disease facts and figures. Alzheimer's & Dementia. 2016 doi: 10.1016/j.jalz.2016.03.001. Retrieved from http://www.alz.org/documents_custom/2016-facts-and-figures.pdf. [DOI] [PubMed]
- Babulal GM, Addison A, Ghoshal N, Stout SH, Vernon EK, Sellan M, Roe CM. Development and interval testing of a naturalistic driving methodology to evaluate driving behavior in clinical research. F1000Research. 2016a;5 doi: 10.12688/f1000research.9150.1. Article 1716. [DOI] [PMC free article] [PubMed] [Google Scholar]
- Babulal GM, Traub CM, Webb M, Stout SH, Addison A, Carr DB, Roe CM. Creating a driving profile for older adults using GPS devices and naturalistic driving methodology. F1000Research. 2016b;5 doi: 10.12688/f1000research.9608.1. Article 2376. [DOI] [PMC free article] [PubMed] [Google Scholar]
- Carrillo MC, Blackwell A, Hampel H, Lindborg J, Sperling R, Schenk D, Craft S. Early risk assessment for Alzheimer's disease. Alzheimer's & Dementia. 2009;5:182–196. doi: 10.1016/j.jalz.2009.01.019. [DOI] [PubMed] [Google Scholar]
- Centers for Disease Control Prevention. Web-based Injury Statistics Query and Reporting System (WISQARS) Atlanta, GA: National Center for Injury Prevention and Control, Centers for Disease Control Prevention; 2011. [Google Scholar]
- Chapman L, Sargent-Cox K, Horswill MS, Anstey KJ. The impact of age stereotypes on older adults' hazard perception performance and driving confidence. Journal of Applied Gerontology. 2014;65:642–652. doi: 10.1177/0733464813517505. [DOI] [PubMed] [Google Scholar]
- Clark CM, Schneider JA, Bedell BJ, Beach TG, Bilker WB, Mintun MA, Flitter ML. Use of florbetapir-PET for imaging β-amyloid pathology. Journal of the American Medical Association. 2011;305:275–283. doi: 10.1001/jama.2010.2008. [DOI] [PMC free article] [PubMed] [Google Scholar]
- Cohen J. Statistical power analysis for the behavioral science. Hillsdale, NJ: Lawrence Erlbaum; 1988. [Google Scholar]
- Cox DJ, Quillian WC, Thorndike FP, Kovatchev BP, Hanna G. Evaluating driving performance of outpatients with Alzheimer disease. The Journal of the American Board of Family Practice. 1998;11:264–271. doi: 10.3122/jabfm.11.4.264. [DOI] [PubMed] [Google Scholar]
- Davis RL, Ohman JM. Driving in early-stage Alzheimer's disease: An integrative review of the literature. Research in Gerontological Nursing. 2016 doi: 10.3928/19404921-20160920-02. Advance online publication. [DOI] [PubMed] [Google Scholar]
- De Winter J, Van Leuween P, Happee P. Advantages and disadvantages of driving simulators: A discussion. Proceedings of Measuring Behavior. 2012:47–50. doi: 10.1016/j.beproc.2013.02.010. [DOI]
- Eby DW, Silverstein NM, Molnar LJ, LeBlanc D, Adler G. Driving behaviors in early stage dementia: A study using in-vehicle technology. Accident Analysis & Prevention. 2012;49:330–337. doi: 10.1016/j.aap.2011.11.021. [DOI] [PubMed] [Google Scholar]
- Fagan AM, Mintun MM, Shah AR, Aldea P, Roe CM, Mach RH, Holtzman DM. Cerebrospinal fluid tau and ptau181 increase with cortical amyloid deposition in cognitively normal individuals: Implications for future clinical trials of Alzheimer's disease. EMBO Molecular Medicine. 2009;1:371–380. doi: 10.1002/emmm.200900048. [DOI] [PMC free article] [PubMed] [Google Scholar]
- Fagan AM, Roe CM, Xiong C, Mintun MA, Morris JC, Holtzman DM. Cerebrospinal fluid tau/β-amyloid42 ratio as a prediction of cognitive decline in nondemented older adults. Archives of Neurology. 2007;64:343–349. doi: 10.1001/archneur.64.3.noc60123. [DOI] [PubMed] [Google Scholar]
- Federal Highway Administration. Highway statistics 2012. U.S. Department of Transportation; 2012. Retrieved from https://www.fhwa.dot.gov/policyinformation/statistics/2012/ [Google Scholar]
- Guo AW, Brake JF, Edwards SJ, Blythe PT, Fairchild RG. The application of in-vehicle systems for elderly drivers. European Transport Research Review. 2010;2:165–174. [Google Scholar]
- Hird MA, Egeto P, Fischer CE, Naglie G, Schweizer TA. A systematic review and meta-analysis of on-road simulator and cognitive driving assessment in Alzheimer's disease and mild cognitive impairment. Journal of Alzheimer's Disease. 2016;53:713–729. doi: 10.3233/JAD-160276. [DOI] [PubMed] [Google Scholar]
- Insurance Institute for Highway Safety. Fatality facts 2013 Older people. 2014 Retrieved from http://www.iihs.org/iihs/topics/t/older-drivers/fatalityfacts/older-people/2013.
- Klunk WE, Engler H, Nordberg A, Wang Y, Blomqvist G, Holt DP, Estrada S. Imaging brain amyloid in Alzheimer's disease with Pittsburgh Compound-B. Annals of Neurology. 2004;55:306–319. doi: 10.1002/ana.20009. [DOI] [PubMed] [Google Scholar]
- Meng A, Siren A. Older drivers' reasons for reducing the overall amount of their driving and for avoiding selected driving situations. Journal of Applied Gerontology. 2012;34:NP62–NP82. doi: 10.1177/0733464812463433. [DOI] [PubMed] [Google Scholar]
- Mizenko AJ, Tefft BC, Arnold LS, Grabowski J. Older American drivers and traffic safety culture: A LongROAD Study. Washington, DC: Transportation Research Board; 2014. [Google Scholar]
- Molnar LJ, Charlton JL, Eby DW, Langford J, Koppel S, Kolenic GE, Marshall S. Factors affecting self-regulatory driving practices among older adults. Traffic Injury Prevention. 2014;15:262–272. doi: 10.1080/15389588.2013.808742. [DOI] [PubMed] [Google Scholar]
- Molnar LJ, Eby DW. The relationship between self-regulation and driving-related abilities in older drivers: An exploratory study. Traffic Injury Prevention. 2008;9:314–319. doi: 10.1080/15389580801895319. [DOI] [PubMed] [Google Scholar]
- Morris JC. The Clinical Dementia Rating (CDR): Current version and scoring rules. Neurology. 1993;43:2412–2414. doi: 10.1212/wnl.43.11.2412-a. [DOI] [PubMed] [Google Scholar]
- Morris JC, Roe CM, Grant EA, Head D, Storandt M, Goate AM, Mintun MA. Pittsburgh compound B imaging and prediction of progression from cognitive normality to symptomatic Alzheimer disease. Archives of Neurology. 2009;66:1469–1475. doi: 10.1001/archneurol.2009.269. [DOI] [PMC free article] [PubMed] [Google Scholar]
- Murphy KR, Myors B, Wolach A. Statistical power analysis: A simple and general model for traditional and modern hypothesis tests. New York, NY: Routledge; 2014. [Google Scholar]
- National Center for Statistics and Analysis. Older population: Traffic safety facts 2012 data. Washington, DC: U.S. Department of Transportation; 2015. (DOT HS 812,005) [Google Scholar]
- Owsley C, Stalvey B, Wells J, Sloane ME. Older drivers and cataract: Driving habits and crash risk. The Journals of Gerontology, Series A: Biological Sciences & Medical Sciences. 1999;54:203–211. doi: 10.1093/gerona/54.4.m203. [DOI] [PubMed] [Google Scholar]
- Roe CM, Barco PP, Head DM, Ghoshal N, Selsor N, Babulal GM, Morris JC. Amyloid imaging, cerebrospinal fluid biomarkers predict driving performance among cognitively normal individuals. Alzheimer Disease & Associated Disorders. 2016 doi: 10.1097/wad.0000000000000154. Advance online publication. [DOI] [PMC free article] [PubMed] [Google Scholar]
- Roe CM, Fagan AM, Grant EA, Hassenstab J, Moulder KL, Dreyfus DM, Holtzman DM. Amyloid imaging and CSF biomarkers in predicting cognitive impairment up to 7.5 years later. Neurology. 2013;80:1784–1791. doi: 10.1212/WNL.0b013e3182918ca6. [DOI] [PMC free article] [PubMed] [Google Scholar]
- Roe CM, Mintun MA, D'Angelo G, Xiong C, Grant EA, Morris JC. Alzheimer disease and cognitive reserve: Variation of education effect with carbon 11-labeled Pittsburgh Compound B uptake. Archives of Neurology. 2008;65:1467–1471. doi: 10.1001/archneur.65.11.1467. [DOI] [PMC free article] [PubMed] [Google Scholar]
- Siren A, Haustein S. Driving cessation anno 2010 which older drivers give up their license and why? Evidence from Denmark. Journal of Applied Gerontology. 2016;35:18–38. doi: 10.1177/0733464814521690. [DOI] [PubMed] [Google Scholar]
- Sperling RA, Aisen PS, Beckett LA, Bennett DA, Craft S, Fagan AM, Montine TJ. Toward defining the preclinical stages of Alzheimer's disease: Recommendations from the National Institute on Aging-Alzheimer's Association workgroups on diagnostic guidelines for Alzheimer's disease. Alzheimer's & Dementia. 2011;7:280–292. doi: 10.1016/j.jalz.2011.03.003. [DOI] [PMC free article] [PubMed] [Google Scholar]
- Sperling RA, Karlawish J, Johnson KA. Preclinical Alzheimer disease—The challenges ahead. Nature Reviews Neurology. 2013;9:54–58. doi: 10.1038/nrneurol.2012.241. [DOI] [PMC free article] [PubMed] [Google Scholar]
- Uc EY, Rizzo M, Anderson SW, Shi Q, Dawson JD. Driver route-following and safety errors in early Alzheimer disease. Neurology. 2004;63:832–837. doi: 10.1212/01.wnl.0000139301.01177.35. [DOI] [PubMed] [Google Scholar]
- Vos SJB, Xiong C, Visser PJ, Jasielec MS, Hassenstab J, Grant EA, Fagan AM. Preclinical Alzheimer's disease and its outcome: A Longitudinal Cohort Study. The Lancet Neurology. 2013;12:957–965. doi: 10.1016/S1474-4422(13)70194-7. [DOI] [PMC free article] [PubMed] [Google Scholar]
- Weeks LE, Stadnyk R, Begley L, MacDonald DJ. The influence of driving status on transportation challenges experienced by older adults. Journal of Applied Gerontology. 2015;34:501–517. doi: 10.1177/0733464813487255. [DOI] [PubMed] [Google Scholar]