

Abstract
Skin scar formation is a complex process that results in the formation of dense extracellular matrix without normal skin appendages such as hair and glands. The absence of a scarless healing model in adult mammals prevents the development of successful therapies. We show that irreversible electroporation of skin drives its regeneration with all accessory organs in normal adult rats. Pulsed electric fields at 500 V, with 70 μs pulse duration, and 1000 pulses delivered at 3 Hz, applied through two electrodes separated by 2 mm lead to massive cell death. However, the extracellular matrix architecture of the skin was preserved. Six months after the ablation, the epidermis, sebaceous glands, panniculus carnosus, hair follicles, microvasculature and arrector pili muscle were altogether re-formed in the entire ablated area. These results suggest a key role of the extracellular matrix architecture in the differentiation, migration, and signaling of cells during scarless wound healing.
1. Introduction
Scars, caused by trauma or burn injury, remain an enigma throughout the long history of human medicine. Scar formation is a complex process involving the interplay of growth factors, proteolytic enzymes, angiogenesis factors, and fibrogenic factors, which stimulate the increased deposition of extracellular matrix by myofibroblasts (Duffield et al., 2012). Numerous studies have identified genomic (Smith et al., 2008; Thompson et al.,), epigenetic (Gibran, 2014; Russell et al., 2010), and environmental factors (Eto et al., 2012) that favor the formation of scars; however, the exact mechanisms inducing the formation of scar tissue rather than normal skin are unknown (Duffield et al., 2012). Current data show that alterations in coagulation, inflammation, angiogenesis, fibroplasia, contraction, remodeling (DiPietro, 2012; Koh and DiPietro, 2011; Robson, 2003) and mechanical tension correlate with an increased proliferation of scars (Aarabi et al., 2007; Seifert et al., 2012; Wong et al., 2011). But as of yet, the role of the extracellular matrix (ECM) and corresponding molecular mechanisms that induce scarring are not well understood, due to the lack of scarless regeneration in mammals. This gap of knowledge limits our fundamental understanding of tissue remodeling and leads to limited clinical success of the treatment of scars (Sonnemann and Bement, 2011). Interestingly, recent studies reported decreased fibrosis in the liver tissue following tumor ablation in humans using irreversible electroporation (IRE) (Narayanan, 2011).
IRE is a non-thermal tissue ablation technique, where pulsed electric fields cause irreversible damage to cells by creating nanoscale pores in the cellular membrane, while sparing the surrounding tissue scaffold, large blood vessels, and other accessory structures (Golberg and Yarmush, 2013; Phillips et al., 2010; Rubinsky et al., 2007; Sano et al., 2010). Several hypotheses describing the mechanisms of IRE associated cell death have been proposed, including deformation of the cellular membrane lipid layer (Crowley, 1973; Michael and O’Neill, 1970; Steinchen et al., 1982), altered phase transition (Sugár, 1979), breakdown of interfaces between the lipid domains with different compositions (Cruzeiro-Hansson and Mouritsen, 1988), or denaturing of the membrane proteins (Tsong, 1991). However, all these explanations remain inconclusive (Weaver and Chizmadzhev, 1996). Recently, investigators proposed that IRE induces aqueous pores in the lipid bilayer (Kotnik et al., 2012; Spugnini et al., 2007; Weaver and Chizmadzhev, 1996), largely based on thermodynamic rationales, as the aqueous pores start by penetration of water molecules into the lipid bilayer when the applied pulsed electric field transmembrane potential threshold is achieved (Kotnik et al., 2012). This leads to reorientation of the adjacent lipids with their polar head groups facing the water molecules forming stable pores (Kotnik et al., 2012). When the IRE field creates large enough and constant pores this could subsequently lead to cell death. IRE has been used in multiple clinical trials to ablate solid tumors (Chunlan et al., 2015), and to treat cardiac arrhythmias (Deodhar et al., 2011). Previous studies suggest that IRE causes cell death while preserving the ECM as well as the vasculature and leads to tissue regeneration (Rubinsky et al., 2007).
Our previous work has shown that mild pulsed electric fields leads to skin injury resulting in rejuvenation (Golberg et al., 2015b). Furthermore, we have recently shown that completely ablated normal rat liver regenerates without fibrosis (Golberg et al., 2016), confirming earlier hypothesis (Rubinsky et al., 2007). In addition, we have also shown that partial IRE (pIRE) reduces scars after burn injury in rats (Golberg et al., 2016b). The importance of the extracellular matrix for functional tissue regeneration has long been recognized and multiple attempts of tissue engineering aspire to re-engineer the matrix architecture (Place et al., 2009). However, the importance of naïve ECM organization in the wound healing has not been demonstrated in vivo, because of the lack of a suitable model. Based on these findings, we tested the hypothesis whether calibrated IRE treatment causes skin ablation associated with preservation of tissue ECM and scarless tissue regeneration in rats.
2. Materials and Methods
2.1 Animals
Female Sprague-Dawley rats (~200 g, N = 104, 6-weeks old) were purchased in Charles River Laboratories (Wilmington, MA). The animals were housed in cages with access to food and water ad libitum, and were maintained on a 12-hour light/dark cycle in a temperature-controlled room. All animal procedures were approved by the Institutional Animal Care and Use Committee (IACUC) of the Massachusetts General Hospital. All procedures were in accordance with the guidelines of the National Research Council.
2.2 Irreversible electroporation
Prior to IRE treatment, animals (N = 5 per each time point) were anesthetized with isoflurane. Their fur was clipped along the dorsal surfaces and treated with depilatory cream (Sally Hansen®Div. Del Laboratories, Inc., Farmingdale. NY). Subsequently, a designated area was subjected to electroporation using contact electrodes with a surface area of 1 cm2. PEF specifications are as follows: 1000 pulses, 500 V, 2 mm gap between the electrodes, 70 μs duration, 3 Hz. Square pulses were delivered using a BTX 830 pulse generator (Harvard Apparatus Inc, Holliston, MA). Currents were measured in vivo using a PicoScope 4224 Oscilloscope with Pico Current Clamp (60A AC/DC) and analyzed with Pico Scope 6 software (Pico technologies Inc., UK).
2.3 Numerical modeling of the electric field distribution
The electrical and thermal properties of the skin layers used for the modeling (QuickField Software, Terra Analysis, Denmark) appear in Table S1 (Hasgall, PA et al., 2014; Pavšelj and Miklavčič, 2008). Skin tissue features both electrical properties: resistance and capacitance. However, the charging time of the capacitive component of healthy skin is very small (~ 1 μs) in comparison to the pulse duration used in this study (70 μs )(Weaver, 2000). Thus, we used a direct current conductance model to calculate the distribution of the electric field in the heterogeneous skin. To estimate the local electric field strength at each point in the skin, we used the Laplace equation as follows:
| (1) |
where σ is the electrical conductivity (Siemens m−1), and U (Volts) is the electric potential. We calculated the electric field distribution in the different skin layers under the following boundary conditions applied on the two electrodes: cathode 0 V and anode 500 V. The thermal model for the similar electroporation setup was developed previously (Golberg et al., 2015b).
2.4 Burn Injury
Before the creation of third-degree burns, the animals (N = 5 per each time point) were anesthetized with isoflurane and their fur was clipped along the dorsal surfaces. Burns were incurred by pressing the end of a pre-heated (≥ 95°C) brass block against the rat’s dorsum for 10 seconds, resulting in a non-lethal, full-thickness, third-degree burn, measuring approximately 1 cm2. Burn injury and IRE were performed on the same animals on sites 2 cm apart from each other along the head to tail axis.
2.5 Polarization sensitive optical coherence tomography
PS-OCT was performed as reported in detail previously (Lo et al., 2016; Villiger et al., 2013) In short, a wavelength-swept laser source operating at a center wavelength of 1320 nm was used, achieving an axial resolution of 9.4 μm, and operating at an A-line rate of 54 kHz. Volumetric imaging was performed by scanning an area of 10 × 5 mm, consisting of 2048 A-lines/image × 256 images, with a focused beam featuring a lateral resolution of 15 μm. The lesions were apposed against a glass slide with ultrasound-gel as immersion liquid to center the superficial layers in focus. Two to three volumes were acquired for each lesion and time point, overlapping the fields of view to image the entire lesions. The polarization state of the input light was modulated between circular and linear polarization between adjacent A-lines, and the signal was detected with a polarization diverse receiver. Longitudinal imaging was performed on three animals at 0, 6, 12, 24 and 72 h, and 1, 2, 3, 4, 5, 8, 12, 16, 20 and 24 weeks.
The data was reconstructed with spectral binning (Villiger et al., 2013), using 1/5th of the spectral bandwidth, a lateral Gaussian filter with a full width at half maximum (FWHM) equal to 12 adjacent A-lines, and an axial offset of 48 μm to derive tissue birefringence. Tissue birefringence rotates the polarization state of the probing light, as visualized on the Poincaree-sphere, and is expressed in deg/μm. The DOP was evaluated independently for each spectral bin and input polarization state over the same lateral Gaussian kernel, and then averaged. DOP expresses the randomness of the measured polarization states in small neighborhood and scales from 0 (completely random) to unity (uniform). The structural intensity tomograms are displayed in logarithmic scale as gray scale images. Birefringence was mapped from 0 to 1.2 deg/μm with an isoluminant colormap, and overlayed with the gray-scale intensity image. DOP is scaled from 0.5 to 1 and is rendered in the same colormap. For quantitative analysis, the various time points were aligned and the mean birefringence and DOP over the identical central cylindrical region of diameter 1.4 mm and 0.25 mm height, centered 0.5 mm below the tissue surface were computed. The errors were computed over the same region.
2.6 Laser Doppler Scanning
A laser Doppler imager (Moor Instruments, Wilmington, DE) was used to assess blood flow. The laser Doppler source was mounted on a movable rack exactly 10 cm above the dorsum of the rat after the animal was anesthetized and restrained on the underlying table. Five animals were imaged at each time point. The laser beam (780 nm) reflected from circulating red blood cells in capillaries, arterioles, and venules was detected and processed to provide a computerized, color-coded image. By using image analysis software (Laser Doppler Perfusion Measure, Version 3.08; Moor Instruments), mean flux values representing blood flow were calculated from the relative flux units for the areas corresponding to the dorsum of the rats. The analyzed region of interest was 0.25 by 0.25 cm. Baseline images were obtained from each rat before treatment was administered. Then, the rats were treated by IRE or burn, and serial laser Doppler images were obtained subsequently. For analysis, we calculated the ratio of the mean flux value at the center of the treated area (black box Fig. 7q) with the mean flux value at the edge of the treated area (white box Fig. 7q).
2.7 Skin mechanical properties measurement
To assess skin mechanical properties, we performed tensile mechanical testing on excised samples. Skin at the treated sites (1 cm2) was excised at 1 day, 3 days, 1 week, 3 weeks, 2 months and 6 months (Five animals per time point). Skin samples were placed in standard saline solution before tension measurement. Tension measurements were performed within 1 hour after the excision. Before measurement, the thickness of each sample was measured. Skin samples were mounted on the Expert4000 tensiometer (ADMET, MA). The load was applied using a 1000g-Tension-1344004 transducer. “Stress at extension”-type of analysis was chosen on the MTESTQuattro software (ADMET, MA). Stress was applied using a ramp waveform to cause a 2 mm/min extension rate. The elongation/stress data was exported to Microsoft Excel ver.7. Young’s modulus was extracted from the linear part of the stress-strain curve using the following equation 2:
| (2) |
where Y (Nmm−2) is the elastic Young’s modulus, F (N) is the applied force, A0 is the cross-section of the skin samples, ΔL (mm) is the elongation of the skin sample under force, and L0 (mm) is the original length of the tested sample.
2.8 Histology
Specimens were harvested immediately after the injury, 6 hours, 12 hours, 1 day, 3 days, 1 week, 3 weeks, 2 and 6 months following the initial treatment. Five animals were euthanized for each time point. Five animals were used as controls. Skin samples were fixed in 10% formalin, embedded in paraffin, and cut into 7 μm thick sections. Sections were stained with hematoxylin and eosin (H&E), Herovici, Masson’s trichrome and Verhoeff–Van Gieson stain. Tissues were processed and stained by the Rodent Histopathology Core at Harvard Medical School. Slides were evaluated by three individual investigators, including an experienced dermatopathologist. Two investigators were blinded to the origin of the specimens. Color images of each entire tissue section were acquired using a NanoZoomer Digital Pathology System (Nanozoomer 2.0-HT slide scanner, Hamamatsu, Hamamatsu City, Japan).
2.9 Automated image analysis of trichrome stain for fiber density and orientation
Fiber density and orientation were calculated from images of Masson’s Trichrome stained sections using previously established image processing algorithms (Quinn et al., 2015). Briefly, collagen fibers were identified from the images (Five animals at each time point) where the ratio of blue-to-red intensities exceeded a value of 2. Local fiber density was determined by the relative amount of collagen-positive pixels within a 90 pixel radius. Fiber orientation surrounding each image pixel location was also computed, and directional statistics were employed to compute the local directional variance of the fibers within a 50 pixel radius. Directional variance provided a metric that was inversely proportional to the strength of fiber alignment in a preferred direction. Subregions of 300×700 μm corresponding to the center of the PEF-treated tissue region were defined through blinded evaluation of the original Trichrome images, and the average fiber density and directional variance were computed from each sub-region.
2.10 Quantification of morphological markers
To quantify the effects of IRE and burns we quantified (Five for each treatment and each experimental point) the whole skin thickness, stratum coreum thickness, epidermis thickness, dermis thickness, fat layer thickness, and muscle layer thickness at least at 25 locations and 5 sections obtained from different animals sacrificed at the same time point. The number of viable hair follicles, sebaceous glands, and arrector pili muscles, viable nerves was counted per 2 mm of line parallel with the epidermis. Fibroblasts were counted in 5 fields of view (150X500 μm) on each section. The total number of mast cells, stained with Toloiden, was counted in 3 fields of view (20X magnification) per slide.
2.11 Immunohistochemistry of rat skin tissue
8 μm thick paraffin embedded tissue sections on glass slides were baked at 56°C for 30 minutes followed by deparaffinization in xylene and rehydration in graded alcohol into water. Antigen retrieval was performed by boiling the slides in 10mM Sodium Citrate buffer pH=6.0 for 30 minutes. Tissue sections (Five animals for each treatment and each experimental time point) were permeabilized with 0.1% Triton X-100. Endogenous peroxidase activity was quenched with 3% hydrogen peroxide in 60% methanol for 30 minutes. Biotin activity was blocked with Avidin-Biotin blocking reagent kit (Life Technologies, Grand Island, NY, 004303). Nonspecific proteins were blocked with 5% animal serum corresponding to the host species of the secondary antibodies. Tissue sections were incubated overnight with mouse monoclonal antibodies diluted in 5% horse serum that recognize the following proteins; p63 (Biocare, CM163A, 1:200), Nestin (AbCam #6142, Cambridge, MA, 1:200), and BMP-4 (Santa Cruz Biotechnology, Santa Cruz, CA, SC-393329, 1:100) followed by 60 minutes incubation with horse-anti mouse biotinylated secondary IgG diluted 1:300 (Vector laboratories). The following rabbit polyclonal antibodies were diluted in 5% goat serum and used to recognize the following proteins; Nephronectin (Abcam #64419, Cambridge, MA, 1:100), Laminin (Abcam #11575, Cambridge, MA, 1:200) followed by incubation with goat anti-rabbit peroxidase conjugated IgG (Cell Signaling #7074, 1:200). After washing, slides were incubated with biotinylated secondary IgG at 1:300 dilutions (Vector laboratories) for 60 minutes at room temperature followed by incubation with Avidin/Biotinylated enzyme complex reagent (ABC kit, Vector Laboratories PK6100) for 30 minutes. The following goat polyclonal antibodies were diluted in 5% horse serum and used to recognize FGF-5 (Santa Cruz Biotechnology, SC-1363, 1:100), or LEF-1 (Santa Cruz Biotechnology, SC-8591, 1:100). Finally, rabbit polyclonal antibodies were diluted in 5% goat serum were used to recognize Cytokeratin-17 (Santa Cruz Biotechnology, SC-101931, 1:100) or Collagen-IV (Abcam, 6586, 1:50). The relevant slides were incubated with either horse anti-goat, or goat anti-rabbit peroxidase conjugated secondary IgGs (Vector Laboratories, Burlingame, CA, 1:200) for 60 minutes at room temperature. Specific proteins were visualized by reacting the slides with 3,3′-Diaminobenzidine substrate in the presence of hydrogen peroxide in a reaction buffer (Vector Laboratories SK4100). Tissue sections were briefly counter stained with Gill-hematoxylin. Slides were briefly dehydrated and then mounted with Histomount solution (Life Technology, Grand Island, NY 008030). Color images of each entire tissue section were acquired using NanoZoomer Digital Pathology System (Nanozoomer 2.0-HT slide scanner, Hamamatsu, Hamamatsu City, Japan)
2.12 TUNEL Apoptosis assay
8 μm thick paraffin embedded tissue sections on glass slides were baked at 56°C for 30 minutes followed by deparaffinization in xylene and rehydration from graded alcohol into water. Antigen retrieval was performed by exposing the slides to microwave at 752W for 5min in 100mM Sodium Citrate buffer pH=3.0. Than the slides were washed in PBS for 15 min. Additional treatment in microwave at 752W for 5min in 100mM Sodium Citrate buffer pH=3.0 and rinse in PBS. Next, the slides were treated with Proteinase K (Sigma, IS, 20 microgram/ml) for 15 min at RT. The slides were blocked by incubation in 20% normal bovine serum for 30 minutes at RT. The slides were washed 3 times in PBS for 3 minutes. TUNEL assay reagents (Molecular Probes, CA) were prepared and the assay was used according to manufacturer protocol.
2.13 Transmission electron microscopy
Tissues were fixed in 2.0% glutaraldehyde in 0.1 M sodium cacodylate buffer, pH 7.4 (Electron Microscopy Sciences, Hatfield, PA) overnight at 4 C. They were rinsed in buffer, post-fixed in 1.0% osmium tetroxide in cacodylate buffer for one hour at room temperature, rinsed in buffer again and dehydrated through a graded series of ethanol to 100%, followed by 100% propylene oxide. They were then infiltrated with Epon resin (Ted Pella, Redding, CA) in a 1:1 solution of Epon:propylene oxide overnight at room temperature on a rocker. The following day they were placed in fresh Epon for several hours and then embedded in Epon overnight at 60 C. Thin sections (70–80 nm) were cut on a Leica EM UC7 ultramicrotome, collected onto formvar-coated grids, stained with uranyl acetate and lead citrate and examined in a JEOL JEM 1011 transmission electron microscope at 80 kV. Images were collected using an AMT digital imaging system (Advanced Microscopy Techniques, Danvers, MA).
2.14 Cytokines/chemokine/growth factor determination
Tissue was harvested at six hours, two and five weeks after injury (Three animals per injury and time point), immediately flash frozen in liquid nitrogen and kept at −80°C. In this study, only one type of injury was done for each animal, to avoid paracrine effects. The center of the IRE treated area was excised and proteins were extracted in CelLytic™ MT Cell Lysis Reagent, C3228 (Sigma, MO) mixed with Protease Inhibitor Cocktail P8340 (Sigma, MO) which was homogenized using Mini-Beadbeater-1 (Biospec, OK) with 5.5g/cc density zirconia beads (Biospec, OK). Tubes with the buffer and beads were shaken 4 times for 15 sec with 1min intervals, and then the tubes were kept on ice. Immediately after the extraction, total protein was quantified using 660nm Protein Assay reagent (Pierce, IL). All samples were then diluted to a single concentration; quantification of cytokines, chemokines and growth factors was performed using MILLIPLEX MAP Rat Cytokine/Chemokine Magnetic Bead Panel and TGF-beta 3-Plex Array (Eve Technologies, Calgary, AB, Canada). After quantification, the concentration of each factor was normalized to the total protein concentration of the same sample.
2.15 Statistical Analysis
Statistical analysis was performed with the statistics toolbox of MATLAB, R2009b (MathWorks, Natick, MA, USA). For all values besides cytokine analysis, data reported are means ± STD of the mean. Statistical analysis was performed by use of the unpaired, 1-tailed, t test if not stated otherwise. Significance was set at p < 0.05. In the cytokine analysis assays the correction for the p was made assuming 26 independent events and thus the significance in the expression differences was set for p<0.002; data reported are means ± STD.
3. Results and Discussion
To assess the effects of irreversible electroporation on the normal skin ablation and the subsequent regeneration process, we ablated an area of 1 cm2 of shaved dorsal skin of female Sprague Dawley rats with pulsed electric fields (Fig. 1a). Full thickness third degree thermal burns that typically lead to scar formation and prevent accessory organ regeneration were used to compare the outcome of IRE treatment. The following IRE treatment parameters were used to minimize the thermal effects of pulsed electric fields on tissue: applied voltage (E) 500 V, 2 mm gap between electrodes, pulse duration (tp) 70 μs, pulse delivery frequency (f) 3 Hz, total number of pulses (N) 1000, delivered in groups of 100 with 1 sec interval between groups. Notably, this IRE dose is an order of magnitude larger than the doses currently used for the ablation of solid tumors(Philips et al., 2013). The experimentally measured current (Fig. 1b) revealed a continuously increasing current with increasing pulse number indicating a successful membrane electroporation effect (Ivorra et al., 2009).
Figure 1. Irreversible electroporation procedure.
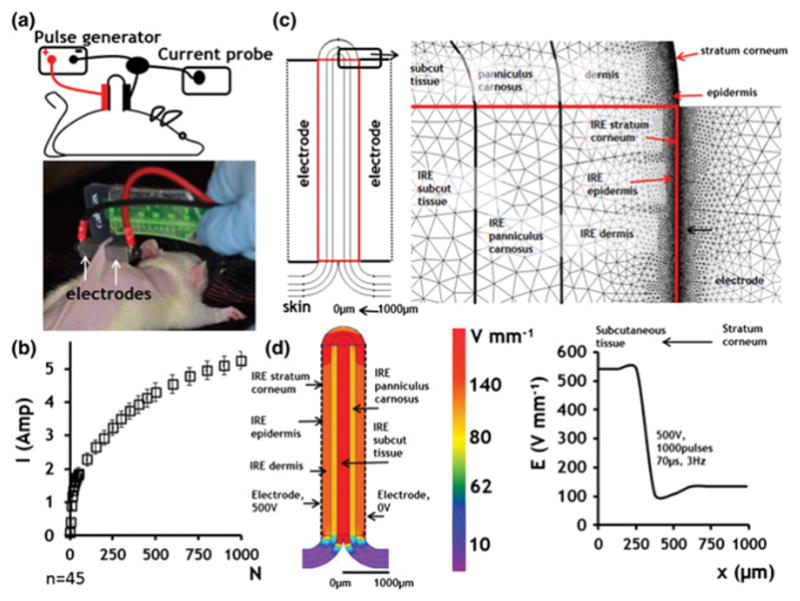
a. Electrode positioning. b. Current measured during pulse delivery) n=45). c. Geometry and mesh of the finite element numerical model of rat skin, with all major composing layers. The skin is divided into two regions: 1) CS and 2) IRES. IRES layers are tagged with IRE sign. d. Electric field distribution in different skin layers under various boundary conditions. The panel on the left shows the 2D map of electric field distribution. The plot of the right shows the numerical values of the electric field strength in different skin layers.
Depending on the strength of the local electric field, pulsed electric fields can lead to irreversible or reversible electroporation of the membrane, or can have no effect (Yarmush et al., 2014). Irreversible electroporation is achieved when the transmembrane potential exceeds a certain threshold value (Yarmush et al., 2014). To understand the effects of pulsed electric fields on cells in the skin it is necessary to estimate the electric field distribution throughout the complex tissue structure. This can be challenging, since the skin is a heterogeneous organ, composed of multiple compartments with distinct electric conductivities (Pavšelj and Miklavčič, 2008). To this end, we generated a Finite Element Model (FEM), modeling the skin as discrete layers (Fig. 1c). The numerical simulation reveals a reduction of the electric field strength in the layers of skin closest to the electrodes (stratum corneum, epidermis and dermis) (Fig. 1d). An additional drop occurs in the panniculus carnosus. The strongest electric field develops in the subcutaneous tissue layer which can be exposed to field strengths four-fold higher than the epidermis and dermis areas and five-fold higher than the panniculus carnosus.
To investigate the temporal evolution of cutaneous injury and regeneration of skin structure following IRE treatment in rats, we longitudinally imaged individual lesions at multiple time-points in vivo with polarization sensitive optical coherence tomography (PS-OCT) (Lo et al., 2016; Villiger et al., 2013). We have recently established the methodology for PS-OCT imaging of hypertrophic scars in a rat model (Lo et al., 2016). In addition to providing structural information, PS-OCT also measures the polarization properties of the sample. By analyzing how the polarization state of the scattered light changes as a function of depth, a measure of tissue birefringence can be obtained. Regularly arranged collagen fibers are the most prominent source of birefringence in tissue detected by PS-OCT. The collagen fiber thickness and density correlate with higher birefringence values. In contrast, if collagen fibers are present, albeit arranged irregularly on a size-scale smaller or comparable to the focal volume of OCT (10 × 15 μm), then the measured polarization states change randomly between adjacent pixels, which manifests as a reduction of the degree of polarization (DOP). This is the case for the intercalated arrangement of collagen fibers in normal skin, resulting in a rapid decrease of the DOP, and an irregular appearance of birefringence values. Together, these polarization parameters provide important cues on collagen organization, quantity, and morphology.
For histological assessment, we harvested samples immediately (T=0), or at 6 hours, 12 hours, 24 hours, 3 days, 1 week, 3 weeks, 8 weeks, or 24 weeks after the IRE and burn injuries. IRE-ablated skin (IRES) appeared blanched immediately after the injury. In the samples harvested immediately after the injury, histological observations showed marked thinning of the dermis and panniculus carnosus with evident diffused necrosis of the epidermis with marked parakeratosis (Fig. S1a). Superficial sebaceous glands also showed degenerative necrosis (Fig. S1a). Superficial vessels all showed compaction of red blood cells and focal pignosis of endothelial cells (Fig. S1a, insert, arrows). There were dilated lymphatics towards the deeper portion of the specimen and in the subcutanous tissue (Fig. S1a, yellow arrow). Mast cell degranulation was observed in the muscle and lower dermis muscle and subcutaneous fascia. (Fig. S1a, insert). Multiple skeletal muscle fibers showed scattered more centralized nuclear localization, unlike the normal peripheral localization (Fig. S1a, arrow). Six hours after ablation, epidermis in the IRES was completely necrotic with extensive ulceration without visible intraepidermal abscesses (Fig. S2). The hair follicles showed extensive destruction with marked pignosis of various layers. Subcutaneous fat and the dermis appeared collapsed. Panniculos carnosus muscle showed areas of complete loss of striation and fragmentation of fibers. The initiation of infiltration of neutrophils and leucocytes was observed. The dermal vessels in the upper half of the dermis showed compaction and red blood cell plugging (Fig. S2). The vessels in the lower dermis also showed compaction, but mostly had empty lumen with clear signs of degeneration of red blood cells. The nerves showed swollen Swan cells (Fig. S2, insert arrow).
Massive cell apoptosis in all skin layers was detected at 6, 12 and 24 hours after IRE (Fig. S3b,c,d). Twelve hours after ablation (Fig. 2a), multifocal areas of inflammatory cell infiltration of the necrotic epidermis as well as in the superficial papillary dermis was observed. We found subcorneal abscess formation in the papillary dermis associated with neutrophil accumulation. The epidermis and the superficial external root sheath of hair follicles were all necrotic. The papillary dermis and reticular dermis showed edema and all small venous were congested. Sever edema was also observed in the subcutaneous fat, nerves and the muscle, where the muscles appeared separated. The vessels showed thrombus formation with little neutrophil infiltration. The muscle fibers showed an intense infiltration of neutrophils and were associated with focal loss of striation. Twenty-four hours after ablation, epidermis showed complete necrosis (Fig. 2b). The hair follicles and sebaceous glands in the ablated areas were completely necrotic. There were multiple neutrophils scattered throughout the dermis. Many more vessels had denuded endothelium. By 12 hours, severe edema persisted in the dermis and in the muscle. Nerves looked swollen and degenerated in several locations with pyknotic nuclei of Schwan cells. Muscle fibers were fragmented, lost striation and were infiltrated with leukocytes (Fig. 2b).
Figure 2. Early events post IRE ablation of a normal rat skin.
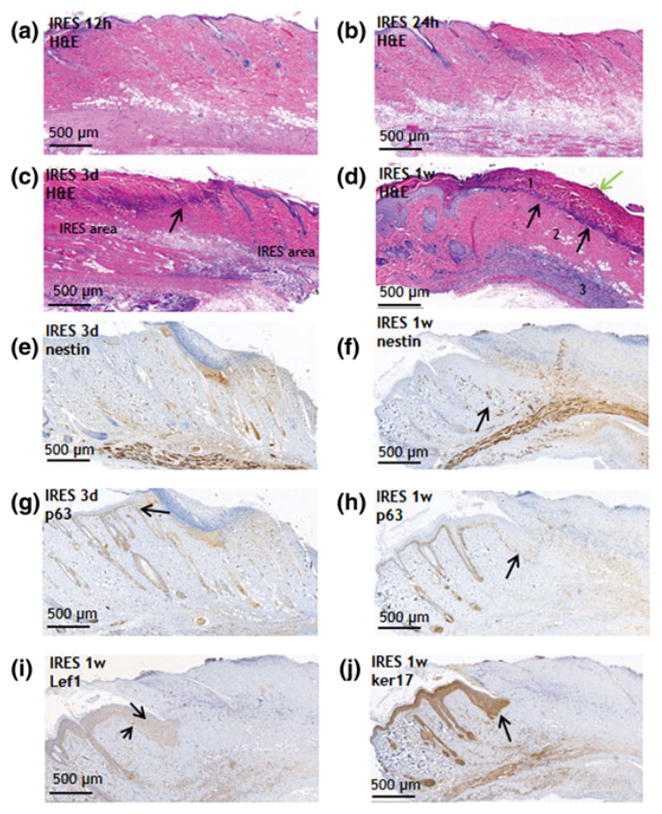
a. 12 hours post IRE (H&E stain), b. 24 hours post IRE (H&E stain), c. 3 days post IRE (H&E stain) arrow shows the neutrophils separation band; d. 1 week post IRE (H&E stain). Black arrow shows neutrophils separation band. Green arrow shows bacteria infection. Angiogenesis as detected with nestin at 3 days (e) and 1 weeks (f) after IRE. Activation and intrusion of the neighboring epidermis to the injured side. Invading cells express p63 (g, h), Lef-1 (i) and ker17 (j). Arrows show cell that overexpress the indicated proteins.
Three days after IRE, the ablated area was mostly necrotic (Fig. 2c) with rare apoptotic cells (Fig. S3e). The areas of irreversibly electroporated skin were very clearly demarcated in the dermis and epidermis from the less affected skin on either site (Fig. 2c). Its basic fibrillar architecture in the IRES was still present. In contrast, in the burned skin the architecture was completely lost immediately after injury. Most of the IRES was acellular. However, a band of neutrophils and lymphocytes started to form and separated affected dermis from less affected dermis (Fig. 2c, arrow). The subcutaneous fat was not vital, but necrotic in all treated samples. Leftovers of hair follicles, completely necrotic, were observed. The nerves showed edema and vascularization. Panniculus carnosus was necrotic. No significant angiogenesis at the periphery of the IRES area was detected 3 days after the ablation (Fig. 2e). Massive accumulation of epithelial cells, strongly expressing p63 was detected on the periphery of the ablated area at 3 days after IRE (Fig. 2g, arrow). At one week after the IRE, the ablation area was sharply demarcated (Fig. 2d, numbers indicated the zones). The most superficial zone was covered by stratum corneum and showed eosinophylic material composed of multiple fibrils including ghost-like remnants of epidermis. Focally, there were bands of bacteria that formed aggregates in the eosinophilic-like epidermis (Fig. 2d, green arrow). Scattered colonies of bacteria were present also in the eosinophilic dermal remnant. At the base of this superficial necrotic area there was a striking band resembling infiltrating neutrophils that completely separated the non-damaged, acellular dermis from the ghost-like infected dermis (Fig. 2d, black arrows).
The second band was the zone of retention of normal collagen architecture but with swollen fibers and prominent hypocellularity. Few scattered fibroblasts and neutrophils were also observed. This zone incorporates the small portion of subcutaneous fat and area of marked degradation of muscle fibers that show some areas of calcification of fibers outlining the striations. No nerves, hair follicles or sebaceous glands were observed in the altered areas.
The third zone was the deep fascia with prominent cellularity comprised with fibroblasts and mast cells with apparent regeneration of collagen fibers and numerous scattered mast cells. In the area of the muscle the altered muscle cells were associated with moderate lymphocyte and neutrophil infiltration. There were signs of mitosis of the muscle cells. Massive angiogenesis was detected in the border between the viable and the ablated skin (Fig. 2f arrow indicates the formation of new small blood vessels as detected with nesting staining(Matsuda et al., 2013). Epidermal growth was detected to be originating from the areas of viable skin localizing into the areas of ablated skin. The cells that originated from the area of the non-ablated skin were detected in the border zone of the growing epidermis they stained positive for p63, ker17 and Lef-1, (Fig. 2h,i,j).
Our findings suggest that the early events following IRE treatment indicate an ongoing cellular loss which partially start during the acute phase after treatment and may last for up to one week after ablation. Partial regeneration of certain skin layers, epidermis and panniculus carnosus, start as early as 3 days after ablation. Because of continuous infiltration of inflammatory cells to the IRE treated area, it is very difficult to assess cellular viability in the ablated area using markers of metabolic activity. The morphological assessment of sample obtained at 1, 3, 8, and 24 weeks after IRE, are summarized in Table 1.
Table 1. The morphological changes during skin remodeling.
Ratio to the control skin is shown. In bold, significant changes between the treated skin with control skin (p-val<0.05). Statistical analysis was first done with one-way ANOVA and then in Dunnett’s test for treated vs control skin at all time points. ±SD is shown
| Ratio to baseline | IRE_t0 | burn_t0 | IRE_1w | burn_1w | IRE_3w | burn_3w | IRE_2m | burn_2m | IRE_6m | burn_6m |
|---|---|---|---|---|---|---|---|---|---|---|
| Whole skin thickness (mm) | 0.73±0.06 | 0.99±0.09 | 0.93±0.09 | 0.79±0.08 | 0.96±0.09 | 1.35±0.18 | 1.14±0.11 | 1.27±0.13 | 1.02±0.11 | 1.03±0.10 |
| Stratum Corneum thickness (μm) | 1.05±0.17 | 0.00 | 0.51±0.09 | 0.00 | 1.99±0.33 | 2.18±0.42 | 1.28±0.27 | 1.70±0.25 | 1.53±0.35 | 2.23±0.43 |
| Epidermis thickness (μm) | 0.00 | 0.00 | 0.00 | 0.00 | 3.49±0.48 | 5.37±0.72 | 1.48±0.24 | 3.85±0.23 | 0.98±0.25 | 2.59±0.35 |
| Dermis thickness | 0.82±0.08 | 1.06±0.11 | 1.09±0.13 | 0.84±0.09 | 1.07±0.12 | 1.14±0.11 | 1.10±0.11 | 1.30±0.24 | 0.77±0.28 | 0.63±0.22 |
| Number of viable hair follicles (per 2mm) | 1.01±0.14 | 0.00 | 0.00 | 0.00 | 0.27±0.05 | 0.00 | 0.00 | 0.01±0.01 | 1.35±0.28 | 0.00 |
| Number of viable sebaceous glands (per 2mm) | 1.05±0.13 | 0.00 | 0.00 | 0.00 | 0.00 | 0.00 | 0.72±0.20 | 0.00 | 0.99±1.19 | 0.00 |
| Number of arrector pili (per 2mm) | 0.99±0.11 | 0.00 | 0.00 | 0.00 | 0.00 | 0.00 | 0.38±0.20 | 0.00 | 0.92±0.19 | 0.00 |
| Number of fibroblasts (150X500micron) | 1.03±0.09 | 0.69±0.09 | 0.53±0.09 | 0.43±0.09 | 4.68±0.52 | 8.27±0.75 | 1.36±0.30 | 4.97±1.15 | 0.92±0.13 | 2.43±0.22 |
| Number of mast cells (20X Toloiden blue) | 0.71±0.07 | 0.34±0.07 | 0.11±0.07 | 0.00 | 2.19±0.24 | 2.00±0.33 | 0.83±0.11 | 1.24±0.23 | 0.82±0.09 | 0.29±0.06 |
| Number of nerves | 0.92±0.12 | 0.00 | 0.77±0.17 | 0.00 | 0.90±0.15 | 1.03±0.16 | 0.77±0.14 | 0.51±0.14 | 1.83±0.34 | 1.15±0.19 |
| Fat layer thickness (μm) | 0.52±0.14 | 1.56±0.45 | 1.61±0.47 | 1.28±0.47 | 0.00 | 0.03±0.03 | 0.87±0.27 | 0.44±0.45 | 1.48±0.49 | 1.00±0.36 |
| Muscle layer thickness (μm) | 0.51±0.07 | 0.89±0.09 | 0.56±0.19 | 0.38±0.08 | 0.68±0.06 | 1.36±0.22 | 1.12±0.18 | 0.75±0.15 | 0.96±0.09 | 0.83±0.23 |
Preservation of the tissue architecture particularly sparing the ECM and large structures are major characteristics of of IRE ablation as compared with other ablation methods (Golberg et al., 2015a; Lee et al., 2010; Rubinsky et al., 2007; Rubinsky, 2007). However, very limited data are available on how this property affects scarless tissue regeneration (Golberg et al., 2016a; Phillips et al., 2010; Phillips et al., 2012). In this study, we compared the skin structure following IRE with the skin structure after third degree burn, which is known to destroy tissue architecture. In contrast to the burn injury, IRE did not change the extracellular matrix architecture as detected immediately after the ablation by both in vivo PS-OCT and histopathological analysis (Figs.3, S1, S4). Histological sections of samples harvested immediately after the injury showed a 27% thinning of the IRES sample in comparison with untreated control skin (CS); BS thickness was unchanged in comparison with CS (Table 1). The stratum corneum was preserved in the IRES (Figs. 3f, S1a), but was destroyed in the burned skin (BS) (Figs. 3k, S1c). The epidermis cells were necrotic in both IRES and BS (Fig. 3f,k, S1a,c). The dermal collagen showed a normal, reticular, intercalated structure of collagen fibers in the IRES, but not in the BS, where collagen bundles lost their clear outlines and inter-bundle spaces, and appeared congealed together, forming a ground substance (Fig. 3h vs m). The collagen fiber density and orientation were similar between IRES, BS, and CS (Fig. 3q, S6). In IRES, the elastin fibers appeared fragmented and clumped especially around the appendages (Figs.3i, S1b); however, their orientation was not different from the orientation of elastin fibers in the normal skin (Fig. 3d). In BS, the elastin fibers were clumped and fragmented in the lower part of the dermis, different from the normal elastin fibers that have a random orientation (CS) (Fig. 3n, S1d). Additional extracellular matrix proteins (laminin, collagen IV, and nephronectin) appeared intact in IRES, but scattered or not visible in BS (Figs. 3j,o, S4). Using PS-OCT, birefringence and DOP we showed that the IRES values were not different from CS immediately after injury, but were significantly different compared to BS (decreased by 72% and increased by 55% for birefringence and DOP, respectively), (Fig. 3g, l, p). This is consistent with previous reports where using PS-OCT(Park et al., 2001), found that in BS collagen is denatured and loses its birefringence, explaining both the reduction in birefringence and the increase in DOP.
Figure 3. Immediate effects of IRE and burn injuries on ECM.
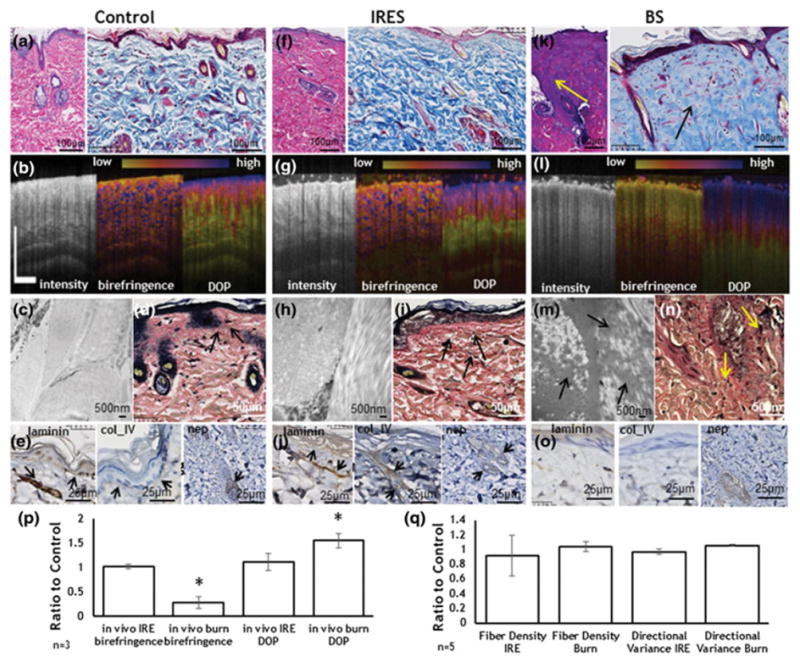
a. Normal skin pathology (H&E (left), Masson’s trichrome (right)). b. PS-OCT imaging of normal rat skin (Intensity (left), birefringence (center), DOP (right)). c. TEM image of dermis in normal skin. d. Verhoeff–Van Gieson stain for collagen in normal skin. Black arrows show normal elastin fibers. e. Immunohistological staining for ECM structural proteins in normal skin (laminin (left), collagen IV (center) and nephronectin (right)). No structural changes were observed in the skin immediately after IRE (f–j). f. IRE ablated skin pathology (same as a). g. PS-OCT imaging of IRE skin (same as b). h. TEM image of dermis in IRE ablated skin. i. Verhoeff–Van Gieson stain for collagen in IRE ablated skin. Black arrows show elastin fibers j. Immunohistological staining for ECM structural proteins in IRE ablated skin (same as e). Burn caused a significant alteration in the organization of the ECM fibers. k. Burn skin pathology (same as a). Arrows show an area of melted dermis. l. PS-OCT imaging of the burn skin (same as b). m. TEM image of dermis in burn skin. Arrows show the destroyed collagen fibers. n. Verhoeff–Van Gieson stain for collagen in burn skin. Arrows show destructed elastin fibers. o. Immunohistological staining for ECM structural proteins in IRE ablated skin (same as e). p. Birefringence and DOP, measured in vivo with PS-OCT, of IRE and burned skin in comparison to non-treated control skin. q. Changes in fiber density and orientation variance after the IRE and burn injury as detected by the computational analysis of the histological slides (Fig. S2). Star indicates significant difference to control skin (p<0.05). Five animals were used per group for histology (n=5). Three rats were used for the PS-OCT (n=3)
In contrast to burn injury that completely destroyed skin architecture, IRE preserved the skin microarchitecture and affected mostly the cell membranes. One week after injury, in striking contrast to BS, IRES still showed an almost completely preserved stratum corneum, preservation of a majority of the basement membrane and the intercalated structure of the collagen in most parts of the skin, (Figs. 2d, 6d,e, S5). The preservation of the ECM in IRES resulted in a strikingly different pattern of inflammarory cells migration and sequestration compared to BS as described above. BS did not show this type of demarcation and there was infiltration of neutrophils throughout the entire affected skin in both 24 hours and 1 week after the injury (Figs. 6c,e, S5e). The polarization properties measured with PS-OCT at one week revealed a gradual decrease of birefringence for IRES by −33% as compared to CS, and an increase of 25% for the DOP compared to CS (Fig. 6a, d, l, m). This finding indicates either a decreased integrity of the collagen fibers, or secretion of new uncrosslinked collagen, thereby reducing the birefringence and depolarizing power. PS-OCT at one week after BS revealed no significant change compared to the values immediately after injury, with a birefringence reduced by 57% and a DOP increased by 51% compared to NS (Fig. 2a, e, l, m). One week after injuries, the BS formed a extensive scab, which fell off about eleven days after the injury (Fig. 2e, Fig. S5e,f,g,h). In contrast, IRES did not form a significant scab, but instead displayed partial sloughing of the superficial layers of the skin ten to fourteen days after ablation.
Figure 6. Dynamics of skin wound healing after IRE and burn injury.
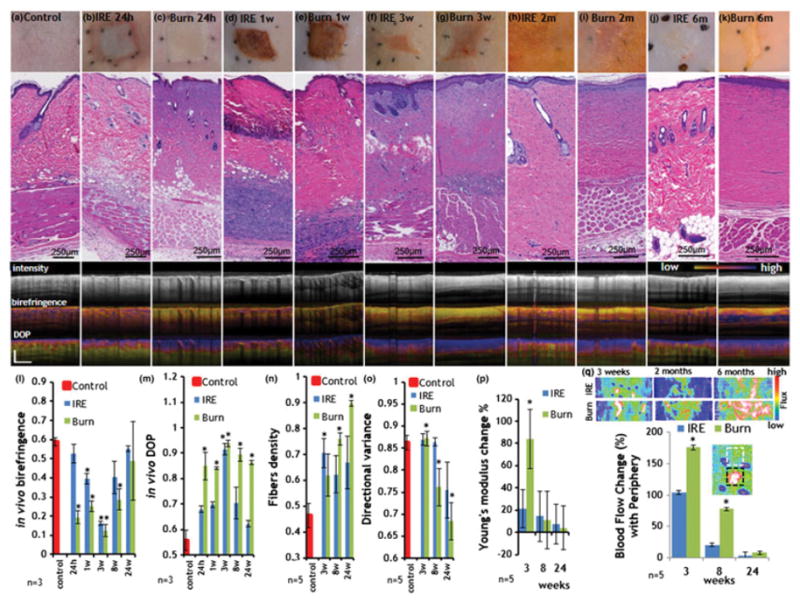
For images a–k three panels are shown. Top panel shows the digital photograph of the wound site at the indicated time point. Medium panel shows the H&E stain of that region. The bottom panel shows the in vivo PS-OCT images as follows: Top: intensity center: birefringence, bottom: DOP. a. Control, normal skin. b. IRE skin 24 hours after the injury. c. Burn skin 24 hours after the injury. d. IRE skin one week after the injury. e. Burn skin one week after the injury. f. IRE skin three weeks after the injury. g. Burn skin three weeks after the injury. h. IRE skin 2m after the injury. i. Burn skin 2m after the injury. j. IRE skin 6m weeks after the injury. k. Burn skin 6m after the injury. l. Birefringence as calculated from in vivo PS-OCT. m. DOP as calculated from the in vivo PS-OCT signal. n. Fiber density quantified from digitized histopathology slides. o. Directional variance of the fiber orientation as calculated from histopathology slides. p. Young’s modulus of the injured skin compared to control skin. q. Change in blood flow rate at the center of the wound in comparison with the flux at the periphery. Top panel shows the images as reconstructed from the Doppler imaging. The plot shows the ratio of the flow in the lesion center and the adjacent, not affected area. Insert shows an example of regions of interests from which the flux ratio was calculated. Star indicates significant difference to control skin (p<0.05). For control values in images l–o the average values from 10 animals were used. For experimental groups five animals were used. For PS-OCT the images three rats were imaged.
We further investigated the wound healing processes at up to six months following injury. Three weeks after injury, IRES exhibited multiple foci of normal collagen with normal fiber bundle architecture separated from other foci that appeared to be connected to one another by tracks of cells that were associated with 8-fold increase increase in fibroblasts (Fig. 4a,b,d). We also observed substantial deposition of newly formed uncrosslinked collagen (Fig. 4b) associated with the appearance of multiple small blood vessels in the area (Fig. 4c). Unlike BS injury, which did not show regeneration of skin appendages, three weeks after the injury the epidermis of IRES displayed some bulging of epidermal cells (Figs.4d arrow, S7,S8,S9), forming small plug-like areas associated with invaginations of small basoloid cells that form very discrete nests (Fig. 4a arrows). In other areas, there was a proliferation of basaloid cells spreading down from the epidermis forming structures that resembled hair papilla. In some fields, the basaloid proliferation was directly correlated with granularity of the epidermis similar to a follicular orifice (Fig. 4a). The forming follicles showed increased expression of folliculogenesis and hair growth regulation markers including laminin (Li et al., 2003a; Tamiolakis et al., 2001), collagen IV (Tamiolakis et al., 2001), nephronectin (Toyoshima et al., 2012), p63(Ehama et al., 2007), ker17(Ito et al., 2007), FGF-5(Hébert et al., 1994), Lef-1(Ito et al., 2007), BMP-4(Millar, 2002), and nestin (Li et al., 2003b) three weeks after the injury (Figs. 4, S7, S8, S9). These results show faster hair growth in IRES than the previous work of Ito et al. (2007) who observed “epidermal downgrowths that resembled developing embryonic hair follicles” 14–19 days after the excisional wound (Ito et al., 2007). This rapid regeneration process can be related to the preservation of ECM following IRES similar to what has been described in the excisional wound healing model.
Figure 4. Skin regeneration 3 weeks after IRE.
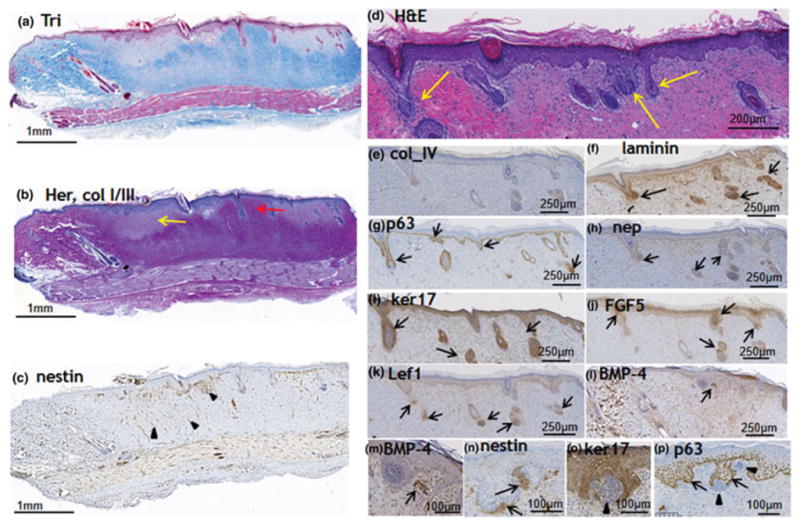
a. ECM structure (Masson’s trichrome stain), b. The area is rich with fresh type III collagen (blue in the shown Herovichi staining). Yellow arrow indicates the areas with new uncrosslinked collagen. Red arrow shows the formation of a new hair in the middle of the ablated zone. c. Angiogenesis, detected with nestin staining. Reduced formation of new vessels in comparison with 3 days and 1 weeks time points. Hair folliculogenesis at the IRE ablated site three weeks after the injury (d–p). d. Pathology of the site reveals the formation of new hair follicles at multiple locations inside the injured area (H&E staining). Arrows show the newly formed follicles. e. Increased expression of collagen IV in the basement membrane. f. Increased expression of laminin in the basement membrane. e. Increased expression of nephronectin in the basement membrane. g,p. Increased expression of p63 in the external part of the forming hair follicles, absence in the hair papilla (arrow heads). i,o. Increased expression of ker17 in the external part of the forming hair follicles, absence in the hair papilla (arrow heads). j. Increased expression of FGF-5 in the hair bulging area. k. Increased expression of Lef-1 in the hair papilla. l. Increased expression of BMP-4 in the hair papilla area. n. Increased expression of nestin in the hair papilla area. Combined, the expression of the markers displayed in d–p demonstrates the generation of new hair follicles at the ablated site. Five animals were used for this time point.
Two months after the injury, IRES showed remarkable remodeling of skin with its appendages, however, the epidermis was still significantly (p<0.05) thicker than the CS, indicating that the remodeling process was persistent (Fig. 5a–d). ES completely restored its visual appearance six months after the injury (Fig. 5e–h). The only difference between IRES and CS was the higher melanin level in IRES, giving the skin a tanner hue. Restoration of the polarization properties was observed in IRES by longitudinal in vivo imaging using PS-OCT (Fig. 5f, 6l,m). Despite the differences in the initial response to injury, we detected similar polarization properties in both IRES and BS evident by low birefringence, paired with a high DOP, characteristic of the small, freshly synthesized thin collagen fibers and macroscopically homogenous appearance (Fig. 6f,g,l,m,n,o). Subsequently, the maturing collagen fibers caused an increase in birefringence, observed in both IRES and BS (Fig. 6h–l). The dense alignment of the collagen fibers in the burn scars (Figs. 6n, S6) only marginally disturbed the polarization state of the probing light, achieving a high DOP throughout the entire six-month-period of this study (Fig. 5f, 6i,k,m,n,o). In contrast, the haphazard organization of the collagen and the appearance of skin appendages in the regenerating IRES resulted in a marked decrease of the DOP with time, achieving values comparable to CS six months after injury (Fig. 5f,g,h, 6h,j,m,n,o).
Figure 5. Late, remodeling phase, events in the IRES.
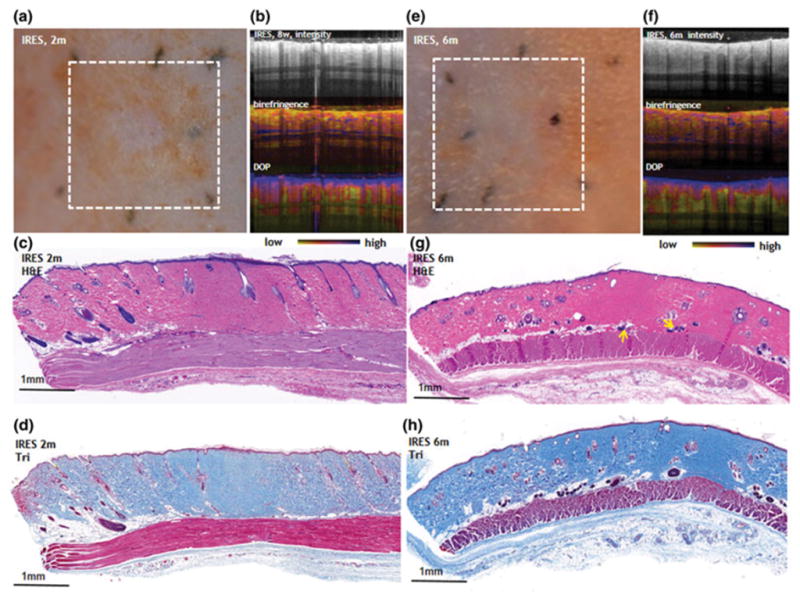
a. Digital image (2 months after IRE), b. PS-OCT 2 months after IRE, c. Histology 2 months after IRE (H&E stain), d. Histology 2 months after IRE (Masson’s trichrome stain). e. Digital image (6 months after IRE), f. PS-OCT 6 months after IRE, g. Histology 6 months after IRE (H&E stain), yellow arrows show regenerating hair follicles. h. Histology 6 months after IRE (Masson’s trichrome stain).
The total thickness of IRES injury was not different from the thickness of the normal, untreated skin starting from three weeks after the injury (p=0.3). The BS, however, showed a 35% increase in the skin thickness three weeks after the injury, and did not recovere to the normal thickness until six months after the initial burn (Table 1). Both IRES and BS showed a hyperkeratosis with a doubling of the stratum corneum three weeks after the injury, resolving at six months for IRES (p=0.09 with CS), but not resolving in the BS. A three-fold thickening of the epidermis in the IRES and five-fold thickening in the BS were observed three weeks after the injury, which result in a near doubling of Young’s modulus in the BS skin (Fig. 6p). Notably, the epidermal thickness of IRES was only two-fold larger than CS two months after the injury and completely restored to the original thickness at the six month time point (p=0.45); however, the BS epidermal thickness remained 2.5-fold thicker than CS even six months after the injury.
After two months of remodeling, the collagen in the IRES became thicker than in CS, the fibers were more dense, multifocal, and exhibited a pattern resembling normal reticular dermis (Fig. 5,6h,n,o), resulting in the gradual increase of birefringence and reduction of DOP as observed with PS-OCT (Fig. 5,6l.m). Six months after injury IRES exhibited many intercalated fibers with normal skin structure, however the interfascicular spaces were reduced in comparison with CS (Fig. 5, 6j,n,o). The number of fibroblasts was not different between IRES and CS (p=0.28) (Table 1). In contrast to IRES, BS showed an obvious scar without any intercalated collagen fibers six months after the injury (Fig. 6k,n,o, S1). The number of fibroblasts in BS was 2.5-fold higher than in CS even six months after the injury (Table 1).
Hair folliculogenesis resulted in the formation of mature hair, sebaceous glands, and arrector pili muscle two months after the injury with restoration of the original number of hairs and other skin appendages six months after the injury (Table 1, p=0.1). The hairs in IRES (two and six months after the injury), in contrast to CS, featured follicle complexes consisting of three to four individual hairs (Fig. S10). Interestingly, BS at two and six months likewise showed a few attempts of folliculogenesis, evident by a single bulging of the epidermis; this however, did not progress to the formation of the hair papilla, presumably due to the extensive collagen deposition in the underlying tissue, inhibiting the hair development.
In both IRES and BS, panniculus carnosus completely reformed two months after the injury (Table 1, Fig. 5, 6h,i). Six months after the injury, the muscle fibers, however, showed hypertrophy and a loss of intermuscular spaces (Fig. 5, 6j,k). The striation of the muscle fibers appeared normal with only some single cells still exhibiting loss of striation. Most of the nuclei were present in the site-center of the fibers. Vasculature in both IRES and BS showed a marked dilation in multiple vessels three weeks after the injury (Fig. 5, 6f,g,q). The vasculature in the dermis of IRES resembled that of CS six months after the injury (Fig. 5, 6j,q). In contrast, six months following the injury, the vasculature of BS exhibited larger vessels, oriented perpendicular to the axis of the epidermis (Fig. 6k,q).
In addition to histological evaluation and in vivo PS-OCT imaging, we compared the the protein levels of selected cytokine and growth factors which are known to mediate tissue degeneration and remodeling using multiplex technology. We analyzed skin protein extracts from samples obtained from rats subjected to IRES and BS at six hours, and at two, and five weeks after the injury (Table 2). We found that 6 hours after the injury, IRES showed higher expression of MCP-1 and TNF-α protein levels compared to BS (p<0.002). Two weeks after injury following scab sloughing off the skin, the IRES showed a significantly lower expression of MCP-1 and MIP-1α than BS (p<0.002), while both levels were higher than in CS. Importantly, previous studies in humans with alopecia areata have found increased expression levels of MCP-1, and proposed to prevent the overexpression of this chemokine for alopecia treatment (Benoit et al., 2003). Our study provides additional clues on the importance of MCP-1 in promoting skin appendage development as its increased level was associated with scar formation and absence of folliculogenesis at the late phase of BS skin remodeling in contrast to IRES injury (Tables 1 and 2). Previous animal studies have shown that the decreased levels of MIP-1α lead to less collagen synthesis in murine wounds (DiPietro et al., 1998). Our results show that BS expresses significantly higher levels of MIP-1α compared to IRES that regenerates without scars (Table 2). The levels of the MIP-1α in the IRES are still higher than its levels in the CS, and are associated with the normal wound healing process.
Table 2. The immunological response of rat skin tissue to burn and IRE injury.
Ratio to control, untreated skin is shown. Marked in red/green are cytokine expression levels which are significantly higher/lower (p<0.002) in one group as compared to the other group at the matching time point (marked in green). ±SD is shown
| IRE_6h | I1RE_2w | IRE_5w | burn_6h | burn_2w | burn_5w | |
|---|---|---|---|---|---|---|
| G-CSF (13) | 1.38±0.66 | 1.40±0.78 | 1.07±0.58 | 0.31±0.28 | 1.51±0.76 | 1.36±0.70 |
| Eotaxin (14) | 1.00±0.31 | 1.15±0.33 | 1.28±0.57 | 0.72±0.21 | 1.22±0.33 | 0.80±0.30 |
| IL-1a (19) | 0.27±0.25 | 0.98±0.82 | 1.61±1.27 | 0.08±0. 08 | 0.64±0.49 | 1.19±0.98 |
| Leptin (22) | 1.31±0.83 | 0.65±0.47 | 1.54±1.06 | 1.02±0.90 | 0.90±0.55 | 0.64±0.40 |
| MIP-1a (33) | 11.35±6.94 | 19.10±9.29 | 1.38±0.32 | 1.97±0.51 | 127.73±12.74 | 6.28±6.14 |
| IL-4 (34) | 1.48±0.48 | 1.76±0.56 | 1.97±0.90 | 1.20±0.49 | 2.74±0.71 | 1.26±0.42 |
| IL-1b (35) | 7.99±5.86 | 4.03±2.10 | 2.70±1.39 | 2.59±1.12 | 14.27±4.50 | 1.82±0.76 |
| IL-2 (36) | 1.12±0.47 | 1.45±0.62 | 1.16±0.54 | 0.40±0.41 | 1.33±0.53 | 0.74±0.45 |
| IL-6 (37) | 10.80±7.35 | 1.62±1.03 | 0.78±0.29 | 2.58±1.87 | 3.71±0.86 | 0.58±0.24 |
| EGF (38) | 3.22±2.97 | 0.49±0.28 | 0.84±0.46 | 1.31±0.98 | 4.18±1.98 | 1.25±1.28 |
| IL-13 (39) | 0.63±0.28 | 1.15±0.52 | 1.23±0.65 | 0.41±0.29 | 1.35±0.44 | 0.41±0.59 |
| IL-10 (51) | 2.14±0.25 | 2.55±0.79 | 1.19±0.39 | 0.96±0.43 | 3.68±0.35 | 0.96±0.17 |
| IL-12p70 (52) | 1.03±0.77 | 1.51±0.91 | 1.40±0.93 | 0.85±0.68 | 2.21±1.30 | 1.01±0.65 |
| IFNy (53) | 1.23±0.12 | 1.32±0.12 | 1.37±0.23 | 0.80±0.19 | 1.39±0.11 | 0.99±0.27 |
| IL-18 (57) | 0.38±0.35 | 2.25±1.59 | 1.58±1.20 | 0.08±0.06 | 3.06±2.16 | 1.09±0.80 |
| MCP-1 (62) | 7.08±3.92 | 2.29±1.27 | 1.78±1.12 | 1.14±0.77 | 6.21±3.39 | 1.50±1.10 |
| IP-10 (65) | 2.35±1.16 | 31.85±18.22 | 2.82±2.26 | 1.40±0.88 | 21.45±10.02 | 10.43±9.35 |
| VEGF (73) | 1.79±1.26 | 3.07±1.99 | 1.19±0.93 | 1.23±0.87 | 10.61±6.85 | 0.88±0.57 |
| Fractalkine (74) | 0.78±0.55 | 0.90±0.24 | 1.25±0.36 | 0.31±0.08 | 0.79±0.17 | 0.67±0.19 |
| LIX (75) | 3.41±1.92 | 1.90±0.80 | 0.94±0.40 | 1.19±0.58 | 16.35±5.41 | 1.09±0.59 |
| MIP-2 (76) | 28.29±23.56 | 77.33±31.18 | 1.24±0.76 | 3.33±0.68 | 449.37±5.11 | 1.65±0.88 |
| TNFa (77) | 1.36±0.46 | 3.10±1.16 | 1.54±0.95 | 0.64±0.22 | 18.31±6.01 | 1.76±0.96 |
| RANTES (78) | 0.89±0.82 | 8.75±7.74 | 2.71±2.51 | 0.84±0.84 | 3.79±3.22 | 5.71±5.23 |
| TGF-B1 (18) | 2.07±1.09 | 2.39±0.83 | 0.99±0.38 | 3.11±1.37 | 3.04±1.05 | 1.36±0.65 |
| TGF-B2 (54) | 0.62±0.30 | 2.58±1.14 | 1.27±0.47 | 0.77±0.21 | 2.62±0.63 | 1.40±0.86 |
| TGF-B3 (36) | 0.50±0.17 | 3.17±0.85 | 1.02±0.38 | 0.70±0.12 | 2.14±0.34 | 1.38±0.98 |
The hypothesis that preserved ECM enhances tissue healing was described decades ago (Yannas et al., 1989), and there are many studies suggesting that introducing ECM based scaffolds can improve healing and result in better regeneration results (Berthiaume et al., 2011). However, none of these studies could provide an in vivo evidence of the importance of naïve ECM organization. Many investigators over the last decade showed that fetal wounds demonstrate scarless healing (Coolen et al., 2010); however, fetal wounds are different from the adult tissues in their chemical composition, lack of inflammatory response and ECM structure. To study tissue regeneration in vivo, several animal models have been used including amphibians (Song et al., 2011), rabbits (Ramos et al., 2008), pigs (Ramos et al., 2008) and mice (Ito et al., 2007). De novo skin appendages regeneration in the wound area has been reported during the last 60 years in mice (Ito et al., 2007), rats (Mikhail, 1963), rabbits (Billingham and Russell, 1956; Breedis, 1954) and humans (Beachkofsky et al., 2011; Kligman and Strauss, 1956). Even though, the importance of the 3D environment in the restoration of dermal papilla inductivity has been recently demonstrated (Higgins et al., 2013), none of the existing in vivo models could explore the effects of the natural ECM on scar formation and skin appendage regeneration due to the lack of in vivo decellularization methods. The IRE injury model used in this study provides a viable in vivo tool to study the tissue regeneration following cellular ablation in the setting for preserved ECM. This model provides an opportunity to study the effect of naïve structure on wound healing. The major limitation of this study was the chosen animal species since the rodent skin structure and wound healing is different from that of human skin. Yet, the ability to eliminate the cells in the area without damaging ECM structure is important for basic research projects aimed at studying skin cellular development, structure formation, scarring and interactions of stem cells with their niches, and have traditionally been performed in rodent models (Hsu et al., 2014; Seifert et al., 2012).
Our study provides detailed information on the dynamics of wound healing after IRE. These dynamics are important for treatment monitoring.. Our findings provide a new direction for research on wound healing and tissue scarless regeneration, using pulsed electric fields as a method to achieve decellularization (Sano et al., 2010). Such in vivo decellularization could be used for basic studies on cell migration patterns and differentiation at various skin compartments, information useful for skin development, wound healing and cancer research. Furthermore, this could help in elucidating the mechanisms of skin regeneration by providing an acellular injury micro environment. In addition, this acellular environment could be used in the future for cell transplantations studies and therapies, providing new treatments for skin abnormalities for patients. In addition, our data suggests that the preservation of the architecture of the ECM in IRE-ablated skin and the reduction in levels of MCP-1 and MIP-1α, as compared to burns, promote scarless healing and the formation of hair follicles, sebaceous glands, panniculus carnosus, and arrector pili muscle. In contrast, the damage caused by burn injury provokes increased fibrosis and ultimately leads to the formation of a scar. In addition to the mechanistic insight of the role played by the ECM in tissue regeneration, it would be necessary to unravel the molecular signaling enabled by the preservation of the ECM. Future work will address how the orientation and structure of the ECM is guiding attachment patterns of signaling molecules, cell migration, differentiation, and morphogenesis. Additional studies to elucidate the role of immune cells infiltration in the regenerating IRES in comparison to the infiltration in the non regenerating BS, and study the source of cells that contribute to appendages formation are warranted. We believe that our model of scarless healing in mammals using IRE ablation will contribute a missing key-element for the regeneration of entire organs and the study of morphogenesis. This model can be used in further studies in combination with specific cell type depletion to understand the role of specific cells in the regeneration of skin. Furthermore, it can be used with cell transplantation or cell lineages tracking studies (Driskell et al., 2013) to understand the sources of appendage regeneration. Finally, pulsed electric field ablation may provide a new method to study and modulate the stem cell niche (Lane et al., 2014), a critical element in tissue regeneration.
Supplementary Material
Acknowledgments
We acknowledge Shriners Grant #85120-BOS and Binational USA-Israel Science Foundation (BSF) for the support of this study BSF Grant # 2015286. Research in this publication was also supported in part by the Department of Defense, Air Force Office of Scientific Research under agreement number FA9550-13-1-0068, and the National Institute of Biomedical Imaging and Bioengineering of the National Institutes of Health, award P41 EB015903. Electron microscopy was performed in the Microscopy Core of the Center for Systems Biology/Program in Membrane Biology, which is partially supported by an Inflammatory Bowel Disease Grant DK43351 and a Boston Area Diabetes and Endocrinology Research Center (BADERC) Award DK57521. We thank Dana-Farber/Harvard Cancer Center in Boston, MA, for the use of the Rodent Histopathology Core, which provided histopathology service. Dana-Farber/Harvard Cancer Center is supported in part by NCI Cancer Center Support Grant # NIH 5 P30 CA06516.
Footnotes
Competing financial interests
The authors declare no competing financial interests.
Author contribution statement
AG, MB, MCM, MY conceived study, AG, MV, FB, KQ, HA, SK did the experiments, AG, MV, MW, IG, WA,MB, BB, MCM, MY analyzed the data, AG, MV, HA MCM, MY wrote the paper.
References
- Aarabi S, Bhatt KA, Shi Y, Paterno J, Chang EI, Loh SA, Holmes JW, Longaker MT, Yee H, Gurtner GC. Mechanical load initiates hypertrophic scar formation through decreased cellular apoptosis. FASEB J. 2007;21:3250–3261. doi: 10.1096/fj.07-8218com. [DOI] [PubMed] [Google Scholar]
- Beachkofsky TM, Henning JS, Hivnor CM. Induction of de novo hair regeneration in scars after fractionated carbon dioxide laser therapy in three patients. Dermatol Surg. 2011;37:1365–8. doi: 10.1111/j.1524-4725.2011.01934.x. http://www.ncbi.nlm.nih.gov/pubmed/21492302. [DOI] [PubMed] [Google Scholar]
- Benoit S, Toksoy A, Goebeler M, Gillitzer R. Selective expression of chemokine monokine induced by interferon-gamma in alopecia areata. J Invest Dermatol. 2003;121:933–5. doi: 10.1046/j.1523-1747.2003.12524.x. http://dx.doi.org/10.1046/j.1523-1747.2003.12524.x. [DOI] [PubMed] [Google Scholar]
- Berthiaume F, Maguire TJ, Yarmush ML. Tissue engineering and regenerative medicine: history, progress, and challenges. Annu Rev Chem Biomol Eng. 2011;2:403–30. doi: 10.1146/annurev-chembioeng-061010-114257. http://www.annualreviews.org/doi/abs/10.1146/annurev-chembioeng-061010-114257. [DOI] [PubMed] [Google Scholar]
- Billingham R, Russell P. Incomplete wound contracture and the phenomenon of hair neogenesis in rabbits’ skin. Nature. 1956;177:791–2. doi: 10.1038/177791b0. http://www.ncbi.nlm.nih.gov/pubmed/13321965. [DOI] [PubMed] [Google Scholar]
- Breedis C. Regeneration of hair follicles and sebaceous glands from the epithelium of scars in the rabbit. Cancer Res. 1954;14:575–9. http://www.ncbi.nlm.nih.gov/pubmed/13199800. [PubMed] [Google Scholar]
- Chunlan J, Davalos RV, Bischof JC. A Review of Basic to Clinical Studies of Irreversible Electroporation Therapy. Biomed Eng IEEE Trans. 2015;62:4–20. doi: 10.1109/TBME.2014.2367543. [DOI] [PubMed] [Google Scholar]
- Coolen Na, Schouten KCWM, Boekema BKHL, Middelkoop E, Ulrich MMW. Wound healing in a fetal, adult, and scar tissue model: a comparative study. Wound Repair Regen. 2010;18:291–301. doi: 10.1111/j.1524-475X.2010.00585.x. [DOI] [PubMed] [Google Scholar]
- Crowley JM. Electrical breakdown of bimolecular lipid membranes as an electromechanical instability. Biophys J. 1973;13:711–724. doi: 10.1016/S0006-3495(73)86017-5. [DOI] [PMC free article] [PubMed] [Google Scholar]
- Cruzeiro-Hansson L, Mouritsen OG. Passive ion permeability of lipid membranes modelled via lipid-domain interfacial area. BBA - Biomembr. 1988;944:63–72. doi: 10.1016/0005-2736(88)90316-1. [DOI] [PubMed] [Google Scholar]
- Deodhar A, Dickfeld T, Single GW, Hamilton WC, Thornton RH, Sofocleous CT, Maybody M, Gónen M, Rubinsky B, Solomon SB. Irreversible electroporation near the heart: Ventricular arrhythmias can be prevented with ECG synchronization. Am J Roentgenol. 2011;196 doi: 10.2214/AJR.10.4490. [DOI] [PMC free article] [PubMed] [Google Scholar]
- DiPietro LA, Burdick M, Low QE, Kunkel SL, Strieter RM. MIP-1alpha as a critical macrophage chemoattractant in murine wound repair. J Clin Invest. 1998;101:1693–8. doi: 10.1172/JCI1020. http://www.pubmedcentral.nih.gov/articlerender.fcgi?artid=508751&tool=pmcentrez&rendertype=abstract. [DOI] [PMC free article] [PubMed] [Google Scholar]
- DiPietro LA. Angiogenesis and scar formation in healing wounds. Curr Opin Rheumatol. 2012 doi: 10.1097/BOR.0b013e32835b13b6. [DOI] [PubMed] [Google Scholar]
- Driskell RR, Lichtenberger BM, Hoste E, Kretzschmar K, Simons BD, Charalambous M, Ferron SR, Herault Y, Pavlovic G, Ferguson-Smith AC, Watt FM. Distinct fibroblast lineages determine dermal architecture in skin development and repair. Nature. 2013;504:277–81. doi: 10.1038/nature12783. http://www.nature.com/nature/journal/v504/n7479/full/nature12783.html?WT.ec_id=NATURE-20131212. [DOI] [PMC free article] [PubMed] [Google Scholar]
- Duffield JS, Lupher M, Thannickal VJ, Wynn TA. Host Responses in Tissue Repair and Fibrosis. Annu Rev Pathol Mech Dis. 2012 doi: 10.1146/annurev-pathol-020712-163930. [DOI] [PMC free article] [PubMed] [Google Scholar]
- Ehama R, Ishimatsu-Tsuji Y, Iriyama S, Ideta R, Soma T, Yano K, Kawasaki C, Suzuki S, Shirakata Y, Hashimoto K, Kishimoto J. Hair follicle regeneration using grafted rodent and human cells. J Invest Dermatol. 2007;127:2106–15. doi: 10.1038/sj.jid.5700823. http://dx.doi.org/10.1038/sj.jid.5700823. [DOI] [PubMed] [Google Scholar]
- Eto H, Suga H, Aoi N, Kato H, Doi K, Kuno S, Tabata Y, Yoshimura K. Therapeutic potential of fibroblast growth factor-2 for hypertrophic scars: upregulation of MMP-1 and HGF expression. Lab Invest. 2012;92:214–23. doi: 10.1038/labinvest.2011.127. http://dx.doi.org/10.1038/labinvest.2011.127. [DOI] [PubMed] [Google Scholar]
- Gibran N. The genetics and epigenetics of extreme healing: hypertrophic scars and diabetic ulcers (337.4) FASEB J. 2014;28:337.4. http://www.fasebj.org/content/28/1_Supplement/337.4. [Google Scholar]
- Golberg A, Bruinsma BG, Jaramillo M, Yarmush M, Uygun BE. Rat liver regeneration following ablation with irreversible electroporation. PeerJ. 2016a doi: 10.7717/peerj.1571. [DOI] [PMC free article] [PubMed] [Google Scholar]
- Golberg A, Bruinsma BG, Uygun BE, Yarmush ML. Tissue heterogeneity in structure and conductivity contribute to cell survival during irreversible electroporation ablation by “electric field sinks”. Sci Rep. 2015a;5:8485. doi: 10.1038/srep08485. http://www.nature.com/srep/2015/150216/srep08485/full/srep08485.html. [DOI] [PMC free article] [PubMed] [Google Scholar]
- Golberg A, Khan S, Belov V, Quinn KP, Albadawi H, Felix Broelsch G, Watkins MT, Georgakoudi I, Papisov M, Mihm MC, Austen WG, Yarmush ML. Skin rejuvenation with non-invasive pulsed electric fields. Sci Rep. 2015b;5:10187. doi: 10.1038/srep10187. http://www.nature.com/srep/2015/150512/srep10187/full/srep10187.html. [DOI] [PMC free article] [PubMed] [Google Scholar]
- Golberg A, Villiger M, Khan S, Quinn KP, Lo W, Bouma BE, Mihm Martin C, Jr, Austen WGJ, Yarmush ML. Preventing Scars after Injury with Partial Irreversible Electroporation. J Invest Dermatol. 2016b doi: 10.1016/j.jid.2016.06.620. [DOI] [PMC free article] [PubMed] [Google Scholar]
- Golberg A, Yarmush ML. Nonthermal irreversible electroporation: Fundamentals, applications, and challenges. IEEE Trans Biomed Eng. 2013 doi: 10.1109/TBME.2013.2238672. [DOI] [PubMed] [Google Scholar]
- Hasgall PA, Neufeld E, Gosselin M, Klingenböck A, Kuster N. IT’IS Database for thermal and electromagnetic parameters of biological tissues, Version 2.5. 2014 Aug 1; www.itis.ethz.ch/database.
- Hébert JM, Rosenquist T, Götz J, Martin GR. FGF5 as a regulator of the hair growth cycle: evidence from targeted and spontaneous mutations. Cell. 1994;78:1017–25. doi: 10.1016/0092-8674(94)90276-3. http://www.ncbi.nlm.nih.gov/pubmed/7923352. [DOI] [PubMed] [Google Scholar]
- Higgins CA, Chen JC, Cerise JE, Jahoda CAB, Christiano AM. Microenvironmental reprogramming by three-dimensional culture enables dermal papilla cells to induce de novo human hair-follicle growth. Proc Natl Acad Sci U S A. 2013;110:19679–88. doi: 10.1073/pnas.1309970110. http://www.pnas.org/content/110/49/19679.abstract. [DOI] [PMC free article] [PubMed] [Google Scholar]
- Hsu Y-C, Li L, Fuchs E. Emerging interactions between skin stem cells and their niches. Nat Med. 2014;20:847–56. doi: 10.1038/nm.3643. [DOI] [PMC free article] [PubMed] [Google Scholar]
- Ito M, Yang Z, Andl T, Cui C, Kim N, Millar SE, Cotsarelis G. Wnt-dependent de novo hair follicle regeneration in adult mouse skin after wounding. Nature. 2007;447:316–320. doi: 10.1038/nature05766. [DOI] [PubMed] [Google Scholar]
- Ivorra A, Al-Sakere B, Rubinsky B, Mir LM. In vivo electrical conductivity measurements during and after tumor electroporation: conductivity changes reflect the treatment outcome. Phys Med Biol. 2009;54:5949–5963. doi: 10.1088/0031-9155/54/19/019. [DOI] [PubMed] [Google Scholar]
- Kligman A, Strauss J. The formation of vellus hair follicles from human adult epidermis. J Invest Dermatol. 1956;27:19–23. doi: 10.1038/jid.1956.71. http://www.ncbi.nlm.nih.gov/pubmed/13357817. [DOI] [PubMed] [Google Scholar]
- Koh TJ, DiPietro LA. Inflammation and wound healing: the role of the macrophage. Expert Rev Mol Med. 2011;13:e23. doi: 10.1017/S1462399411001943. [DOI] [PMC free article] [PubMed] [Google Scholar]
- Kotnik T, Kramar P, Pucihar G, Miklavčič D, Tarek M. Cell membrane electroporation - Part 1: The phenomenon. IEEE Electr Insul Mag. 2012;28:14–23. [Google Scholar]
- Lane SW, Williams DA, Watt FM. Modulating the stem cell niche for tissue regeneration. Nat Biotechnol. 2014;32:795–803. doi: 10.1038/nbt.2978. http://dx.doi.org/10.1038/nbt.2978. [DOI] [PMC free article] [PubMed] [Google Scholar]
- Lee EW, Thai S, Kee ST. Irreversible electroporation: A novel image-guided cancer therapy. Gut Liver. 2010 doi: 10.5009/gnl.2010.4.S1.S99. [DOI] [PMC free article] [PubMed] [Google Scholar]
- Li J, Tzu J, Chen Y, Zhang Y-P, Nguyen NT, Gao J, Bradley M, Keene DR, Oro AE, Miner JH, Marinkovich MP. Laminin-10 is crucial for hair morphogenesis. EMBO J. 2003a;22:2400–10. doi: 10.1093/emboj/cdg239. http://www.pubmedcentral.nih.gov/articlerender.fcgi?artid=155997&tool=pmcentrez&rendertype=abstract. [DOI] [PMC free article] [PubMed] [Google Scholar]
- Li L, Mignone J, Yang M, Matic M, Penman S, Enikolopov G, Hoffman RM. Nestin expression in hair follicle sheath progenitor cells. Proc Natl Acad Sci U S A. 2003b;100:9958–61. doi: 10.1073/pnas.1733025100. http://www.pubmedcentral.nih.gov/articlerender.fcgi?artid=187900&tool=pmcentrez&rendertype=abstract. [DOI] [PMC free article] [PubMed] [Google Scholar]
- Lo WCY, Villiger M, Golberg A, Broelsch GF, Khan S, Lian CG, Austen WG, Yarmush M, Bouma BE. Longitudinal, 3D In Vivo Imaging of Collagen Remodeling in Murine Hypertrophic Scars using Polarization-sensitive Optical Frequency Domain Imaging. J Invest Dermatol. 2016;136:84–92. doi: 10.1038/JID.2015.399. http://www.ncbi.nlm.nih.gov/pubmed/26447821. [DOI] [PMC free article] [PubMed] [Google Scholar]
- Matsuda Y, Hagio M, Ishiwata T. Nestin: A novel angiogenesis marker and possible target for tumor angiogenesis. World J Gastroenterol. 2013 doi: 10.3748/wjg.v19.i1.42. [DOI] [PMC free article] [PubMed] [Google Scholar]
- Michael D, O’Neill M. Electrohydrodynamic instability in plane layers of fluid. J Fluid Mech. 1970;41:571–80. [Google Scholar]
- Mikhail GR. Hair Neogenesis in Rat Skin. Arch Dermatol. 1963;88:713. doi: 10.1001/archderm.1963.01590240037008. http://archderm.jamanetwork.com/article.aspx?articleid=528310. [DOI] [PubMed] [Google Scholar]
- Millar SE. Molecular mechanisms regulating hair follicle development. J Invest Dermatol. 2002;118:216–225. doi: 10.1046/j.0022-202x.2001.01670.x. [DOI] [PubMed] [Google Scholar]
- Narayanan G. Irreversible electroporation for treatment of liver cancer. Gastroenterol Hepatol (N Y) 2011;7:313–6. http://www.pubmedcentral.nih.gov/articlerender.fcgi?artid=3127037&tool=pmcentrez&rendertype=abstract. [PMC free article] [PubMed] [Google Scholar]
- Park BH, Saxer C, Srinivas SM, Nelson JS, de Boer JF. In vivo burn depth determination by high-speed fiber-based polarization sensitive optical coherence tomography. J Biomed Opt. 2001;6:474–479. doi: 10.1117/1.1413208. [DOI] [PubMed] [Google Scholar]
- Pavšelj N, Miklavčič D. A numerical model of permeabilized skin with local transport regions. IEEE Trans Biomed Eng. 2008;55:1927–1930. doi: 10.1109/TBME.2008.919730. [DOI] [PubMed] [Google Scholar]
- Philips P, Hays D, Martin RCG. Irreversible Electroporation Ablation (IRE) of Unresectable Soft Tissue Tumors: Learning Curve Evaluation in the First 150 Patients Treated. Zhang Zhuoli., editor. PLoS One. 2013;8:e76260. doi: 10.1371/journal.pone.0076260. http://journals.plos.org/plosone/article?id=10.1371/journal.pone.0076260. [DOI] [PMC free article] [PubMed]
- Phillips Ma, Narayan R, Padath T, Rubinsky B. Irreversible electroporation on the small intestine. Br J Cancer. 2012;106:490–5. doi: 10.1038/bjc.2011.582. [DOI] [PMC free article] [PubMed] [Google Scholar]
- Phillips M, Maor E, Rubinsky B. Nonthermal irreversible electroporation for tissue decellularization. J Biomech Eng. 2010;132:091003. doi: 10.1115/1.4001882. http://biomechanical.asmedigitalcollection.asme.org/article.aspx?articleID=1426746. [DOI] [PubMed] [Google Scholar]
- Place ES, Evans ND, Stevens MM. Complexity in biomaterials for tissue engineering. Nat Mater. 2009;8:457–470. doi: 10.1038/nmat2441. [DOI] [PubMed] [Google Scholar]
- Quinn KP, Golberg A, Broelsch GF, Khan S, Villiger M, Bouma B, Austen WG, Sheridan RL, Mihm MC, Yarmush ML, Georgakoudi I. An automated image processing method to quantify collagen fibre organization within cutaneous scar tissue. Exp Dermatol. 2015;24:78–80. doi: 10.1111/exd.12553. http://www.ncbi.nlm.nih.gov/pubmed/25256009. [DOI] [PMC free article] [PubMed] [Google Scholar]
- Ramos MLC, Gragnani A, Ferreira LM. Is there an ideal animal model to study hypertrophic scarring? J Burn Care Res. 2008;29:363–8. doi: 10.1097/BCR.0b013e3181667557. http://www.ncbi.nlm.nih.gov/pubmed/18354295. [DOI] [PubMed] [Google Scholar]
- Robson MC. Proliferative scarring. Surg Clin North Am. 2003 doi: 10.1016/S0039-6109(02)00197-4. [DOI] [PubMed] [Google Scholar]
- Rubinsky B. Irreversible electroporation in medicine. Technol Cancer Res Treat. 2007;6:255–260. doi: 10.1177/153303460700600401. [DOI] [PubMed] [Google Scholar]
- Rubinsky B, Onik G, Mikus P. Irreversible electroporation: a new ablation modality--clinical implications. Technol Cancer Res Treat. 2007;6:37–48. doi: 10.1177/153303460700600106. [DOI] [PubMed] [Google Scholar]
- Russell SB, Russell JD, Trupin KM, Gayden AE, Opalenik SR, Nanney LB, Broquist AH, Raju L, Williams SM. Epigenetically altered wound healing in keloid fibroblasts. J Invest Dermatol. 2010;130:2489–96. doi: 10.1038/jid.2010.162. http://www.pubmedcentral.nih.gov/articlerender.fcgi?artid=2939920&tool=pmcentrez&rendertype=abstract. [DOI] [PMC free article] [PubMed] [Google Scholar]
- Sano MB, Neal RE, Garcia PA, Gerber D, Robertson J, Davalos RV. Towards the creation of decellularized organ constructs using irreversible electroporation and active mechanical perfusion. Biomed Eng Online. 2010;9:83. doi: 10.1186/1475-925X-9-83. http://www.biomedical-engineering-online.com/content/9/1/83. [DOI] [PMC free article] [PubMed] [Google Scholar]
- Seifert AW, Kiama SG, Seifert MG, Goheen JR, Palmer TM, Maden M. Skin shedding and tissue regeneration in African spiny mice (Acomys) Nature. 2012;489:561–565. doi: 10.1038/nature11499. http://www.nature.com.ezp-prod1.hul.harvard.edu/nature/journal/v489/n7417/full/nature11499.html. [DOI] [PMC free article] [PubMed] [Google Scholar]
- Smith JC, Boone BE, Opalenik SR, Williams SM, Russell SB. Gene profiling of keloid fibroblasts shows altered expression in multiple fibrosis-associated pathways. J Invest Dermatol. 2008;128:1298–310. doi: 10.1038/sj.jid.5701149. http://www.pubmedcentral.nih.gov/articlerender.fcgi?artid=2933038&tool=pmcentrez&rendertype=abstract. [DOI] [PMC free article] [PubMed] [Google Scholar]
- Song F, Li B, Stocum DL. Amphibians as research models for regenerative medicine. Organogenesis. 2011;6:141–150. doi: 10.4161/org.6.3.12039. [DOI] [PMC free article] [PubMed] [Google Scholar]
- Sonnemann KJ, Bement WM. Wound Repair: Toward Understanding and Integration of Single-Cell and Multicellular Wound Responses. Annu Rev Cell Dev Biol. 2011 doi: 10.1146/annurev-cellbio-092910-154251. [DOI] [PMC free article] [PubMed] [Google Scholar]
- Spugnini EP, Arancia G, Porrello A, Colone M, Formisano G, Stringaro A, Citro G, Molinari A. Ultrastructural modifications of cell membranes induced by “electroporation” on melanoma xenografts. Microsc Res Tech. 2007;70:1041–1050. doi: 10.1002/jemt.20504. [DOI] [PubMed] [Google Scholar]
- Steinchen A, Gallez D, Sanfeld A. A viscoelastic approach to the hydrodynamic stability of membranes. J Colloid Interface Sci. 1982;85:5–15. [Google Scholar]
- Sugár I. A theory of the electric field-induced phase transition of phospholipid bilayers. Biochim Biophys Acta. 1979;556:72–85. doi: 10.1016/0005-2736(79)90420-6. [DOI] [PubMed] [Google Scholar]
- Tamiolakis D, Papadopoulos N, Anastasiadis P, Karamanidis D, Romanidis K, Stellos K, Kotini A, Polihronidis A, Simopoulos C. Expression of laminin, type IV collagen and fibronectin molecules is related to embryonal skin and epidermal appendage morphogenesis. Clin Exp Obstet Gynecol. 2001;28:179–82. http://www.ncbi.nlm.nih.gov/pubmed/11530869. [PubMed] [Google Scholar]
- Thompson CM, Hocking AM, Honari S, Muffley LA, Ga M, Gibran NS. Genetic risk factors for hypertrophic scar development. J Burn Care Res. 34:477–82. doi: 10.1097/BCR.0b013e3182a2aa41. http://www.pubmedcentral.nih.gov/articlerender.fcgi?artid=3786175&tool=pmcentrez&rendertype=abstract. [DOI] [PMC free article] [PubMed] [Google Scholar]
- Toyoshima K, Asakawa K, Ishibashi N, Toki H, Ogawa M, Hasegawa T, Irié T, Tachikawa T, Sato A, Takeda A, Tsuji T. Fully functional hair follicle regeneration through the rearrangement of stem cells and their niches. Nat Commun. 2012;3:784. doi: 10.1038/ncomms1784. http://www.nature.com/ncomms/journal/v3/n4/full/ncomms1784.html?WT.ec_i. [DOI] [PMC free article] [PubMed] [Google Scholar]
- Tsong TY. Electroporation of cell membranes. Biophys J. 1991;60:297–306. doi: 10.1016/S0006-3495(91)82054-9. [DOI] [PMC free article] [PubMed] [Google Scholar]
- Villiger M, Zhang EZ, Nadkarni SK, Oh WY, Vakoc BJ, Bouma BE. Spectral binning for mitigation of polarization mode dispersion artifacts in catheter-based optical frequency domain imaging. Opt Express. 2013;21:16353–16369. doi: 10.1364/OE.21.016353. http://ovidsp.ovid.com/ovidweb.cgi?T=JS&CSC=Y&NEWS=N&PAGE=fulltext&D=medl&AN=23938487\nhttp://sfx.bibl.ulaval.ca:9003/sfx_local?sid=OVID:medline&id=pmid:23938487&id=doi:10.1364/OE.21.016353&issn=1094-4087&isbn=&volume=21&issue=14&spage=16353&pages=16353-6. [DOI] [PMC free article] [PubMed] [Google Scholar]
- Weaver JC. Electroporation of cells and tissues. IEEE Trans Plasma Sci. 2000;28:24–33. [Google Scholar]
- Weaver JC, Chizmadzhev YA. Theory of electroporation: A review. Bioelectrochemistry Bioenerg. 1996;41:135–160. http://www.sciencedirect.com/science/article/pii/S0302459896050623. [Google Scholar]
- Wong VW, Rustad KC, Akaishi S, Sorkin M, Glotzbach JP, Januszyk M, Nelson ER, Levi K, Paterno J, Vial IN, Kuang AA, Longaker MT, Gurtner GC. Focal adhesion kinase links mechanical force to skin fibrosis via inflammatory signaling. Nat Med. 2011 doi: 10.1038/nm.2574. [DOI] [PMC free article] [PubMed] [Google Scholar]
- Yannas IV, Lee E, Orgill DP, Skrabut EM, Murphy GF. Synthesis and characterization of a model extracellular matrix that induces partial regeneration of adult mammalian skin. Proc Natl Acad Sci U S A. 1989;86:933–7. doi: 10.1073/pnas.86.3.933. http://www.pubmedcentral.nih.gov/articlerender.fcgi?artid=286593&tool=pmcentrez&rendertype=abstract. [DOI] [PMC free article] [PubMed] [Google Scholar]
- Yarmush ML, Golberg A, Serša G, Kotnik T, Miklavčič D. Electroporation-Based Technologies for Medicine: Principles, Applications, and Challenges. Annu Rev Biomed Eng. 2014;16:295–320. doi: 10.1146/annurev-bioeng-071813-104622. http://www.annualreviews.org/doi/abs/10.1146/annurev-bioeng-071813-104622?journalCode=bioeng. [DOI] [PubMed] [Google Scholar]
Associated Data
This section collects any data citations, data availability statements, or supplementary materials included in this article.