



Abstract
Aims
The aim of the present study was to evaluate the impact of adverse drug events (ADEs) and treatment satisfaction on antihypertensive medication adherence.
Methods
A cross‐sectional study was conducted in six public hospitals in Ethiopia. We included adult ambulatory patients on antihypertensive medication. Adherence was measured using the eight‐point Morisky Medication Adherence Scale, which categorizes as low (0–5), medium (6–7) and high (8) adherence. Treatment satisfaction was measured using the Treatment Satisfaction Questionnaire for Medication (TSQM) version 1.4, which included questions about ADEs. Data were analysed using generalized ordered logistic regression with 95% confidence intervals (CIs).
Results
We included 925 out of 968 patients. Overall, 42% of patients scored low, 37% medium and 21% high adherence. Satisfaction with treatment was low, with a mean (standard deviation) TSQM score for global satisfaction of 51 (14). A total of 193 (21%) patients experienced 421 ADEs – mainly dyspeptic symptoms (12%), headache (11%) and cough (11). Experiencing more ADEs reduced the odds of being adherent [low vs. medium/high: odds ratio (OR) OR1 0.77 (95% CI 0.67, 0.89), and low/medium vs. high: OR2 0.55 (05% CI 0.41, 0.73)]. Being more satisfied increased the odds of being adherent [low vs. medium/high: OR1 1.02 (95% CI 1.01, 1.03)]. Taking medication >1 year [OR1 = 2, 0.60 (95% CI 0.43, 0.83)] and taking calcium channel blockers [OR1 = 2 0.71 (95% CI 0.54, 0.92)] decreased the odds for both low vs. medium/high and low/medium vs. high adherence.
Conclusions
Only one in five patients reported perfect (high) adherence to their antihypertensive treatment regimen. Experiencing ADEs and being dissatisfied with treatment were associated with lower adherence. In addition to addressing treatment satisfaction and drug safety in first‐world countries, these should also be addressed in resource‐poor settings, within patient consultations, to enhance adherence.
Keywords: adverse drug event, ambulatory patients, antihypertensive medication, generalized ordered logistic regression, hypertension, medication adherence, treatment satisfaction
What is Already Known about this Subject
Experiencing adverse drug events and treatment satisfaction can affect medication adherence.
Better adherence to antihypertensive medication results in improved cardiovascular outcomes.
Only a few studies have assessed the association of treatment satisfaction with antihypertensive medications, and there is no published study in Ethiopia or sub‐Saharan Africa.
What this Study Adds
Only one in five patients reported high adherence to their antihypertensive treatment regimen.
Experiencing more adverse drug events and low treatment satisfaction was inversely associated with antihypertensive medication adherence.
In addition to addressing treatment satisfaction and drug safety in first‐world countries, these should also be addressed in resource‐poor settings, within patient consultations, to enhance adherence.
Tables of Links
| TARGETS |
|---|
| Enzymes 2 |
| Angiotensin‐converting enzyme |
| Beta‐adrenergic receptor kinases |
| Voltage-gated ion channels 3 |
| Voltage‐gated calcium channels |
These Tables list key protein targets and ligands in this article that are hyperlinked to corresponding entries in http://www.guidetopharmacology.org, the common portal for data from the IUPHAR/BPS Guide to pharmacology 1, and are permanently archived in the Concise Guide to PHARMACOLOGY 2015/16 2, 3.
Introduction
Adherence to antihypertensive medication can significantly reduce hypertension‐associated cardiovascular morbidity and mortality 4. Factors affecting adherence include patient characteristics, socioeconomic status, therapy condition and health system/healthcare team 5. Overall, experiencing adverse drug events (ADEs) is one of the important factors for patient medication adherence 6. Furthermore, low treatment satisfaction is a major concern for adherence, particularly in patients with chronic diseases. Treatment satisfaction provides an understanding of a patient's perspective on his/her treatment 7, 8. The concept of treatment satisfaction has gained growing importance over the past three decades 7, 8, 9, 10. However, there are few studies that have tried to assess the relationship between antihypertensive medication adherence, ADEs and treatment satisfaction 7, 10, and, in particular, this has not been studied in sub‐Saharan Africa. Factors which are particularly relevant in this context include the need to continue treatment, despite experiencing (mild) side effects, because of a limited availability of alternative drugs or a higher cost of alternative medication; low literacy; poor social support; and a lack of access to healthcare and continuity of care 11.
The prevalence of hypertension in African countries, including Ethiopia, is increasing 12, 13, and mortality rates of cardiovascular diseases in low‐ and middle‐income countries is much higher than in high‐income countries 14. Understanding potential determinants – treatment satisfaction and ADEs – for medication adherence could be used to design programmes to improve treatment outcomes. Therefore, the aim of the present study was to: (i) assess the level of antihypertensive medication adherence; and (ii) evaluate the impact of experiencing ADEs related to antihypertensive medication, and treatment satisfaction on adherence in Ethiopia.
Methods
Study design and setting
In this cross‐sectional study, we included two specialized referral hospitals (Tikur Anbessa and St Paul's) in Addis Ababa, the capital city of Ethiopia, and four general hospitals in Ethiopia (Yekatit 12 Hospital in Addis Ababa, and Lemlem Karl Hospital in Maychew, Mekelle Hospital in Mekelle, and St Mary's in Axum; all in Tigray Regional State).
Study population
Patients were recruited in the waiting areas of the hypertension outpatient clinics in our six study hospitals. We used a consecutive sampling technique, whereby patients were approached successively and recruited until the required sample size was achieved at each hospital. Inclusion criteria included adult hypertensive patients (≥18 years) who had received at least one antihypertensive medication prescription from the same hospital previously, as reported by the patient and/or recorded in their appointment card (these data were verified with the patient medical record) and who gave informed consent. Patients were excluded if their medical records were unavailable or incomplete, if they had indicated that they were hypertensive but proved not to be after a review of the medication record, and if they were not able to complete the eight‐point Morisky Medication Adherence Scale (MMAS‐8) questionnaire.
We did not conduct a formal sample size calculation as we used available data from another project (unpublished data). In that project, we aimed for a representative sample size of patients with hypertension and controlled blood pressure (BP). This resulted in the recruitment of 984 patients equally distributed over the six hospitals, based on an estimated prevalence of 30% of patients with controlled BP and 10% for potential missing cases.
Data collection
Patients were interviewed before they went into the doctor's consultation room. After the consultation was completed, patient medical records were reviewed to collect additional treatment parameters (prescribed medications and comorbid illnesses). The interviews were conducted by professional nurses or pharmacists, using a case‐report form. The same staff reviewed the patient records. Data were collected between February and August 2015. One of the authors (D.F.B.) supervised data collection on site.
Outcome measure
Patients were interviewed about how they had adhered to their prescribed antihypertensive medication, using the MMAS‐8 15. Adherence was grouped into either of three ordinal categories based on eight questions; a score of 0–5 was considered as low adherence, a score of 6–7 as medium adherence, and a score of 8 as high adherence 15.
Main explanatory variables
Patients were also interviewed for their antihypertensive medication‐related treatment satisfaction. Quintiles Inc., San Francisco, CA, USA provided us with the 14‐item Treatment Satisfaction Questionnaire for Medication (TSQM) version 1.4 16. The TSQM comprises four domains: (i) effectiveness (TSQM 1–3); (ii) side effects (TSQM 4, 5–8); (iii) convenience (TSQM 9–11); and (iv) global satisfaction (TSQM 12–14). The score in each domain ranges from 0 to 100, with a higher score representing more satisfaction 16. Patients who reported that they did not experience any ADEs (a ‘no’ response to TSQM 4) skipped TSQM questions 5–8, and were given a score of 100% for the side effect‐related satisfaction domain. Participants who reported any antihypertensive medication‐related ADE were asked in local vernacular what ADE they had experienced. In addition, patient records were reviewed for any documented ADEs since their previous visit. For the analysis, we combined reported and documented ADEs.
For the purpose of the present study, both MMAS‐8 and TSQM scales were translated into two Ethiopian languages (Amharic and Tigrigna), which are spoken in the catchment area of our study. The translation process followed a stepwise process with translation, back translation and piloting, as described by Beaton et al. 17. Translations and transcripts of the translation process were sent to Quintiles Inc., San Francisco, CA, USA. (TSQM v.1.4) and Morisky (MMAS‐8). The internal consistency of the questionnaire was assessed: MMAS‐8 (eight items, Cronbach's alpha 0.72), effectiveness (three items, Cronbach's alpha 0.88), side effects (four items, Cronbach's alpha 0.81), convenience (three items, Cronbach's alpha 0.79) and global satisfaction scale (three items, Cronbach's alpha 0.80).
Other explanatory variables
Other variables included were: (i) sociodemographics (age, gender, educational status, alcohol use and smoking history); (ii) hospital type (specialized/general); (iii) comorbid cardiometabolic illnesses; and (iv) antihypertensive treatment characteristics {drug class prescribed [angiotensin‐converting enzyme (ACE) inhibitor, beta‐blocker, calcium channel blocker and diuretic], duration of antihypertensive treatment [≤1 year/ >1 year) and medication regimen complexity index}. A higher score indicates a more complex treatment regimen – i.e. with more drugs, frequent dosing schedule and/or more cumbersome administration route 18.
Statistical analyses
For data entry, processing and descriptive statistics, we used Microsoft access 10, and SPSS software, version 22.0 (SPSS, Inc., Chicago, IL, U. Stata version 13 (Stata Corp, College Station, TX, USA) was used for bi/multivariable generalized ordered logistic regression.
Owing to the ranked outcome (low, medium and high adherence), we used generalized ordered logistic regression (gologit) with autofit (also called ‘partial proportional odds’) for assessing the association between adherence and explanatory variables 19. The gologit model with autofit is a hybrid of ordinal regression (same odds ratio across categories) and the default gologit (different odds ratio across categories). If proportional odds assumption (the Brant test) was violated, the analysis gave two odds ratios (OR1 and OR2) for an explanatory variable (Figure 1). For variables that did not violate the assumption, a single OR1 = 2 was reported – i.e. OR1 = OR2 19. Bivariable gologit models were used for variable inclusion to the final multivariable model.
Figure 1.

Analysis of adherence measured on the eight‐point Morisky Medication Adherence Scale (MMAS‐8), using generalized ordered logistic regression (gologit). The level of adherence was classified into low, medium and high adherence groups, based on MMAS‐8 scores of 0–5; 6–7; and 8, respectively. Low vs. medium/high adherence (OR1) and low/medium vs. high adherence (OR2). OR, odds ratio; OR1 = OR2 (OR1 = 2) if the variable does not violate proportional odds assumption
We developed two statistical multivariable gologit models with autofit. In the primary model, we used two main explanatory variables (global satisfaction and number of ADEs per patient), and other potential determinants with P < 0.20 in the bivariable model is inclusion criteria of variables in the multivariable variable model. We included the global satisfaction score as this captured the overall satisfaction of patients with their antihypertensive medication. In the secondary model, we evaluated the impact of the three TSQM domains (effectiveness, side effects and convenience) on adherence adjusted for other potential determinants with P < 0.20 in the bivariable model for inclusion criteria of variables in the multivariable variable model. This secondary model did not include the variable ‘number of ADEs’ because of collinearity with the side effect‐related TSQM domain (r = −0.8). We also tested for possible collinearity within each multivariable gologit model, and variables were not strongly correlated. Statistical significance for the multivariable model was set at P < 0.05.
Ethical considerations
This study was approved by Ethiopian Health Research Ethical Review Committees of: (i) the College of Health Sciences, Mekelle University; (ii) St Paul's Hospital Millennium Medical College; and (iii) the Department of Internal Medicine, School of Medicine, College of Health Sciences, Addis Ababa University. All participants gave informed consent. Considering the expected low literacy rate, data collectors read the consent statement to the patients and then marked a potential participant's consent (yes/no) on the case‐report form.
Results
We approached 968 patients, of whom eight refused to participate, six were not hypertensive, 18 had unavailable or incomplete medication records, and 11 did not complete the MMAS‐8 (Figure 2). Our analysis thus included 925 patients. The mean age was 57 [standard deviation (SD) 14] years and 570 (63%) were females. One‐third of study participants had at least one comorbid illness (n = 319). The most common comorbid illness was diabetes mellitus (n = 229), and 66 (7%) patients had two or more comorbidities (Table 1). Overall, 334 (38%) patients had their BP controlled (<140/90 mmHg). Commonly prescribed antihypertensive medications were ACE inhibitors 509 (55%), diuretics 505 (55%), calcium channel blockers 451 (49%) and beta‐blockers 174 (19%). The most commonly prescribed drugs within each group were enalapril (n = 507), hydrochlorothiazide (n = 438), nifedipine (n = 402) and atenolol (n = 151). The median of the regimen complexity indices was 6 (interquartile range 4–9). The highest regimen complexity indices were observed in patients with diabetes who were using multiple drugs, including injectable insulin.
Figure 2.
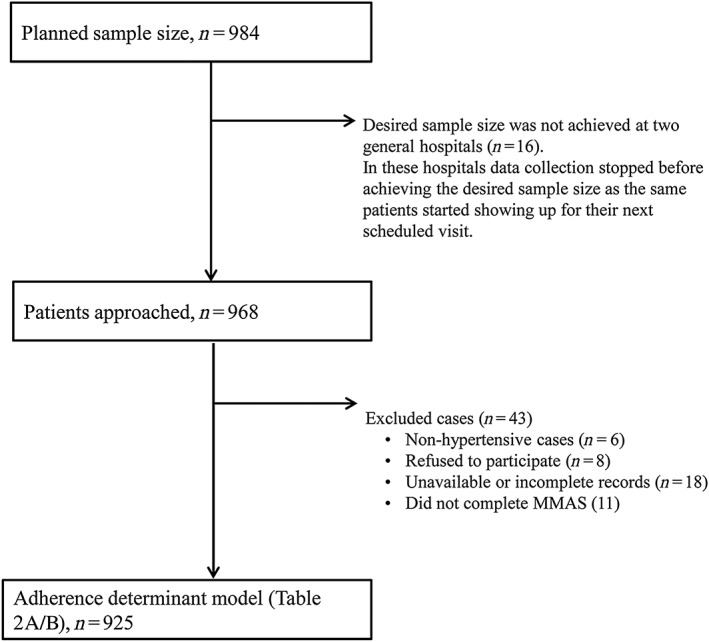
Case inclusion flow chart for analysis. MMAS, Morisky Medication Adherence Scale
Table 1.
Determinants for antihypertensive medication adherence; bivariable generalized ordered logistic regression model
| Adherence (MMAS‐8) score | Bivariable model at 95% CI | |||||||
|---|---|---|---|---|---|---|---|---|
| Characteristics | Total | Low (0–5) | Medium (6–7) | High (=8) | OR1 | OR1 = 2 | OR2 | P‐value(s) |
| Adherence score | 391 (42) | 340 (37) | 194 (21) | |||||
| Demographics (yes vs. no [ref]) a | ||||||||
| Age (mean, SD) | 57 (14) | 57 (14) | 57 (19) | 56 (12) | 1.00 [0.99, 1.01] | 0.41 | ||
| Female (vs. male [ref ]) (n, %) | 570 (63) | 234 (61) | 220 (66) | 116 (60) | 1.04 [0.81, 1.34] | 0.74 | ||
| Smoking history (n, %) | 60 (7) | 29 (8) | 25 (7) | 6 (5) | 0.69 [0.41, 1.09] | 0.10 | ||
| Alcohol use (n, %) | 398 (44) | 191 (50) | 128 (39) | 79 (41) | 0.72 [0.57, 0.93] | 0.01 | ||
| Married (n, %) | 585 (64) | 253 (66) | 208 (62) | 124 (65) | 0.94 [0.73, 1.21] | 0.64 | ||
| Education (n, %) | ||||||||
| Primary or no formal education | 583 (65) | 252 (66) | 201 (61) | 130 (69) | Refa | |||
| Secondary education | 142 (16) | 60 (16) | 60 (18) | 22 (12) | 0.90 [0.64, 1.26] | 0.54 | ||
| College/University | 175 (19) | 70 (18) | 68 (21) | 37 (20) | 1.07 [0.78, 1.46] | 0.69 | ||
| Hospital type | ||||||||
| General hospitals | 632 (68) | 255 (40) | 240 (38) | 137(22) | Ref | |||
| Specialized hospitals | 293 (32) | 136 (46) | 100 (34) | 57 (20) | 0.81 [0.62, 1.05] | 0.12 | ||
| Treatment satisfaction (TSQM) a (mean, SD) | ||||||||
| Effectiveness | 64 (17) | 62 (18) | 66 (17) | 66 (18) | 1.01 [1.00, 1.02] | <0.01 | ||
| Side effects | 88 (26) | 84 (29) | 89 (25) | 95 (19) | 1.01 [1.01, 1.02] | <0.01 | ||
| Convenience | 64 (14) | 60 (16) | 65(13) | 70 (11) | 1.04 [1.03, 1.05] | <0.01 | ||
| Global (overall) satisfaction | 51 (14) | 49 (14) | 53(13) | 52 (13) | 1.02 [1.01, 1.03] | 1.01 [1.00; 1.02] | <0.01/0.13 | |
| ADE | ||||||||
| Number of ADEs (mean, SD) | 0.5 (1) | 0.7(1.2) | 0.4 (1.0) | 0.1 (0.0) | 0.72 [0.63, 0.82] | 0.51 [0.38; 0.69] | <0.01/<0.01 | |
| Diseases (yes vs. no [ref]) a (n, %) | ||||||||
| Diabetes | 229 (25) | 98 (25) | 93 (27) | 38 (20) | 0.88 [0.66, 1.15] | 0.35 | ||
| Dyslipidaemia | 58 (6) | 27 (7) | 22 (6) | 9 (5) | 0.79 [0.48, 1.29] | 0.34 | ||
| Heart failure or previous myocardial infarction | 74 (8) | 36 (9) | 24 (7) | 14 (7) | 0.78 [0.50, 1.23] | 0.30 | ||
| Renal disease | 24 (3) | 13 (3) | 7 (2) | 4 (17) | 0.64 [0.29, 1.41] | 0.27 | ||
| Treatment characteristics (yes vs. no [ref]) a (n, %) | ||||||||
| ACE inhibitors | 509 (55) | 207 (53) | 197 (58) | 105 (54) | 1.09 [0.85, 1.38] | 0.50 | ||
| Beta‐blockers | 174 (19) | 79 (20) | 68 (20) | 27 (14) | 0.79 [0.58, 1.07] | 0.13 | ||
| Calcium channel blockers | 451 (49) | 213 (54) | 164 (48) | 74 (38) | 0.64 [0.50, 0.82] | <0.01 | ||
| Diuretics | 505 (55) | 213 (54) | 187 (55) | 105 (54) | 1.00 [0.78, 1.27] | 0.98 | ||
| Regimen complexity Index (median, IQR) | 6 (4; 9) | 6 (4;10) | 6 (4;9) | 5 (3; 8) | 0.96 [0.93, 0.98] | <0.01 | ||
| Duration of therapy (n, %) | ||||||||
| ≤1 year | 173 (20) | 56 (15) | 66 (21) | 51 (28) | Refa | |||
| >1 year | 699 (80) | 312 (85) | 254 (79) | 133 (72) | 0.58 [0.43, 0.79] | <0.01 | ||
As global satisfaction and ADEs violated the proportional odds assumption, OR1 ≠ OR2 values are presented separately. Odds ratio 1 (OR1) for low vs. medium and high adherence; odds ratio 2 (OR2) for low and medium vs. high adherence. For all other variables, OR1 = OR2, and these are presented in the column OR1 = 2.
ACE, angiotensin‐converting enzyme; ADE, adverse drug event, CI, confidence interval; gologit, generalized ordered logistic regression; IQR, interquartile range; MMAS, eight‐point Morisky Medication Adherence Scale; SD, standard deviation; TSQM, Treatment Satisfaction Questionnaire for Medication
The score in each TSQM domain ranges from 0 to 100, with higher score representing more satisfaction.
Determinants for which there were only two categories only the ‘yes’ category is presented, e.g. the smokers in our study population. Those that did belonged to the ‘no’ category, here the non‐smokers are the reference [ref] group for the analyses.
Based on MMAS‐8, 391 (42%) of the study participants scored low, 340 (37%) medium and 194 (21%) high adherence to their antihypertensive medication (Table 1). The overall median adherence score was 6 (interquartile range: 4–9).
We identified 193 (21%) patients experiencing a total of 421 ADEs. Up to six ADEs were observed per patient (Supporting Information Table S1). The majority of ADEs (n = 402) experienced by patients (n = 182) were captured during the interviews. Only 26 patient medical records had documented ADEs; for 15 of these charts, these ADEs were also reported by the patients during their interviews. The most commonly reported ADEs were dyspeptic symptoms [52 (12%)], headache [47 (11%)], cough [46 (11%)], fatigue/weakness [39 (9%)], leg swelling [27 (6%)] and palpitations or other cardiac problems [23 (5%)] (Supporting Information Table S2).
Among TSQM domains, the lowest score was for the global satisfaction domain was 51 (SD 14). The highest mean score for any domain was on side effect‐related satisfaction [88 (SD 26)]. This result was driven by the 732 (79%) patients who did not report any ADE and received a score of 100% for this domain. Considering only those patients who had reported ADE(s), the side effect‐related satisfaction score was 41 (SD 25).
In the primary model (Table 2A), a one‐point increase in the global satisfaction score was associated with an increased odds of having medium/high adherence scores {OR1 1.02 [95% confidence interval (CI) 1.01, 1.03]} but no significant difference for low/medium vs. high scores. Experiencing more ADEs significantly reduced the odds of being adherent [low vs. medium/high scores, OR1 0.77 (95% CI 0.67, 0.89)], with the biggest effect for the low/medium vs. high adherence levels [OR2 0.55 (95% CI 0.41, 0.73)]. Patients taking their medication for more than a year were less likely to have higher adherence levels (OR1 = 2, 0.60 [95% CI 0.43, 0.83]). In addition, antihypertensive medication regimens containing calcium channel blockers decreased the odds of having higher adherence levels [OR1 = 2 0.71 (95% CI 0.54, 0.92)].
Table 2A.
Impact of ADE experience and global satisfaction (TSQM) on medication adherence adjusted for other explanatory variables
| Multivariable primary gologit model at 95% CI | |||||
|---|---|---|---|---|---|
| Explanatory variable | OR1 | OR1 = 2 | OR2 | P‐value(s) | |
| Global satisfaction a | 1.02 [1.01; 1.03] | 1.00 [0.99, 1.01] | <0.01/0.87 | ||
| Number of ADEs (per patient) | 0.77 [0.67; 0.89] | 0.55 [0.41, 0.73] | <0.01/<0.01 | ||
| Regiment complexity index | 0.99 [0.96, 1.02] | 0.41 | |||
| Duration of therapy (>1 year vs. ≤1 year [ref]) | 0.60 [0.43, 0.83] | <0.01 | |||
| Alcohol use (yes vs. no [ref ]) b | 0.77 [0.59,1.00] | 0.05 | |||
| Smoking (yes vs. no [ref]) b | 0.73 [0.42, 1.28] | 0.27 | |||
| Specialized (vs. general [ref]) b hospitals | 0.90 [0.67, 1.23] | 0.50 | |||
| Beta‐blockers (yes vs. no [ref]) b | 0.94 [0.65, 1.35] | 0.74 | |||
| Calcium channel blockers (yes vs. no [ref]) b | 0.71 [0.54, 0.92] | 0.01 | |||
In the secondary multivariable model (Table 2B), higher TSQM convenience scores were associated with better adherence [low vs. medium/high: OR1 1.03 (95% CI 1.02, 1.04) and low/medium vs. high: OR2 1.05 (95% CI 1.03, 1.06)]. Higher side effect satisfaction scores were associated with achieving higher adherence scores [OR1 = 2 1.01 (95% CI 1.00, 1.01)]. Similarly to the primary model (Table 2A), patients with more than 1 year of treatment duration [OR1 = 2 0.65 (95% CI 0.47, 0.90)], and with a treatment regimen containing calcium channel blockers [OR1 = 2 0.71 (95% CI 0.54, 0.93)], had a significantly decreased odds for higher levels of adherence. Alcohol use was significantly associated with lower levels of adherence [OR1 = 2 0.75 (95% CI 0.57, 0.97); see Table 2B], while in the primary model (Table 2A) this effect just failed to achieve statistical significance.
Table 2B.
Impact of TSQM subscales (effectiveness, side effects and convenience) on medication adherence adjusted for other explanatory variables
| Multivariable secondary gologit model, 95% CI | |||||
|---|---|---|---|---|---|
| Explanatory variable | OR1 | OR1 = 2 | OR2 | P‐value(s) | |
| Effectiveness a | 1.00 [0.99; 1.01] | 0.99 [0.98, 1.00] | 0.61/0.05 | ||
| Convenience a | 1.03 [1.02; 1.04] | 1.05 [1.03, 1.06] | <0.01/<0.01 | ||
| Side effects a | 1.01 [1.00, 1.01] | 0.03 | |||
| Regiment complexity index | 1.00 [0.97, 1.03] | 0.94 | |||
| Duration of therapy (> 1 year vs. ≤1 year [ref]) | 0.65 [0.47, 0.90] | 0.01 | |||
| Alcohol use (yes vs. no [ref]) b | 0.75 [0.57, 0.97] | 0.03 | |||
| Smoking (yes vs. no [ref]) b | 0.76 [0.43, 1.34] | 0.35 | |||
| Specialized (vs. general [ref]) hospitals b | 0.89 [0.65, 1.21] | 0.45 | |||
| Beta blockers (yes vs. no [ref]) b | 0.94 [0.65, 1.21] | 0.72 | |||
| Calcium channel blockers (yes vs. no [ref]) b | 0.71 [0.54, 0.93] | 0.01 | |||
As global satisfaction, Number of ADEs (per patient) ADEs, effectiveness, and convenience violated the proportional odds assumption, OR1 ≠ OR2 and values are presented separately. Odds ratio 1 (OR1) for low vs. medium and high adherence; Odds Ratio 2 (OR2) for low and medium vs. high adherence. For all other variables, OR1 = OR2 and these are presented in the column OR1 = 2. Variables with P < 0.20 in the bivariable model (Table 1) were included in these multivariable models (Table 2A and B)
ADE, adverse drug event; CI, confidence interval; gologit, generalized ordered logistic regression; TSQM, Treatment Satisfaction Questionnaire for Medication
The score in each TSQM domain ranges from 0 to 100, with higher scores representing more satisfaction.
Determinants for which there were only two categories only the ‘yes’ category is presented, e.g. the smokers in our study population. Those that did belonged to the ‘no’ category, here the non‐smokers are the reference [ref] group for the analyses.
Discussion
This was one of the few studies from sub‐Saharan Africa investigating the association between ADEs, treatment satisfaction and adherence to antihypertensive medication. The study indicated that adherence with antihypertensive medication was high for 21%, medium for 37% and low for 42% of ambulatory patients from six Ethiopian hospitals. Across the different adherence categories, lower adherence was associated with experiencing more ADEs and not being satisfied with treatment. We also found that adherence was negatively affected by treatment regimens containing calcium channel blockers, taking medication for longer than a year, and by regular or occasional alcohol use.
The level of adherence found fell within the wide range (15–93%) of non‐adherence reported in low‐ and middle‐income countries 20. Only 21% of patients had high levels of adherence. This is a serious concern as poor adherence may negatively affect the benefit of antihypertensive agents on cardiovascular outcomes 4, 5, and implies a waste of scarce resources. The proportion of patients with high adherence in our study lies between the values reported in studies performed in Ghana (7%) and Nigeria (8%), and those in Palestine (36%), China (52%) and France (50%) 10, 21, 22, 23, 24. These studies also used MMAS‐8, separating levels similarly into low/medium and high adherence.
Patients who experience ADEs from their medication are more likely to be non‐adherent, and to have a poor outcome 6. In our study, 21% of patients had experienced ADEs, and these were indeed strong predictors for poor medication adherence. It has been reported that up to 20% of all outpatients experience ADEs to any prescribed medication; this reinforces the need to pay attention to ADEs in follow‐up consultations 25.
Our findings show that treatment satisfaction is an important predictor of antihypertensive medication adherence in an Ethiopian ambulatory patient population. It confirms the association reported between adherence and satisfaction in general 9, and specifically between antihypertensive medication adherence and treatment satisfaction, as reported in two earlier studies from Palestine and Lebanon 7, 10. The satisfaction scores of the TSQM domains – effectiveness, side effects and convenience – are similar to those cited in the afore‐mentioned Palestinian study, which also reported domain‐specific scores 10; however, global satisfaction in the latter study was higher than in the present study. Patients in our study rated this domain the lowest of all TSQM domains. Even though global satisfaction in the TSQM focuses on medication‐related treatment satisfaction, which was emphasized by our interviewers, the low score may mean that our patients interpreted this question as scoring the overall healthcare service.
Our study indicates that patients treated for more than a year require attention, as they had lower adherence scores than patients in their first year of treatment. It has been reported elsewhere that up to 50% of patients become non‐adherent during their first year of treatment 5, 26, but adherence problems with longer treatment durations have also been reported 5. This suggests that patients require attention and need to be motivated to continue treatment as prescribed – not just at the start of treatment, but throughout the whole period of medication use. Calcium channel blocker use was associated with poor medication adherence. In our setting, the limited availability of alternative agents may have contributed to this effect. Nifedipine was the most commonly prescribed (90% of all prescribed calcium channel blockers), although safety issues and once‐daily dosing make amlodipine preferable over nifedipine 27. Finally, we found that alcohol use had a significant effect on adherence in the secondary model. This is in line with a systematic review that showed a generally negative impact of alcohol use on medication adherence in patients with chronic illnesses 28. However, three studies in that review included patients with hypertension, and, of these, only one showed a negative association between alcohol use and adherence 28.
What are the practical implications of our study? As highlighted above, poor adherence threatens the potential cardiovascular benefit of treatment with antihypertensive medication. This may result in more strokes, myocardial infarctions and cardiovascular mortality 4, 5. Moreover, in developing countries, antihypertensive treatment has been found to be among the most cost‐effective measures to reduce cardiovascular mortality and morbidity, 29, 30. In our study, we identified significant determinants of adherence that are modifiable and can be improved through interventional strategies – i.e. medication adherence can be improved by addressing treatment satisfaction and the management of ADEs. Strategies may include patient education and counselling – e.g. involving family members, actively involving patients in decision making, and training healthcare providers in patient counselling and ADE management 31. This may be challenging in Ethiopia due to the limited number of physicians, as with many other developing countries 32. Increasing the role of nurses and pharmacists in patient counselling may be a solution. This would also need more inter‐professional communication, to enhance prescribers' knowledge about patients' satisfaction and level of adherence. In Europe, this has been suggested in the latest European Society of Hypertension/European Society of Cardiology hypertension guideline as a ‘team‐based care for hypertension’ concept 33. Optimizing the dose and dosing schedule may partly ameliorate the experienced ADEs when there are limited treatment options. Given the lack of available studies showing that interventions to improve treatment satisfaction improve adherence 7, 34, further research is required in what may be the most effective intervention strategies.
Strengths and limitations
Papers reporting adherence, as measured with the MMAS‐8, are often dichotomized, at the cost of losing information, and there is inconsistency in the selection of the most appropriate cut‐off value to define good adherence 7, 20, 35. We tried to maximize the methodological rigour of our study by categorizing adherence into three levels of adherence, proposed by Morisky, and used gologit to enable statistical analyses on an ordinal outcome 15, 19.
A limitation of our study was the validity of the tools. We followed a standard stepwise translation procedure but this did not include a cognitive validation step. Nevertheless, both TSQM and MMAS‐8 captured differences between study participants. Even though most of the ADEs reported were typical for antihypertensive medication, a formal causality assessment of the ADEs was beyond the scope of the study. Finally, the TSQM domain of effectiveness was not associated with adherence. The initially asymptomatic nature of hypertension probably made it difficult for ambulatory hypertensive patients to judge the effectiveness of therapy, unless they measured their own BP and had good clinical knowledge about hypertension. This was unlikely in our study setting, where most of the participants had a low level of education. This may have explained why effectiveness was not a significant determinant for better adherence scores. Our nonrandom consecutive sampling technique may have introduced some bias. For practical reasons, we chose to recruit hypertensive patients attending hypertension clinics. These clinics invited patients for routine visits on specific days. On these days, the majority of hypertensive patients were actually recruited into our study. Our sample was therefore typical for the included hospitals. The mean age of patients in our study (57 years) compares well with the value in a recently published paper in south‐west Ethiopia (54 years); however, our study included more women (63% vs. 46%, respectively) 36.
Conclusion
Only one in five patients reported good adherence to their antihypertensive treatment regimen. Experiencing ADEs and being dissatisfied with treatment were associated with lower adherence. Specific medications (especially calcium channel blockers), longer treatment duration and use of alcohol were also associated with lower adherence. In addition to addressing treatment satisfaction and drug safety in first‐world countries, these should also be addressed in resource‐poor settings, within patient consultations, to enhance adherence.
Competing Interests
There are no competing interests to declare.
The study was part of a PhD project funded by NUFFIC (Netherlands Organization for International Cooperation in Higher Education) . The authors wish to thank the study participants, data collectors and study hospital administrators who contributed to this study.
Contributors
D.F.B., K.T. and P.M. designed and performed the research, analysed and interpreted the data, and wrote the manuscript. F.M.H.‐R., A.M. and Y.T.M. were involved in designing and manuscript writing, and J.G.M.B. was involved in the analysis and writing.
Supporting information
Table S1 Number of adverse drug events per patient
Table S2 Type of adverse drug events per patient (n = 421)
Berhe, D. F. , Taxis, K. , Haaijer‐Ruskamp, F. M. , Mulugeta, A. , Mengistu, Y. T. , Burgerhof, J. G. M. , and Mol, P. G. M. (2017) Impact of adverse drug events and treatment satisfaction on patient adherence with antihypertensive medication – a study in ambulatory patients. Br J Clin Pharmacol, 83: 2107–2117. doi: 10.1111/bcp.13312.
References
- 1. Southan C, Sharman JL, Benson HE, Faccenda E, Pawson AJ, Alexander SP, et al. The IUPHAR/BPS Guide to pharmacology in 2016: towards curated quantitative interactions between 1300 protein targets and 6000 ligands. Nucl Acids Res 2016; 44: D1054–D1068. [DOI] [PMC free article] [PubMed] [Google Scholar]
- 2. Alexander SPH, Fabbro D, Kelly E, Marrion N, Peters JA, Benson HE, et al. The Concise Guide to PHARMACOLOGY 2015/16: Enzymes. Br J Pharmacol 2015; 172: 6024–6109. [DOI] [PMC free article] [PubMed] [Google Scholar]
- 3. Alexander SPH, Catterall WA, Kelly E, Marrion N, Peters JA, Benson HE, et al. The Concise Guide to PHARMACOLOGY 2015/16: Voltage‐gated ion channels. Br J Pharmacol 2015; 172: 5904–5941. [DOI] [PMC free article] [PubMed] [Google Scholar]
- 4. Corrao G, Parodi A, Nicotra F, Zambon A, Merlino L, Cesana G, et al. Better compliance to antihypertensive medications reduces cardiovascular risk. J Hypertens 2011; 29: 610–618. [DOI] [PubMed] [Google Scholar]
- 5. Sabaté E. Adherence to long‐term therapies: evidence for action. Geneva: World Health Organization, 2003. [Google Scholar]
- 6. Leporini C, De Sarro G, Russo E. Adherence to therapy and adverse drug reactions: is there a link? Expert Opin Drug Saf 2014; 13: 41–55. [DOI] [PubMed] [Google Scholar]
- 7. Saarti S, Hajj A, Karam L, Jabbour H, Sarkis A, El Osta N, et al. Association between adherence, treatment satisfaction and illness perception in hypertensive patients. J Hum Hypertens 2016; 30: 341–345. [DOI] [PubMed] [Google Scholar]
- 8. Revicki DA. Patient assessment of treatment satisfaction: methods and practical issues. Gut 2004; 53: iv40–iv44. [DOI] [PMC free article] [PubMed] [Google Scholar]
- 9. Barbosa CD, Balp MM, Kulich K, Germain N, Rofail D. A literature review to explore the link between treatment satisfaction and adherence, compliance, and persistence. Patient Prefer Adherence 2012; 6: 39–48. [DOI] [PMC free article] [PubMed] [Google Scholar]
- 10. Sa'ed HZ, Al‐Jabi SW, Sweileh WM, Morisky DE. Relationship of treatment satisfaction to medication adherence: findings from a cross‐sectional survey among hypertensive patients in Palestine. Health Qual Life Outcomes 2013; 11: 191. [DOI] [PMC free article] [PubMed] [Google Scholar]
- 11. Bowry AD, Shrank WH, Lee JL, Stedman M, Choudhry NK. A systematic review of adherence to cardiovascular medications in resource‐limited settings. J Gen Intern Med 2011; 26: 1479–1491. [DOI] [PMC free article] [PubMed] [Google Scholar]
- 12. Kayima J, Wanyenze RK, Katamba A, Leontsini E, Nuwaha F. Hypertension awareness, treatment and control in Africa: a systematic review. BMC Cardiovasc Disord 2013; 13: 54. [DOI] [PMC free article] [PubMed] [Google Scholar]
- 13. Kibret KT, Mesfin YM. Prevalence of hypertension in Ethiopia: a systematic meta‐analysis. Public Health Rev 2015; 36: 1. [DOI] [PMC free article] [PubMed] [Google Scholar]
- 14. World Health Organization . A global brief on hypertension: silent killer, global public health crisis [online]. Available at http://apps.who.int/iris/bitstream/10665/79059/1/WHO_DCO_WHD_2013.2_eng.pdf (last accessed 17 July 2013).
- 15. Morisky DE, Ang A, Krousel‐Wood M, Ward HJ. Predictive validity of a medication adherence measure in an outpatient setting. J Clin Hypertens 2008; 10: 348–354. [DOI] [PMC free article] [PubMed] [Google Scholar] [Retracted]
- 16. Atkinson MJ, Sinha A, Hass SL, Colman SS, Kumar RN, Brod M, et al. Validation of a general measure of treatment satisfaction, the treatment satisfaction questionnaire for medication (TSQM), using a national panel study of chronic disease. Health Qual Life Outcomes 2004; 2: 12. [DOI] [PMC free article] [PubMed] [Google Scholar]
- 17. Beaton DE, Bombardier C, Guillemin F, Ferraz MB. Guidelines for the process of cross‐cultural adaptation of self‐report measures. Spine 2000; 25: 3186–3191. [DOI] [PubMed] [Google Scholar]
- 18. George J, Phun YT, Bailey MJ, Kong DC, Stewart K. Development and validation of the medication regimen complexity index. Ann Pharmacother 2004; 38: 1369–1376. [DOI] [PubMed] [Google Scholar]
- 19. Williams R. Generalized ordered logit/partial proportional odds models for ordinal dependent variables. Stata Journal 2006; 6: 58–82. [Google Scholar]
- 20. Nielsen JØ, Shrestha AD, Neupane D, Kallestrup P. Non‐adherence to anti‐hypertensive medication in low‐and middle‐income countries: a systematic review and meta‐analysis of 92 443 subjects. J Hum Hypertens 2017; 31: 14–21. [DOI] [PubMed] [Google Scholar]
- 21. Kretchy IA, Owusu‐Daaku FT, Danquah S. Locus of control and anti‐hypertensive medication adherence in Ghana. Pan Afr Med J 2014; 17 (Suppl. 1): 13. [DOI] [PMC free article] [PubMed] [Google Scholar]
- 22. Okwuonu CG, Ojimadu NE, Okaka EI, Akemokwe FM. Patient‐related barriers to hypertension control in a Nigerian population. Int J Gen Med 2014; 7: 345–353. [DOI] [PMC free article] [PubMed] [Google Scholar]
- 23. Yue Z, Bin W, Weilin Q, Aifang Y. Effect of medication adherence on blood pressure control and risk factors for antihypertensive medication adherence. J Eval Clin Pract 2015; 21: 166–172. [DOI] [PubMed] [Google Scholar]
- 24. Korb‐Savoldelli V, Gillaizeau F, Pouchot J, Lenain E, Postel‐Vinay N, Plouin PF, et al. Validation of a French version of the 8‐item Morisky medication adherence scale in hypertensive adults. J Clin Hypertens 2012; 14: 429–434. [DOI] [PMC free article] [PubMed] [Google Scholar]
- 25. Tache SV, Sonnichsen A, Ashcroft DM. Prevalence of adverse drug events in ambulatory care: a systematic review. Ann Pharmacother 2011; 45: 977–989. [DOI] [PubMed] [Google Scholar]
- 26. Jin J, Sklar GE, Oh VM, Li SC. Factors affecting therapeutic compliance: a review from the patient's perspective. Ther Clin Risk Manag 2008; 4: 269–286. [DOI] [PMC free article] [PubMed] [Google Scholar]
- 27. de Champlain J, Karas M, Nguyen P, Cartier P, Wistaff R, Toal CB, et al. Different effects of nifedipine and amlodipine on circulating catecholamine levels in essential hypertensive patients. J Hypertens 1998; 16: 1357–1369. [PubMed] [Google Scholar]
- 28. Grodensky CA, Golin CE, Ochtera RD, Turner BJ. Systematic review: effect of alcohol intake on adherence to outpatient medication regimens for chronic diseases. J Stud Alcohol Drugs 2012; 73: 899–910. [DOI] [PMC free article] [PubMed] [Google Scholar]
- 29. Ettehad D, Emdin CA, Kiran A, Anderson SG, Callender T, Emberson J, et al. Blood pressure lowering for prevention of cardiovascular disease and death: a systematic review and meta‐analysis. Lancet 2016; 387: 957–967. [DOI] [PubMed] [Google Scholar]
- 30. Ortegón M, Lim S, Chisholm D, Mendis S. Cost effectiveness of strategies to combat cardiovascular disease, diabetes, and tobacco use in sub‐Saharan Africa and South East Asia: mathematical modelling study. BMJ 2012; 344: e607. [DOI] [PMC free article] [PubMed] [Google Scholar]
- 31. Osterberg L, Blaschke T. Adherence to medication. N Engl J Med 2005; 353: 487–497. [DOI] [PubMed] [Google Scholar]
- 32. World Health Organization . Global health workforce shortage to reach 12.9 million in coming decades [online]. Available at http://www.who.int/mediacentre/news/releases/2013/health‐workforce‐shortage/en (last accessed 24 February 2016).
- 33. Mancia G, Fagard R, Narkiewicz K, Redon J, Zanchetti A, Böhm M, et al. 2013 ESH/ESC guidelines for the Management of Arterial Hypertension: the task force for the management of arterial hypertension of the European Society of Hypertension (ESH) and of the European Society of Cardiology (ESC). Blood Press 2013; 22: 193–278. [DOI] [PubMed] [Google Scholar]
- 34. Chiolero A, Burnier M, Santschi V. Improving treatment satisfaction to increase adherence. J Hum Hypertens 2016; 30: 295–296. [DOI] [PubMed] [Google Scholar]
- 35. Oliveira‐Filho AD, Barreto‐Filho JA, Neves SJ, Lyra Junior DP. Association between the 8‐item Morisky medication adherence scale (MMAS‐8) and blood pressure control. Arq Bras Cardiol 2012; 99: 649–658. [DOI] [PubMed] [Google Scholar]
- 36. Asgedom SW, Gudina EK, Desse TA. Assessment of blood pressure control among hypertensive patients in Southwest Ethiopia. PLoS One 2016; 11: e0166432. [DOI] [PMC free article] [PubMed] [Google Scholar]
Associated Data
This section collects any data citations, data availability statements, or supplementary materials included in this article.
Supplementary Materials
Table S1 Number of adverse drug events per patient
Table S2 Type of adverse drug events per patient (n = 421)