

SUMMARY
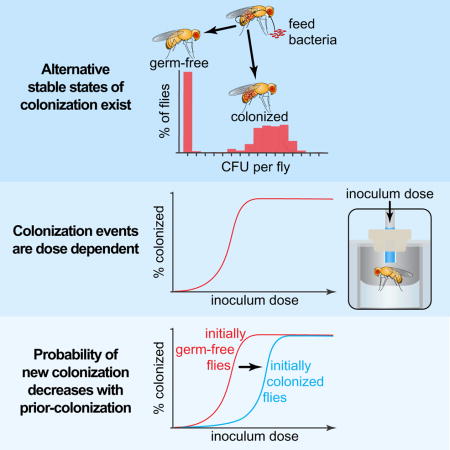
Species compositions of gut microbiomes impact host health [1–3], but the processes determining these compositions are largely unknown. An unexplained observation is that gut species composition varies widely between individuals but is largely stable over time within individuals [4, 5]. Stochastic factors during establishment may drive these alternative stable states (colonized versus non-colonized) [6, 7], which can influence susceptibility to pathogens such as Clostridium difficile. Here we sought to quantify and model the dose-response, dynamics, and stability of bacterial colonization in the fruit fly (Drosophila melanogaster) gut. Our precise, high-throughput technique revealed stable between-host variation in colonization when individual germ-free flies were fed their own natural commensals (including the probiotic Lactobacillus plantarum). Some flies were colonized while others remained germ-free even at extremely high bacterial doses. Thus, alternative stable states of colonization exist even in this low complexity model of host-microbe interactions. These alternative states are driven by a fundamental asymmetry between the inoculum population and the stably colonized population that is mediated by spatial localization and a population bottleneck, which makes stochastic effects important by lowering the effective population size. Prior colonization with other bacteria reduced the chances of subsequent colonization, thus increasing the stability of higher diversity guts. Therefore, stable gut diversity may be driven by inherently stochastic processes, which has important implications for combatting infectious diseases and for stably establishing probiotics in the gut.
eTOC Blurb
Obadia et al. show how natural gut commensal bacteria colonize their host. Using Drosophila as a model, they find that stochastic colonization produces stable host-to-host variation in species diversity. The results suggest strategies to engineer microbiome diversity.
RESULTS
Precise Oral Inoculation of Individuals Reveals that Colonization Is Probabilistic
To examine how bacteria are naturally transmitted to flies, we exposed isogenic populations of germ-free flies to two different concentrations of 16 fly commensal bacteria (representing 12 species), and we measured colonization success (the establishment of bacteria in the gut). Somewhat surprisingly, we observed variable colonization efficiencies, even between strains of the same species (Figure S1A). In accordance with the dose-response relationship of pathogen infection [8], bacteria colonized more effectively at higher doses. However, some strains colonized with high efficiency even at low doses, while others never reached high efficiency regardless of the dose. Our initial technique was limited in that individual flies could experience different doses of bacteria by eating different amounts of food.
Thus, we adapted the capillary feeder (CAFE) assay [9] to feed precise doses of bacteria to many individual germ-free flies (Figure 1A), and we measured dose-response relationships of Lactobacillus plantarum, a natural probiotic of humans and flies [10, 11]. We focused on three different isolates coming from a wild fly (WF), our Canton-S lab flies (CS), and the human gastrointestinal tract (HS). These isolates showed differences in both the minimal dose necessary for colonization and the stable population size in the gut (the carrying capacity) (Figure S1B–D). Even when fed ~10 colony forming units (CFUs), 100% of the flies were colonized by WF, making it a strong colonizer (Figures 1B and S1B). In contrast, even when fed millions of bacteria, CS and HS colonized 70% and 50% of the flies respectively, indicating that colonization can be probabilistic even at high inoculum (Figures 1B and S1C,D).
Figure 1. Colonization Is a Probabilistic Event Generating Two Stable States Over Time.

(A) Schematic of the capillary feeding microplate used to feed precise doses of bacteria to individual flies. Flies were maintained with sterile agarose for hydration.
(B) Colonization efficiencies three days after feeding germ-free Canton-S flies with Lactobacillus plantarum WF (n = 113 flies), CS (n = 238 flies), or HS (n = 521 flies). Data points represent means of groups of flies from at least three independent experiments. Solid lines are fits of the lottery model to the data (STAR METHODS). Error bars indicate S.E.P. See also Figure S1B-D.
(C) Probability that initial colonization was maintained for WF (n = 159 flies), CS (n = 142 flies), and HS (n = 131 flies). Germ-free Canton-S flies were fed once on day 0 with 1.5×10⁶, 2.5×10⁶, or 3.5×10⁶ CFUs of WF, CS, or HS respectively and individual flies were sampled over 20 days. See also Figure S1K–P.
(D–E) Frequency distributions of the bacterial loads of WF, CS, and HS in individual flies during (D) days 1 to 5 days after feeding and (E) the steady state of colonization (10 to 20 days after feeding). Mean bacterial loads in colonized flies at steady state were 1.1×10⁵, 6.1×10⁴, and 3.1×10⁴ CFUs per fly for WF, CS, and HS, respectively. Error bars indicate S.E.P. See also Figure S1K–M.
Host-to-Host Variation Does Not Explain the Weak Colonization Phenotype
To explain this large variability in colonization, we hypothesized that certain individual flies may be colonization-resistant and thus that they would remain germ-free on subsequent inoculation. We inoculated individual flies with ~1×10⁶ CFUs of HS, and collected flies that shed no bacteria in their frass on day 3. Upon re-inoculation with the same dose, 5 of 7 such flies were colonized, suggesting that the flies that were not infected the first time are not inherently colonization-resistant (Figure S1E). We then hypothesized that between-fly variation could be dynamic: a fly uncolonizable one week could be colonizable the next week. We thus reduced the time interval between inoculations to one day. A population of flies inoculated with two doses of bacteria with a colonization efficiency of nearly 50% per dose should be approximately 75% colonized, which is what we observed with HS (Figure S1F), strongly suggesting that low colonization efficiency is not due to host-to-host variation.
To determine whether the colonization patterns were specific to the host genetic background, we tested the three Lactobacilli in w1118 flies. Overall, the same colonization patterns as in Canton-S flies were apparent in w1118, with WF colonizing strongly and CS and HS colonizing weakly (Figure S1H–J). However, w1118 flies were overall less colonized than Canton-S flies, which indicates a decreased per-cell probability of colonization tied to the host genetic background that is not bacterial strain-specific.
Colonization Is Stable Even in Weak Colonizers
We next hypothesized that weak colonization arises from inherently unstable populations of weak colonizers [12, 13]. Thus, we measured colonization over time, expecting that flies with weak colonizer strains would steadily lose bacteria and become germ-free. We fed hundreds of flies individually a high dose of bacteria (>106 CFUs) and measured the bacterial load in individuals sampled across the population over time. In contrast to our expectation, the proportion of flies colonized after 3 days was the same as after 20 days (regardless of the bacterial strain) (Figures 1C–E and S1K–M), indicating that colonization is stable even in weak colonizers (CS and HS). An initial reduction in bacterial load occurred in these two weak colonizers and was highly variable between flies (Figures 1D and S1L, M), suggesting that this reduction was due to stochastic fluctuations when the population size was small [14]. During the 1–5 days after feeding, colonization by CS and HS varied from ~101 to ~104 CFUs per fly (Figures 1D and S1L, M). This variation declined by day 10, at which point the colonized flies harbored ~104 CFUs (Figures 1E and S1L, M). Notably, the proportion of flies that remained germ-free did not vary significantly over this period (Figure 1C–E). Thus, the variation in microbiota composition was transient and not indicative of permanently unstable colonization [12]. The drop in bacterial load of CS and HS over the first four days suggests a fundamental asymmetry between the inoculum population and the stable population that occupies the gut after establishment.
Growth-Rate Measurements in the Gut Suggest a Population Bottleneck
Differences in colonization efficiency could be caused by different growth rates. We measured bacterial growth rates in the fly gut by quantifying rates of plasmid loss [15], as bacteria stochastically lose plasmids due to unequal segregation during division (Figure 2A,B). We measured the plasmid loss of each bacterial strain in the fly gut to determine whether differences in colonization were due to differences in growth rate (Figure 2C–E). Overall, the growth rates during colonization were in the range of the rates in rich medium (~7 generations per day in vitro, Figure 2B). The three bacterial strains displayed similar growth rates at steady state in flies (Figure S1N–P), with the exception that the CS rate was lower than the WF rate (3 vs. 5 generations per day, p-value < 0.0001), consistent with in vitro culture (Figure 2B inset).
Figure 2. Bacterial growth rates in the fly gut reveal a colonization bottleneck.

(A) Plasmids lacking segregation machinery, when grown off selective medium, are lost stochastically so that the number of cell division cycles (or bacterial generations, g) can be estimated from the proportion of cells in the population that have retained the plasmid.
(B) In vitro standard curves quantifying the proportions of plasmid-containing bacteria (expressing mCherry) as a function of generations. Data points represent means of triplicates ± S.D. The ultrasensitive standard curve of CS limits our ability to detect growth until 50 generations have occurred. (B, inset) CS grows more slowly than WF and HS in vitro.
(C–E) Estimated growth rates as a function of inoculum dose of WF, CS, or HS in colonized Canton-S flies. See also Figure 1B.
(F–H) Frequency distribution of the growth rates of WF, CS, and HS in mono-colonized Canton-S flies. See also Figure S1 and Table S2.
Notably, the growth rates of all strains were higher for small invading populations (see low inoculum doses in Figure 2C–E), which indicates density-dependent growth. However, the average growth rates appear high for large inoculum doses for the weak colonizers only (Figure 2D,E), and this suggests that these bacteria experience a bottleneck, which was also apparent in the time course (Figures 1C and S1L, M). Bottlenecks reflect a reduced population size [7], thus requiring more growth to reach the carrying capacity. Variation in the bottleneck size is apparent between the strains with CS < HS < WF because more total growth is required for a small starting population to reach the carrying capacity (Figure 2C–H and S1N–P).
Each Colonizing Bacterial Cell Has an Equal and Independent Chance of Colonizing the Gut
Another factor that could explain the weak colonization phenotype is phase variation, an epigenetic, heritable trait whereby bacteria in a population show mixed phenotypes (e.g., ability to colonize). Because phase variation is heritable, cells expressing the colonization phenotype should have a higher likelihood of colonizing a subsequent fly. We tested this hypothesis by inoculating germ-free flies with a homogenate of flies successfully colonized with HS. We observed no significant increase in colonization efficiency (Figure S1G), indicating that heritable bacterial traits do not explain colonization differences.
Physicochemical Conditions of the Fly Gut Environment Do Not Explain Lactobacillus Colonization Differences
Low and high pH regions [16, 17], reactive oxygen species like H2O2 [18], and anaerobic conditions, which we detected in the fly gut (Figure S2) could affect microorganism growth. We found that all isolates had similar resistance to pH, anoxia, and H2O2 (Table S1). We observed differences in biofilm formation, but these differences did not explain differences in fly gut colonization.
Bacteria Employ Multiple Strategies for Stable Colonization in vivo
Because we observed similar in vivo growth rates for all three bacterial strains at steady state (Figure 2F–H), we hypothesized that the probability of population loss is higher for weak colonizers. Individuals are lost through both death and shedding. At steady state, growth balances losses (see STAR METHODS). We measured these rates in the fly and found that shedding rates were higher while death rates were lower in the weaker colonizers (CS and HS) than in WF (Table S2). However, the growth, death, and shedding rates were not equivalent for any of the strains, suggesting that the three strains employ distinct strategies to achieve stable colonization, potentially though differential resistance to host immunity. The result also suggests that WF, with its notably low shedding rate and high population size, may be able to attach within the gut. We therefore examined the spatial localization of the strains to determine the physical basis for resistance to shedding.
Spatial Structure of Gut Colonization Varies Between Lactobacillus Strains
We dissected and imaged strain localization in positively colonized flies five days after feeding (Figure 3). Overall, WF ranked higher in intensity than either CS or HS throughout the gut (p-value = 9.1405×10⁻⁵, n = 7 gut regions, z-test of proportion difference: 7/7 observed vs. 1/3 expected), in line with our previous results (Figure 1B). We observed significantly more colonization of the cardia by WF and CS than by HS (Figure 3B). The cardia is a gastric valve close to the mouth that regulates the passage of food from the esophagus and the storage sac (crop) into the midgut (Figure 3A). Interestingly, bacteria colonized the esophagus and cardia in a stereotypical spatial pattern (Figure 3C,D), suggesting that there may be specific and stable cell-attachment sites. None of the three strains were always excluded from the cardia in colonized flies, suggesting that they are all competent for making this stable attachment but that the chance of attachment is lower for the weaker colonizers (Figure 3B).
Figure 3. Microscopy Defines Spatial Colonization Differences.

(A) Representation of the digestive tract of Drosophila (after Miller [32]).
(B) Spatial colonization of gut regions of flies colonized with L. plantarum WF, CS, and HS 5 days after feeding. Positively colonized flies were dissected and gut regions were assayed for presence/absence, top bars, and relative colonization levels, bottom bars (error bars indicate S.E.P, top bars, and S.E.M., bottom bars). *p < 0.05, ***p < 0.001 by Student’s t-test (Bonferroni-corrected).
(C–F) Representative epifluorescence microscopy images of the spatial distribution of L. plantarum mCherry (red). DAPI staining (blue) indicates fly cells. (C–D) L. plantarum WF was concentrated and closely associated to the cardia as shown at 5 days after feeding. (E) L. plantarum HS was present in the lumen of the midgut one day after feeding. Malpighian tubules showed fluorescence but no individual bacterial cells suggesting accumulation of mCherry from lysed cells. (F) L. plantarum WF showed strong crop colonization 5 days after feeding. Background fluorescence due to many out of focus cells.
In contrast to the cardia, the crop and midgut contain relatively large populations, but they are luminally colonized without apparent direct attachment (Figure 3E,F); for example, in the midgut, the peritrophic matrix prevents bacteria from attaching to epithelial cells [19]. The lack of tissue attachment potentially makes these luminal populations less stable within the gut.
Starvation Destabilizes the Gut Microbiota
Stochastic dynamics rule when populations are below a critical threshold size [14, 20]. We wondered whether the colonization process is fundamentally different from maintenance of colonization or whether population size solely governs the stability of colonization. We hypothesized that weak colonizers are more susceptible to perturbations than strong colonizers. To perturb the stability of the microbiota, we starved gnotobiotic flies for 16 to 24 h [12, 13]. Starvation significantly decreased fly bacterial loads in HS and WF flies as well as conventionally reared flies. Starvation also increased the between-fly variation in conventionally reared and HS-associated flies (p-value < 0.01 for both strains), but it decreased variation in WF flies (p-value = 6×10⁻⁸) (Figure 4A), consistent with decreased stability of smaller populations in conventionally reared and HS-associated flies but not in WF-associated flies. Therefore, this perturbation suggests that the variation in colonization we observed for CS and HS (Figure S1C,D and L,M) may be due to an increased influence of stochastic factors when population numbers are low, but the lack of variation for WF colonization (Figure S1B,K) may be due to deterministic tissue attachment. The perturbation increases variation in population size, indicating destabilization.
Figure 4. Competition Drives Stability in the Fly Gut Microbiome.

(A) Starvation for 16 to 24 h reduced gut bacterial populations in conventionally reared flies and in WF- or HS-associated flies. Starvation also increased the between-fly variation in conventionally reared and HS-associated flies. Boxes represent the 25th and the 75th percentiles with the median; whiskers represent the range. **p < 0.01, ***p < 0.001, unpaired Welch’s t-test of log-transformed data (Bonferroni-corrected).
(B) HS had a reduced per-cell colonization probability in conventionally reared flies (n = 313 flies; p = 2.6×10⁻⁶; N = 4.9×10⁵), but WF colonization did not change in conventionally reared flies (n = 37 flies). Solid lines are fits of equation (1) to the data in conventionally reared flies.
(C) WF pre-colonization reduced subsequent colonization while HS pre-colonization had no effect on subsequent colonization. Canton-S flies were pre-colonized with WF (circles) or HS (diamonds), then inoculated with a low or a high dose of tagged WF (orange) or tagged HS (purple).
In (B and C), as a point of reference, dashed lines indicate equation 1 fits for germ-free flies shown in Figure 1B. In (B and C), error bars indicate S.E.P. *p < 0.05, **p < 0.01, z-test. LOD = limit of detection.
(D) A lottery model with a bottleneck effect predicts dose-dependent colonization efficiency (equation 1; see also STAR METHODS).
Strong Colonizers Outcompete Weak Colonizers
Prior occupancy by other species is known to affect ecosystem colonization: prior occupant bacteria (residents) can exclude later arriving species (invaders) or, conversely, residents can make the habitat more suitable [21–23]. To quantify this effect, we set up dose-response experiments for WF and HS inoculated into conventionally reared flies. We observed a rightward shift in the dose-response curve for HS while WF was unaffected (Figure 4B), indicating the per-cell colonization probability decreased for HS but not for WF. This shift suggests that competitive exclusion restricts colonization by weak colonizers.
We then asked whether the presence of one strain of Lactobacillus plantarum impacts the others. We produced gnotobiotic flies stably colonized with either WF or HS (both untagged) and then measured the dose the other strain (tagged) needed to colonize. We observed a dominance hierarchy, with WF outcompeting HS (Figure 4C). Interestingly, WF pre-colonization reduces its own secondary colonization in apparent competitive exclusion, while HS pre-colonization has no effect on secondary WF colonization (Figure 4C), consistent with our spatial occupancy results that WF occupies the fly gut in a fundamentally different way from HS (Figure 3B).
In the context of the per-cell colonization and bottleneck parameters, the influence of other strains may be to reduce the number of available sites for stable adhesion and/or to reduce the overall amount of viable habitat, decreasing the bottleneck size. These competition experiments suggest that reduction of the per-cell colonization chance through the number of adhesion sites (shifting the dose-response rightward) likely plays a larger role than decreasing the bottleneck size (shifting the dose-response downward). In fact, the dose-response of HS fed into conventionally reared flies additionally shows an upward shift (Figure 4B), indicating an increase in habitat (possibly due to positive interactions with Acetobacter spp.) despite the loss of adhesion sites.
DISCUSSION
Fruit Flies Are Stably Associated with their Microbiota
Recent studies suggest that Drosophila may not be stably colonized by their commensal bacteria [12, 13]. Here we show that many strains of different species can maintain a stable association with the fly gut under laboratory conditions.
Comparing different bacterial isolates from Drosophila suggests that bacteria from wild flies colonize better than bacteria from lab flies (strains with >90% maximum colonization: 5 of 6 wild fly strains; 4 of 10 lab fly strains; P < 0.05, two-proportion z-test; Figure S1A). Wild bacteria may utilize the fly both as a stable habitat as well as a vector to find new food sources whereas bacteria living in a fly vial have a stable source of fly food as habitat and require the fly as a vector only during infrequent transfers to new vials. Because the food population is much larger than the gut population, evolution in the lab should favor faster growth on the fly food, which could allow weak intestinal colonizers to persist.
There Is More Than One Way to Stably Colonize a Fruit Fly Gut
Stable population maintenance results from the balance between bacterial growth in the gut and bacterial loss from the gut. Therefore, a strain can use several strategies to stably establish and persist, (i) high growth rate, (ii) low death rate, (iii) low defecation rate, (iv) high carrying capacity, or (v) a combination. While WF appears to use stable host tissue association to lower the shedding rate, it also has a high death rate. In contrast, CS has a high defecation rate but a low death rate to offset (Table S2). The three Lactobacillus plantarum strains use different strategies to persist in the gut (Figure S1K–M).
Population Bottlenecks Can Make Species Invasions Probabilistic
Habitats face a constant influx of new species [24], however, not every new species introduction results in an invasion. While successful invasions are often attributed to fitness and niche differences [25], unsuccessful invasions are additionally attributed to temporal and spatial environmental variation [26] and probabilistic establishment [14, 20, 27]. Thus, the success of an invasion depends upon the invader, the environment, and chance.
Here we have shown that intrinsic population bottlenecks in the fruit fly gut can make invasions both dose dependent and probabilistic and thus unpredictable at the individual host level. Vega and Gore [28] recently demonstrated that stochastic events drive heterogeneous assembly of a mock community of red and green-labeled Escherichia coli in the Caenorhabditis elegans gut. Our results corroborate their intriguing findings and show that the phenomenon occurs for colonization by natural commensal bacteria in the fly gut. Additionally, we show that a combination of stochastic colonization and bottlenecks introduce hysteresis to the colonization process, whereby a colonized host may stay stably colonized without new inoculation, or conversely, after an extinction, reintroduction may be difficult. Our results demonstrate that bacterial strain-intrinsic traits, prior presence of other strains, strain dosage, and host genetics all contribute to this hysteresis. Importantly, a similar probabilistic hysteresis could account for the observed long-term individual stability and high inter-individual variation of human gut microbiomes [4, 5].
A Lottery Model Describes the Dose-Response Relationship
Theory from island colonization [14] and quantitative microbial risk assessment [8] describe a probabilistic framework for understanding colonization, where each colonizing individual has an equal chance of establishing (or infecting). We modify this framework to account for bottlenecks where the probability of colonization for an individual fly fed an individual dose of N bacteria is
| (1) |
where p is the per-cell chance of colonizing, KB is the bottleneck size, b is a constant that reflects binding to stable habitat and how the inoculum dose reaches this habitat, and tex is the time for the inoculum dose to pass through the fly, which can vary by bacterial strain and fly (Figure 4D) (derivation of equation 1 in STAR METHODS). Thus, colonization of the host gut can be limited both by exposure to colonists (determined by both the dose and residence time) as well as by fly and bacterial traits. We used fits of the model to estimate the per-cell probability of colonization (WF: 0.16; CS: 0.019; HS: 6×10⁻⁵; Figure 1B).
The Gut Metapopulation May Be Stabilized by Varying Regional Critical density
In a stochastic Allee effect, populations below a critical density have uncertain survival outcomes [14, 20]. In the case of the fly gut for CS and HS, a bottleneck reduces the colonizing population below the critical density, thereby ensuring that survival outcomes are always probabilistic regardless of the inoculum size. However, our findings are consistent with different subregions of the fly gut having different critical densities (e.g., stable cardia colonization may be more likely than midgut lumen colonization, which can be shed more easily despite being a larger habitat). We hypothesize that once the cardia is colonized, it can serve as an inoculum source for future colonization of downstream gut regions (see derivation in STAR METHODS, Lumen Population Stability). In this regard, the fly gut, small as it is, may be best conceptualized as a metapopulation comprising many different subregions (Figure 3A,B).
Niche and Neutral Processes Influence Colonization
Both stochastic (neutral) and deterministic (niche) processes shape species diversity in macroecosystems [29, 30]. Stochastic gut colonization is consistent with neutral processes driving random species assemblage, but the distinct spatial colonization patterns observed, such as WF cardia colonization (Figure 3C,D), suggest niche processes at work as well. Here we see that stably colonizing a distinct spatial region of the gut is still a stochastic process, making niche and neutral processes interdependent.
We expected that strain-specific niche differences would arise from biochemical traits affecting growth rate, however, we found little evidence for differences in strain physiology (Table S1). Instead, our results suggest that the ability of WF to stably attach to host tissue near the anterior end of the gut may overcome stochastic population dynamics and make colonization deterministic even at extremely low inoculum (Figure 1B). Thus, as in macroecology, niche processes can overcome neutrality, particularly at local scales [31].
Implications for Health
Changing the composition of the human gut in a precise way has proved difficult in practice. Fecal transplants, whereby an entirely new community of bacteria is introduced to a gut are effective but imprecise. Introducing specific, engineered probiotic bacteria to the human gut has the potential to revolutionize therapeutics, but establishing these strains requires precision understanding of the factors that govern commensal colonization. The present study shows how stochastic colonization dynamics and interactions with past colonizers influence colonization. The results suggest that colonization can be improved with higher doses over longer time periods and perturbations to the resident gut community.
STAR★METHODS
CONTACT FOR REAGENT AND RESOURCE SHARING
Further information and requests for reagents may be directed to, and will be fulfilled by the corresponding author William B. Ludington (will.ludington@berkeley.edu).
EXPERIMENTAL MODEL AND SUBJECT DETAILS
Fly Stocks and Husbandry
Drosophila melanogaster Canton-S (BL64349) and w1118 (BL5905) strains were obtained from the Bloomington Drosophila Stock Center. Flies were reared and maintained at 25°C with 60% humidity and 12 h light/dark cycles on a sterile glucose–yeast medium (10% glucose, 5% active dry yeast, 1.2% agar, 0.42% propionic acid). Stocks were cured from Wolbachia by raising flies for five generations on yeast-glucose medium containing 50 g/mL tetracycline as previously described [36], and they were continuously monitored for Wolbachia by PCR. Germ-free flies were generated by sterilizing dechorionated embryos. Mated female flies were left to oviposit for up to 8 h on grape juice–yeast medium (20% organic grape juice, 10% active dry yeast, 5% glucose, 3% agar), embryos were then harvested and successively transferred twice in 0.6% sodium hypochlorite for 2.5 min each, once in 70% ethanol for 30 s, and three times in sterile water for 10 s each. Germ-free stocks were kept for several generations and flies were regularly checked for the presence of yeasts, bacteria, and known viruses either by PCR (see below) or by plating undiluted homogenized flies onto MRS and YPD media. All manipulations of flies were performed in a laminar flow cabinet using aseptic technique. For inoculation experiments, at least three vials of ~100 flies of mixed gender were mixed to minimize any effects of an individual fly vial. Mated 5 to 7 day old females were used in all experiments unless otherwise noted. Flies that died before the time of measurement were excluded from analyses.
Bacterial Strains and Culturing Conditions
We isolated Lactobacillus plantarum WF from a single female Drosophila melanogaster caught in the Mission District of San Francisco, California, USA, in September 2015. We isolated Lactobacillus plantarum CS from our Canton-S lab flies. Lactobacillus plantarum HS (strain WCFS1) was isolated from human saliva [37]. All strains were stored at −80°C in MRS broth containing 20% glycerol. The plasmid pCD256-mCherry was kindly provided by Stefan Heinl and Reingard Grabherr from the University of Natural Resources and Life Sciences (BOKU) in Vienna, Austria. This plasmid was slightly modified by incorporating two restriction sites (NheI and SpeI), generating pCD256NS-mCherry, which facilitate the high-yield production of pCD256-mCherry-ΔEc, which does not contain the origin of replication and the selection marker for Escherichia coli. Lactobacillus plantarum strains WF, CS, and HS were electroporated with pCD256-mCherry-ΔEc (low copy) as described previously [35]. Transformed bacteria were grown with MRS media containing 10 μg/mL chloramphenicol unless otherwise stated. To prepare bacteria for feeding experiments, strains were streaked onto MRS-agar and incubated at 30°C for up to 48 h. Single colonies were used to inoculate MRS broth and incubated at 30°C for 16 h at 200 rpm. Bacteria were washed and suspended in STE buffer (6.7% sucrose, 50 mM Tris pH8, 1 mM EDTA) after centrifugation at 4°C for 10 min at 3,000 rpm to remove antibiotics. To estimate the concentration of bacteria to be fed, we followed the equivalence O.D.660 = 1.8×10⁸ CFUs/mL (for WF and CS) or 5×10⁸ CFUs/mL (for HS). Precise concentrations of bacteria fed were calculated a posteriori by plating and counting CFUs on MRS-agar plates.
METHOD DETAILS
Probability of Colonization of Fly Bacteria
For the initial survey of common bacterial strains (Figure S1A), groups of 12 germ-free Canton-S female flies per vial were fed for 8 h a low or a high dose of bacterial suspension (50 μL) that was spread directly onto sterile, solid food. After feeding, flies were transferred daily to fresh, sterile medium for 3 subsequent days before colonization was assayed. Single flies were surface-sterilized by washing them in six successive baths of 70% ethanol and rinsing them in six successive baths of sterile PBS, and then homogenized by bead beating for 1 min in a sealed 96-well PCR plate, each well containing 75 μL 0.5-mm sterile glass beads and 100 μL sterile PBS. The presence/absence of bacteria was monitored by pinning the 96 individual wells using a 96-pin microplate replicator. The inoculum density was determined by plating onto MRS-agar.
Capillary Feeder Assays
The capillary feeder (CAFE) assay was previously described [9] and was adapted for a higher throughput. Briefly, each well of a sterile 96-well tissue culture microplate was filled with 50 μL 1.2% sterile agarose. A 96-well PCR plate, cut at ~5 mm from the bottom to open individual wells, was paired and sealed to the tissue culture plate with parafilm. Flies were CO2-anesthetized and carefully placed individually into wells before individual sterile silicone gaskets were used to seal each well. The gaskets were used to hold autoclaved borosilicate glass capillaries, which were filled with 1.5 μL of bacterial suspension (in 10% (w/v) sucrose plus 0.1% (w/v) blue food coloring) forced down by 12 μL mineral oil mix (mineral oil:dodecane 3:1 (v/v)) and gravity. Flies were starved overnight (12 h) in fly vials containing 1.2% sterile agarose prior to be placed in CAFE plates.
Bacterial Load of Individual Flies
Flies were individually surface-sterilized by washing them in six successive baths of 70% ethanol and rinsing them in six successive baths of sterile PBS. Single flies were homogenized in sterile 1.5-mL micro-centrifuge tubes containing sterile PBS using a motorized pestle pellet. The supernatants were serially diluted in sterile PBS, plated onto MRS–agar medium, and bacteria were allowed to grow at 30°C for up to 48 h before counting single colonies (using fluorescent illumination to determine the presence or absence of pCD256-mCherry-ΔEc).
Calculation of Growth, Shedding, and Death Rates
Groups of flies stably mono-associated with their respective bacterial strain (Lactobacillus plantarum WF, CS, or HS) were transferred from their rearing vials into sterile vials (6 replicate vials of 12 flies per vial for each bacterial strain). After 24 h, flies were removed and their frass, deposited on the sidewalls and food of the vials, was collected using 1 mL of sterile PBS and a sterile cotton swab. Dilutions of the collected frass were plated onto MRS-agar medium, and bacteria were allowed to grow at 30°C for up to 48 h before CFUs were counted. To model the bacterial population dynamics, we assumed a minimal model, Ṅ = gN − sN − dN, where Ṅ is the population change rate, N is the population size, g is the population growth rate constant, s is the population shedding rate constant, and d is the population death rate constant. At steady state, the population size is N*, and gN* − sN* − dN* = 0, so that growth balances shedding and death. Thus, g = s + d at steady state.
We then calculated s by the number of shed CFUs per fly divided by the steady state bacterial population size, N*, which we measured by crushing and plating the flies in the experiment. Using s and g measured in vivo (Figure S1N–P), we calculated the death rate (d) as the resultant of the growth rate minus the shedding rate.
Imaging and Quantification of Spatial Colonization
Fly guts were dissected in PBS and fixed for 2 h at room temperature in 4% paraformaldehyde. Whole guts were rinsed three times in PBST (PBS/0.1% Triton X-100), and DAPI dilactate (1 μg/mL) was added for 5 min to the final wash. Guts were then equilibrated for 30 min in PBS containing 50% glycerol before being mounted in 80% glycerol with 4% (w/v) propyl gallate, and imaged with a Zeiss Axio Imager 2 epifluorescence microscope. Compartmentalization of the anterior, middle, and posterior midgut followed the regions R1–R2, R3, and R4–R5 respectively, as previously described[38]. Intensity of colonization was assessed by visually estimating the quantity of bacteria in each compartment on a scale from 0 to 3, with 0 = no bacteria, 1 = 10 bacteria, 2 = between 10 and 100 bacteria, and 3 = more than 100 bacteria.
Oxygen Measurements
Individual flies were individually surface-sterilized by immersion in 70% ethanol, followed by a wash in sterile PBS. Flies were dissected in PBS where the whole gut was removed, stretched out, and embedded into 1% low melting point agarose in insect Ringer’s solution (111 mM NaCl, 3.3 mM KCl, 4.5 mM CaCl2, 2.8 mM Na2CO3). Oxygen levels were recorded within 10 min using Clark-type oxygen microelectrodes (OX-25; Unisense, Aarhus N, Denmark) as described previously [39]. Microelectrodes were positioned using a motorized micromanipulator (MXU2; PyroScience, Aachen, Germany). Measurements were performed radially starting at the surface of the gut wall (0 μm) through the fly gut until the tip completely penetrated the whole tissue. The progress of the tip was followed with a digital microscope connected to a computer.
Hydrogen Peroxide Toxicity Assays
Lactobacillus plantarum strains WF, CS, and HS were subject to different concentrations of H2O2 during growth in 96-well plates. Overnight cultures were diluted to O.D.600 of 0.05 in APT broth. H2O2 was added at the beginning of growth at the following final concentrations of 0 mM, 0.34 mM, 0.68 mM, 1.37 mM, 2.75 mM, 5.5 mM, 11 mM, or 88 mM. Turbidity was monitored every 15 min for 24 h on a microplate reader.
Anaerobic Growth Assays
Lactobacillus plantarum strains WF, CS, and HS were inoculated from fresh plates in 10 mL MRS broth in test tubes and incubated overnight in an anaerobic chamber. Overnight cultures were diluted to O.D.600 of 0.05 in anaerobic MRS broth. Turbidity was monitored in the anaerobic chamber during 6 h after inoculation, and doubling times were calculated, which were equivalent for the 3 strains (1.1 h−1).
Biofilm Assays
Lactobacillus plantarum strains WF, CS, and HS biofilm formation was examined in 96-well plates. Overnight cultures were diluted to O.D.600 of 0.05 in 200 μL MRS broth per well. 96-well plates were incubated statically at room temperature for 24 h, 48 h, and 72 h. Surface attachment was quantified by the Crystal violet staining method. Briefly, after the specified times, culture supernatants were discarded and wells were washed 3 times with 250 μL of PBS to remove unattached bacteria. To stain surface-attached bacteria, 200 μL of 0.1% Crystal violet solution was added to each well. After 30 min incubation in the dark, the solution was removed and wells were washed by submerging plates in water. Stained bacteria were solubilized with 200 μL of 33 % acetic acid solution and absorbance was determined at O.D.595.
Nucleic Acids Amplification and Sequencing
Germ-free flies were tested for the presence of microorganisms (bacteria including Wolbachia, yeast/fungi) by PCR and common RNA viruses (Drosophila A, C, and X viruses, Sigma virus) by RT-PCR. The mitochondrial Cytochrome c oxydase subunit II gene (mt:CoII, CG34069) was sequenced to identify wild caught Drosophila. The 16S rDNA region of bacteria was sequenced to identify all strains. See Table S3 for the list of oligonucleotides.
Replication
Fly experiments involving colonization by CFU counts were performed on at least three different days and the data was aggregated. On each day, at least 10 flies were assayed for each treatment (Figures 1, 2, 4, and S1).
Fly experiments involving microscopy were performed on flies collected from at least 3 separate days. At least 11 flies total per bacterial strain were surveyed for spatial colonization (Figure 3).
Experiments on in vitro bacterial growth were performed on two separate days with at least 3 replicates per bacterial strain per treatment (Figures 2B and Table S1).
Experiments to quantify oxygen gradients in the fly gut were performed on one day with five replicate guts. The crop was measured for each gut. The anterior midgut was measured for four guts. The posterior midgut was measured for three guts. The hindgut was measured for the same three guts (Figure S2).
Strategy for Randomization and/or Stratification
Strains were assayed in different orders on different days.
Blinding
No blinding was undertaken.
Sample Size Estimation and Statistical Method of Computation
Sample size was directly measured.
Exclusion Criteria of Data
Two fly colonization experiments were excluded. One was excluded because MRS plates were contaminated with an unidentified yeast. The other was excluded because colony growth was severely impeded due to caramelization of the glucose present in the media during autoclave.
QUANTIFICATION AND STATISTICAL ANALYSIS
Sample Sizes
Sample sizes for all experiments can be found in the accompanying results sections and Figure legends.
Tests of Normality
Where t-tests were used, we ensured that the number of observations for each sample was greater than 10 (because given this sufficiently large sample size, t-tests are robust to non-normality, due to the Central Limit Theorem). Where z-tests were used, we checked that the samples met the criterion of normality by checking that np0 ≥ 10 and n(1−p0) ≥ 10, where n is the sample size and p0 is the population proportion.
Colonization Model Derivation
The purposes of this Model Derivation sub-section are (i) to derive equation 1 presented in the main text and (ii) to support the conclusions of the paper with explicit models regarding the colonization bottleneck and the lumen population stability. Overall, the model describes how an input dose of bacteria leads to colonization. We break the colonization process into three parts, (i) the input inoculum dose and its decay, (ii) the spatial habitat that defines the bottleneck population, and (iii) the stable colonization.
The assumptions for the model come both from the empirical data presented in the main text and from basic theory that has been applied in the fields of ecology and microbiomes (Lotka-Volterra [40]), infectious disease (lottery model [8]), as well as chemistry (Langmuir binding kinetics [41]). Empirically, we have determined that permanent colonization is determined by probabilistic association with distinct spatial habitat and a colonization bottleneck (Figures 1–3). In this model, we propose a link between the colonization bottleneck and limiting physical space in the distinct spatial habitat (Figure 3). We propose that permanent physical association with host tissue is a two-step process, where the first step is the reversible binding to the bottleneck habitat and the second step is the irreversible binding to the bottleneck habitat. Thus, a change in the rate of association with the bottleneck habitat changes the overall chances of stable attachment. We use ordinary differential equations to model the subpopulations in the gut as a metapopulation. Next, we calculate the bottleneck sizes for the three Lactobacillus plantarum strains. Finally, we consider the lumen subpopulation within the gut and show that stochastic losses from the lumen can be offset by immigration from the stably colonized habitat.
The input inoculum dose and its decay
We want to calculate the number of bacteria that have a chance of colonizing the fly based on the input dose. The inoculum enters the proximal gut and passes into various distal regions, from which cells are excreted. In the simplest case, we model the changes in inoculum population in the proximal gut due to decay,
| (2) |
for N ≥ 0, where N is the inoculum population, d1 is the decay constant. Integrating equation 2, we have
| (3) |
and the total dose experienced by the fly is,
| (4) |
We call the extinction time tex, the total time that the inoculum population is above a threshold population size, Nmin, which is
| (5) |
Additional Considerations for the Inoculum
We present a minimal model here in order to capture the basic behavior of the system. In the derivation, we additionally considered several additional factors, including (i) shedding due to flow through the gut, (ii) the exchange of bacteria the inoculum population and the bottleneck population, and (iii) additional subpopulations, such as the crop, a side compartment of the gut that stores food for later passage into the proximal gut. While we these are all legitimate factors that impact colonization, we found that the minimal model presented here exhibits the complete range of behaviors that these additional factors emphasize. Thus, for clarity, we do not explicitly model the additional factors.
Spatial Habitat and the Population Bottleneck
A back of the envelope calculation suggests that the fly lumen, with a diameter of roughly 200 μm and a length of roughly 10,000 μm could hold on the order of 100 million bacterial cells. The crop, with a diameter of 1,000 μm could hold on the order of 1 billion bacterial cells. However, the restricted habitat of the bottleneck drastically reduces the effective dose of bacteria that have a chance of colonizing the gut.
Physically, the bottleneck is likely located at several host tissue patches. We observed bacterial cells stably associated with host tissue (i.e., not easily washed out) primarily in a region of the proximal gut known as the cardia, just distal to the connection of the crop with the esophagus. We suggest that bacteria which transiently bind this region of the gut can probabilistically become stable colonizers.
Conceptually, we think of this bottleneck as a separate subpopulation of bacteria that exchanges with the inoculum population in the proximal gut. Stable colonization can occur only by cells in this bottleneck population. Based on microscopy data (Figure 3), we propose that there is a physical limitation on how many cells can fit in the bottleneck. There are also rate-limiting steps of cell adhesion to the bottleneck, which could limit the number of inoculum cells that reach the bottleneck. Basing the derivation on standard Langmuir binding of free particles to open sites on a solid surface, we model the rate of change in the bottleneck population as
| (6) |
where Nmax is the maximum inoculum population, KB is the maximum occupancy of the bottleneck site, k1 is the binding rate of free bacteria to open sites in the bottleneck habitat, and k2 is the loss from the bottleneck site modeled as a decay rate times the number of bacteria in the bottleneck site, B. is thus the relative occupancy of the gut. KB − B is the number of available sites. The fraction of bacteria that are near the gut wall, which is proportional to the surface area to volume ratio (i.e., ), is a constant fraction for a given host genetic background, and we lump this constant into the binding constant, k1. Solving for the steady state bottleneck population,
| (7) |
which is in accord with Langmuir binding kinetics, with Keq = k1/k2. Substituting equation 3 for N(t), we have
| (8) |
Because we ultimately want to know how many chances of colonization there are for a given dose of bacteria, we integrate the bottleneck population over time. If we assume that the bottleneck population equilibrates faster with the inoculum than the inoculum population decays, we can integrate the steady state bottleneck (equation 7) on the interval [0, tex] to find the total chances of colonization for a given inoculation dose,
| (9) |
which quickly approaches its limit of KBtex as N0 increases, where tex is the characteristic time for the inoculum population to decay below a threshold.
This result tells us two things. First, the bottleneck constrains the chances of colonization so that increases in dose do not increase the chances of colonization. Second, the chances of colonization can be increased by increasing the time that a given dose stays in the gut (by increasing the characteristic decay time (1/d1)). For example, this time could be extended by storing the dose in the crop and slowly passing it into the distal gut. Consistent with this hypothesis, we observed higher crop occupancy in the stronger colonizer bacteria than in the weak colonizers (Figure 3).
For simplicity, we can approximate the total chances of colonization as
| (10) |
Simplifying further, we ignore the inoculum dynamics and approximate the inoculum population to be a fraction, a of the dose N0, which lets us write out
| (11) |
We then define and rewrite
| (12) |
This simple form gives the complete range of behaviors of the more explicit form of equation 9.
Stable Colonization of the Gut: A Lottery Model Describes the Dose-Response
Theory from island colonization and quantitative microbial risk assessment describes a framework for describing dose-dependent colonization[8]. The key feature we add to this established framework is an expression that accounts for bottlenecks, which limit the effective dose of cells.
We model stable colonization based on the lottery model from Quantitative Microbial Risk Assessment theory. This model for the chance of becoming ill with a pathogen postulates that each cell has an equal chance of infecting, thus the overall chance that a person becomes infected, P(n), is related to the number of cells ingested, n, and the per-cell probability of infecting, p, by the “lottery equation”,
| (13) |
which is based on the binomial probability mass function,
| (14) |
where k is the number of bacteria that must establish in order for the fly gut to be colonized. By setting k to 0, we determine the chance that the fly is not colonized by a given inoculation.
The per-cell colonization probability, p, could depend on many factors such as growth rate, death rate, and colonization factors. To relate p to bacterial functional traits, we turned to macroecology theory of small populations where stochastic factors dominate dynamics. Richter-Dyn & Goel [14] used a stochastic differential equation approach to derive the probability that a population starting at size n (0 < n < K) reaches K, the carrying capacity, before going extinct:
| (15) |
where λ is the probability that an individual is added to the population and μ the probability that an individual is lost. If we assume K ≫ λ/μ, the denominator approaches one [42]. Simplifying, the probability that a given dose, n, leads to stable colonization is
| (16) |
given that the carrying capacity is large and λ > μ. By inspection of eqns. 2 and 4, we can see that 1− p, the per cell chance that colonization does not occur, is equivalent to . Thus, colonization becomes more likely as the chance of growth exceeds the chance of death and the larger the bottleneck population, which is intuitive. This expression is similar to the chance of epidemic outbreak, 1− R0, where R0 is the ratio of the probabilities of death and transmission for an infection in an individual host. The bottleneck sets an upper limit on the chance of colonization and therefore impacts transmission dynamics.
Impact of the Bottleneck on the Chance of Colonization
Our primary goal in modeling the bacterial population dynamics in the gut is to determine the probability that a given inoculation produces a stably colonized fly. Using the lottery model, the two key factors that determine colonization are the per-cell chance of colonization, p, and the input dose of bacteria, N0. The bottleneck population limits the chances of colonization by reducing the effective dose. Thus, combining equations 12 and 13, we have
| (17) |
Thus, when N0 is large, the per-fly chance of colonization depends on the bottleneck size, the extinction time, and the per-cell chance of colonization. When N0 is small, the per-fly chances of colonization additionally depend on the equilibrium binding constant with the bottleneck.
Lumen Population Stability is Increased by Stable Cardia Colonization
The largest population we observed was in the lumen. When comparing lumen populations between bacterial strains, there was little variation in colonized flies (Figure 3). The major difference in lumen populations was presence/absence: lumens tend to be either well-colonized or completely uncolonized. Other papers have investigated similar model gut populations that can be transiently colonized by proposing either stochastic colonization or stochastic loss of individuals. We do not propose a new model here but instead add colonization to a general form of existing models, which is that stochastic population loss results in extinction. Here, we consider the lumen and proximal gut as a connected metapopulation, with the proximal gut supplying colonists to the lumen. We show that stable colonization in the proximal gut can maintain large populations in the lumen despite transient extinction. We use a simple Lotka-Volterra equation with a generic stochastic loss function ξ, which could for instance reflect shedding or immune activity, to model the lumen bacterial population. We additionally take into account seeding from the inoculum and the stable colonizer population to model the rate of lumen population change as
| (18) |
where L is the bacterial population in the lumen, λ is the probability of population increase, μ is the probability of population decrease, KL is the maximum sustainable lumen population (a.k.a. carrying capacity), s1N is immigration from the inoculum population, K1C is immigration from the stable colonizer population. At steady state for the lumen population, once the inoculum population has dissipated (N = 0), we have
| (19) |
Solving for L*, the lumen population size is
| (20) |
So, L* has real roots when , meaning that ξ < k1C, i.e. colonization must outweigh losses due to noise, which is intuitive.
Thus, stable colonization of the proximal gut can stabilize unstable lumen populations through metapopulation dynamics. Recolonization from the stable colonists, C, would serve to replenish the lumen population after a stochastic depletion event.
Supplementary Material
Highlights.
Establishment of commensal bacteria in the gut works like a lottery
Stochastic factors generate alternate stable states of gut colonization
Distinct spatial habitats within the gut regulate the maximal chance of colonization
Resident species reduce the odds of subsequent colonization, promoting stability
Acknowledgments
W.B.L. acknowledges NIH grant 1DP5OD017851 and the U.C. Berkeley M.C.B. Department Bowes Fellows Program. We thank Daniel A. Portnoy for insightful discussions, the Bilder and Hariharan laboratories for technical support, and Liam J. Holt, Michiko E. Taga, and James Angus Chandler for critical readings of the manuscript. We thank Elizabeth M. Mak for her pioneering work on the CAFE assay. Part of this work was performed at Lawrence Berkeley National Laboratory under U.S. Department of Energy Contract No. DE-AC02-05CH11231.
Footnotes
AUTHORS CONTRIBUTIONS
Conceptualization, B.O. and W.B.L.; Methodology, B.O. and W.B.L.; Investigation, B.O., Z.T.G., V.Z., J.A.C-N; Formal Analysis, B.O. and W.B.L.; Writing – Original Draft, B.O., Z.T.G., J.A.C-N., E.L.B., W.W.J. and W.B.L.; Writing – Review & Editing, B.O. and W.B.L.; Visualization, B.O. and W.B.L.; Funding Acquisition, W.B.L.; Resources, W.W.J. and W.B.L.; Supervision, W.B.L.
Publisher's Disclaimer: This is a PDF file of an unedited manuscript that has been accepted for publication. As a service to our customers we are providing this early version of the manuscript. The manuscript will undergo copyediting, typesetting, and review of the resulting proof before it is published in its final citable form. Please note that during the production process errors may be discovered which could affect the content, and all legal disclaimers that apply to the journal pertain.
References
- 1.Round JL, Mazmanian SK. The gut microbiota shapes intestinal immune responses during health and disease. Nat Rev Immunol. 2009;9:313–323. doi: 10.1038/nri2515. [DOI] [PMC free article] [PubMed] [Google Scholar]
- 2.Levy M, Kolodziejczyk AA, Thaiss CA, Elinav E. Dysbiosis and the immune system. Nat Rev Immunol. 2017;486:207. doi: 10.1038/nri.2017.7. [DOI] [PubMed] [Google Scholar]
- 3.Kang DW, Adams JB, Gregory AC, Borody T, Chittick L, Fasano A, Khoruts A, Geis E, Maldonado J, McDonough-Means S, et al. Microbiota Transfer Therapy alters gut ecosystem and improves gastrointestinal and autism symptoms: an open-label study. Microbiome. 2017 May 1;5:10. doi: 10.1186/s40168-016-0225-7. [DOI] [PMC free article] [PubMed] [Google Scholar]
- 4.Caporaso JG, Lauber CL, Costello EK, Berg-Lyons D, González A, Stombaugh J, Knights D, Gajer P, Ravel J, Fierer N, et al. Moving pictures of the human microbiome. Genome Biol. 2011;12:R50. doi: 10.1186/gb-2011-12-5-r50. [DOI] [PMC free article] [PubMed] [Google Scholar]
- 5.David LA, Materna AC, Friedman J, Campos-Baptista MI, Blackburn MC, Perrotta A, Erdman SE, Alm EJ. Host lifestyle affects human microbiota on daily timescales. Genome Biol. 2014;15:R89. doi: 10.1186/gb-2014-15-7-r89. [DOI] [PMC free article] [PubMed] [Google Scholar]
- 6.Stephens WZ, Wiles TJ, Martinez ES, Jemielita M, Burns AR, Parthasarathy R, Bohannan BJM, Guillemin K. Identification of Population Bottlenecks and Colonization Factors during Assembly of Bacterial Communities within the Zebrafish Intestine. mBio. 2015;6:e01163–15. doi: 10.1128/mBio.01163-15. [DOI] [PMC free article] [PubMed] [Google Scholar]
- 7.Abel S, Abel zur Wiesch P, Davis BM, Waldor MK. Analysis of Bottlenecks in Experimental Models of Infection. PLoS Pathog. 2015;11:e1004823. doi: 10.1371/journal.ppat.1004823. [DOI] [PMC free article] [PubMed] [Google Scholar]
- 8.Haas CN, Rose JB, Gerba CP. Quantitative Microbial Risk Assessment. John Wiley & Sons; 1999. [Google Scholar]
- 9.Ja WW, Carvalho GB, Mak EM, de la Rosa NN, Fang AY, Liong JC, Brummel T, Benzer S. Prandiology of Drosophila and the CAFE assay. Proceedings of the National Academy of Sciences. 2007;104:8253–8256. doi: 10.1073/pnas.0702726104. [DOI] [PMC free article] [PubMed] [Google Scholar]
- 10.Storelli G, Defaye A, Erkosar B, Hols P, Royet J, Leulier F. Lactobacillus plantarum Promotes Drosophila Systemic Growth by Modulating Hormonal Signals through TOR-Dependent Nutrient Sensing. Cell Metabolism. 2011;14:403–414. doi: 10.1016/j.cmet.2011.07.012. [DOI] [PubMed] [Google Scholar]
- 11.Jones RM, Desai C, Darby TM, Luo L, Wolfarth AA, Scharer CD, Ardita CS, Reedy AR, Keebaugh ES, Neish AS. Lactobacilli Modulate Epithelial Cytoprotection through the Nrf2 Pathway. CellReports. 2015;12:1217–1225. doi: 10.1016/j.celrep.2015.07.042. [DOI] [PMC free article] [PubMed] [Google Scholar]
- 12.Blum JE, Fischer CN, Miles J, Handelsman J. Frequent Replenishment Sustains the Beneficial Microbiome of Drosophila melanogaster. mBio. 2013;4:e00860–13–e00860–13. doi: 10.1128/mBio.00860-13. [DOI] [PMC free article] [PubMed] [Google Scholar]
- 13.Broderick NA, Buchon N, Lemaitre B. Microbiota-Induced Changes in Drosophila melanogaster Host Gene Expression and Gut Morphology. mBio. 2014;5:e01117–14–e01117–14. doi: 10.1128/mBio.01117-14. [DOI] [PMC free article] [PubMed] [Google Scholar]
- 14.Richter-Dyn N, Goel NS. On the extinction of a colonizing species. Theor Popul Biol. 1972;3:406–433. doi: 10.1016/0040-5809(72)90014-7. [DOI] [PubMed] [Google Scholar]
- 15.Lau BTC, Malkus P, Paulsson J. New quantitative methods for measuring plasmid loss rates reveal unexpected stability. Plasmid. 2013;70:353–361. doi: 10.1016/j.plasmid.2013.07.007. [DOI] [PMC free article] [PubMed] [Google Scholar]
- 16.Li H, Qi Y, Jasper H. Preventing Age-Related Decline of Gut Compartmentalization Limits Microbiota Dysbiosis and Extends Lifespan. Cell Host & Microbe. 2016;19:240–253. doi: 10.1016/j.chom.2016.01.008. [DOI] [PMC free article] [PubMed] [Google Scholar]
- 17.Shanbhag S, Tripathi S. Epithelial ultrastructure and cellular mechanisms of acid and base transport in the Drosophila midgut. Journal of Experimental Biology. 2009;212:1731–1744. doi: 10.1242/jeb.029306. [DOI] [PubMed] [Google Scholar]
- 18.Ha EM, Lee KA, Seo YY, Kim SH, Lim JH, Oh BH, Kim J, Lee WJ. Coordination of multiple dual oxidase–regulatory pathways in responses to commensal and infectious microbes in drosophila gut. Nat Immunol. 2009;10:949–957. doi: 10.1038/ni.1765. [DOI] [PubMed] [Google Scholar]
- 19.Kuraishi T, Binggeli O, Opota O, Buchon N, Lemaitre B. Genetic evidence for a protective role of the peritrophic matrix against intestinal bacterial infection in Drosophila melanogaster. Proc Natl Acad Sci USA. 2011;108:15966–15971. doi: 10.1073/pnas.1105994108. [DOI] [PMC free article] [PubMed] [Google Scholar]
- 20.Dennis B. Natural Resource Modeling. 1989. Allee effects: population growth, critical density, and the chance of extinction. [Google Scholar]
- 21.Ricklefs RE. A comprehensive framework for global patterns in biodiversity. Ecology Letters. 2004;7:1–15. [Google Scholar]
- 22.Peay KG, Belisle M, Fukami T. Phylogenetic relatedness predicts priority effects in nectar yeast communities. Proceedings of the Royal Society B: Biological Sciences. 2012;279:749–758. doi: 10.1098/rspb.2011.1230. [DOI] [PMC free article] [PubMed] [Google Scholar]
- 23.Lee SM, Donaldson GP, Mikulski Z, Boyajian S, Ley K, Mazmanian SK. Bacterial colonization factors control specificity and stability of the gut microbiota. Nature. 2013;501:426–429. doi: 10.1038/nature12447. [DOI] [PMC free article] [PubMed] [Google Scholar]
- 24.Cohen AN, Carlton JT. Accelerating invasion rate in a highly invaded estuary. Science. 1998;279:555–558. doi: 10.1126/science.279.5350.555. [DOI] [PubMed] [Google Scholar]
- 25.MacDougall AS, Gilbert B, Levine JM. Plant invasions and the niche. Journal of Ecology 2009 [Google Scholar]
- 26.Chesson P. General theory of competitive coexistence in spatially-varying environments. Theor Popul Biol. 2000;58:211–237. doi: 10.1006/tpbi.2000.1486. [DOI] [PubMed] [Google Scholar]
- 27.Wiles TJ, Jemielita M, Baker RP, Schlomann BH, Logan SL, Ganz J, Melancon E, Eisen JS, Guillemin K, Parthasarathy R. Host Gut Motility Promotes Competitive Exclusion within a Model Intestinal Microbiota. Plos Biol. 2016;14:e1002517. doi: 10.1371/journal.pbio.1002517. [DOI] [PMC free article] [PubMed] [Google Scholar]
- 28.Vega NM, Gore J. Stochastic assembly produces heterogeneous communities in the Caenorhabditis elegans intestine. Plos Biol. 2017;15:e2000633. doi: 10.1371/journal.pbio.2000633. [DOI] [PMC free article] [PubMed] [Google Scholar]
- 29.Hubbell SP. The unified neutral theory of biodiversity and biogeography. Princeton University Press; 2001. [DOI] [PubMed] [Google Scholar]
- 30.Fukami T, Nakajima M. Community assembly: alternative stable states or alternative transient states? Ecology Letters. 2011;14:973–984. doi: 10.1111/j.1461-0248.2011.01663.x. [DOI] [PMC free article] [PubMed] [Google Scholar]
- 31.Thompson R, Townsend C. A truce with neutral theory: local deterministic factors, species traits and dispersal limitation together determine patterns of diversity in stream invertebrates. J Anim Ecol. 2006;75:476–484. doi: 10.1111/j.1365-2656.2006.01068.x. [DOI] [PubMed] [Google Scholar]
- 32.Miller A. Biology of Drosophila. CSHL Press; 1994. The internal anatomy and histology of the imago of Drosophila melanogaster; pp. 420–534. [Google Scholar]
- 33.Kim E-K, Park YM, Lee OY, Lee W-J. Draft Genome Sequence of Lactobacillus plantarum Strain WJL, a Drosophila Gut Symbiont. Genome Announcements. 2013;1 doi: 10.1128/genomeA.00937-13. [DOI] [PMC free article] [PubMed] [Google Scholar]
- 34.Yamada R, Deshpande SA, Bruce KD, Mak EM, Ja WW. Microbes Promote Amino Acid Harvest to Rescue Undernutrition in Drosophila. CellReports. 2015;10:865–872. doi: 10.1016/j.celrep.2015.01.018. [DOI] [PMC free article] [PubMed] [Google Scholar]
- 35.Spath K, Heinl S, Grabherr R. Direct cloning in Lactobacillus plantarum: electroporation with non-methylated plasmid DNA enhances transformation efficiency and makes shuttle vectors obsolete. Microb Cell Fact. 2012;11:141. doi: 10.1186/1475-2859-11-141. [DOI] [PMC free article] [PubMed] [Google Scholar]
- 36.Teixeira L, Ferreira Á, Ashburner M. The Bacterial Symbiont Wolbachia Induces Resistance to RNA Viral Infections in Drosophila melanogaster. Plos Biol. 2008;6:e2. doi: 10.1371/journal.pbio.1000002. [DOI] [PMC free article] [PubMed] [Google Scholar]
- 37.Hayward AC, Davis G. The isolation and classification of Lactobacillus strains from Italian saliva samples. Br Dent J 1956 [Google Scholar]
- 38.Buchon N, Osman D, David FPA, Fang HY, Boquete JP, Deplancke B, Lemaitre B. Morphological and Molecular Characterization of Adult Midgut Compartmentalization in Drosophila. CellReports. 2013;3:1725–1738. doi: 10.1016/j.celrep.2013.04.001. [DOI] [PubMed] [Google Scholar]
- 39.Ceja-Navarro JA, Nguyen NH, Karaoz U, Gross SR, Herman DJ, Andersen GL, Bruns TD, Pett-Ridge J, Blackwell M, Brodie EL. Compartmentalized microbial composition, oxygen gradients and nitrogen fixation in the gut of Odontotaenius disjunctus. ISME J. 2014;8:6–18. doi: 10.1038/ismej.2013.134. [DOI] [PMC free article] [PubMed] [Google Scholar]
- 40.Roughgarden J, Roughgarden J. Primer of Ecological Theory. Benjamin-Cummings Publishing Company; 1998. [Google Scholar]
- 41.Dill K, Bromberg S. Molecular Driving Forces: Statistical Thermodynamics in Biology, Chemistry, Physics, and Nanoscience. Garland Science; 2010. [Google Scholar]
- 42.Warren PH, Law R, Weatherby AJ. Conceptual Ecology and Invasion Biology: Reciprocal Approaches to Nature. Dordrecht: Springer Netherlands; 2006. Invasion biology as a community process: messages from microbial microcosms; pp. 343–367. [Google Scholar]
Associated Data
This section collects any data citations, data availability statements, or supplementary materials included in this article.