Abstract
Identifying drug-target interaction (DTI) candidates is crucial for drug repositioning. However, usually only positive DTIs are deposited in known databases, which challenges computational methods to predict novel DTIs due to the lack of negative samples. To overcome this dilemma, researchers usually randomly select negative samples from unlabeled drug-target pairs, which introduces a lot of false-positives. In this study, a negative sample extraction method named NDTISE is first developed to screen strong negative DTI examples based on positive-unlabeled learning. A novel DTI screening framework, PUDTI, is then designed to infer new drug repositioning candidates by integrating NDTISE, probabilities that remaining ambiguous samples belong to the positive and negative classes, and an SVM-based optimization model. We investigated the effectiveness of NDTISE on a DTI data provided by NCPIS. NDTISE is much better than random selection and slightly outperforms NCPIS. We then compared PUDTI with 6 state-of-the-art methods on 4 classes of DTI datasets from human enzymes, ion channels, GPCRs and nuclear receptors. PUDTI achieved the highest AUC among the 7 methods on all 4 datasets. Finally, we validated a few top predicted DTIs through mining independent drug databases and literatures. In conclusion, PUDTI provides an effective pre-filtering method for new drug design.
Introduction
Identifying drug-target interaction (DTI) candidates is important in modern drug discovery1–3. Efficiently predicting possible DTIs helps accelerate research efforts in discovering multitarget drugs or multidrug targets4, 5. High-throughput screening provides more opportunities for exploring DTIs3. However, existing data about DTIs are still very limited. For example, although an estimated 35 million compounds exist in the PubChem database, only <7000 drug compounds have available association information on their corresponding targets3. Experimental determination of DTIs remains labor-intensive, time consuming, and limited to small-scale identifications4, 6. Therefore, appropriate computational methods are needed to screen DTI candidates to save time and cost of biomedical experiments3.
Traditional computational methods to predict DTIs can be divided into ligand-based methods7 and molecule docking methods8. Ligand-based methods7 might be limited when target proteins have no known association information9, while molecular docking methods8 are computationally costly and depend largely on the 3D structures of target proteins3, 9. To overcome these problems, multiple computational models have been increasingly exploited to determine potential DTIs10–12. These computational methods are generally classified into two main classes: network-based inference methods and machine learning-based prediction methods3. Network-based inference methods, such as multiple target optimal intervention model13, drug side-effect similarity-based inference model14, and random walk-based prediction model with restart on the heterogeneous network10, can be used to investigate novel DTIs even if the 3D structures of proteins are unknown. However, this kind of method cannot detect possible DTIs when drug-target pairs are unreachable in a DTI network3.
An increasing number of machine learning-based methods have been proposed for inferring DTI candidates among which supervised learning methods are the most widely used3, 15 because they have excellent predictive capability3, 16. For example, a kernel regression-based approach17 was proposed to predict possible DTIs from human enzymes, ion channels, GPCRs and nuclear receptors by integrating the chemical structures of drug compounds, sequence information of target proteins and known DTI networks into a unified framework. A supervised learning method18 based on a bipartite local model performs well, but it cannot predict DTI candidates for new drugs or targets19. A Regularized Least Square-based method20 defined Gaussian interaction profile kernel and Kronecker product kernel (Kron) to identify possible DTIs (RLS Avg and RLS Kron). Kerneled Bayesian matrix factorization methods based on classification and regression21 obtained good predictive performances (KBMF2K-classification and KBMF2K-regression). A contrastive divergence method22 combing restricted Boltzmann machines was developed to find DTI candidates. However, this method only utilized known DTI networks and did not take advantage of drug and target similarity networks3. A Random Forest (RF)-based learning approach23 was exploited to predict DTIs by integrating substructures of compounds, physicochemical and biomedical properties of proteins and known DTI networks. However, this approach cannot detect possible DTIs for a new drug or target without association information. To solve this problem, multiscale feature representation approach24 based on deep learning, random projection ensemble method25 and support vector machine (SVM)12 were utilized to infer DTI candidates for new drugs or targets.
Supervised learning have demonstrated satisfactory classification capability15. However, their classification accuracy and robustness depend on the training dataset, wherein negative and positive samples are equally important. For potential DTI identification, unfortunately, positive samples (known DTIs) are rare, and experimentally validated negative samples (non-interacting drug-target pairs) are difficult to achieve or even unavailable26, 27. Thus, supervised learning-based models can only randomly generate negative samples from unlabeled drug-target pairs26, 27. However, these unlabeled datasets possibly include both positive and negative DTIs28. Thus, this inaccurate method for negative sample selection severely disturbs generation capability of the models and result in overoptimistic classification results3, 9, 26. Therefore, it is highlighted in refs 3 and 9 that extracting highly credible Negative DTI Samples (NDTISs) is one of the important developments in predicting DTIs.
It is assumed in ref. 26 that the compounds dissimilar to every known drug are not much likely to associate with proteins that interact with the known drugs, and vice versa. Based on the assumption, a systematic method, NCPIS, is presented to build up a set of reliable negative DTI samples. Reference 28 treated unknown DTIs as unlabeled samples and used three methods (KNN, random walk with restarts and heat kernel diffusion) to extract reliable negative examples and likely negative examples based on PU learning and target similarity information.
Positive and unlabeled (PU) learning29–31 has been widely applied to classify unlabeled data. The techniques can be categorized into two main classes based on different strategies that deal with unlabeled samples29, 31. One group of methods simply extract reliable negative samples from the unlabeled data and learn a classifier using positive and reliable negative data. The Spy-EM32 and Roc-SVM33 are two representative techniques. The Spy-EM method32 classified unlabeled texts based on a naive Bayesian classifier and an expectation maximization (EM) algorithm. The Roc-SVM method33 classified unknown documents by integrating the Rocchio technique and SVM. However, only known positive samples and extracted negative samples are available, and ambiguous samples (remaining unlabeled samples) are excluded in these two methods, thereby limiting their performances29.
Another group of methods fully utilized the ambiguous samples, except for positive and reliable negative data, during the learning process29–31. Micro cluster-based PU learning method (LELC)30 was applied to select high-quality negative samples and likely positive and negative samples from the unlabeled samples for data stream classification. LELC algorithm30 obtained more robustness than existing data stream classification techniques. However, LELC method absolutely imposed samples of the whole micro-cluster on either class29, 31. Therefore, misclassification may be generated when parts of the samples are close to the positive class, and the other samples are more biased toward the negative class in a micro-cluster29. To solve this problem, a similarity-based PU learning technique (SPUL)29 extended the standard SVM to explicitly identify the ambiguous examples. PU learning approach mixing population and individual properties (MPIPUL)31 detected deceptive reviews by mixing global and local information. Both techniques took full advantage of the similarities between samples for the easily misclassified ones, therefore, they obtained significantly higher improvement than the LELC algorithm.
Considering PU learning-based methods and various biological information related to drugs and targets, we first developed a Negative DTI Samples Extraction method, NDTISE, to screen strong negative DTI examples. A novel DTI screening framework, PUDTI, was then designed to infer new drug repositioning candidates of existing drugs and targets by integrating NDTISE, probabilities that the ambiguous samples belong to the positive and negative classes, and an SVM-based optimization model.
Results
Our goal is to (a) improve DTI predictive accuracy based on the PUDTI framework; (b) effectively identify drug repositioning candidates for existing drugs and targets; (c) provide new clues of the treatment for Alzheimer’s diseases. The central idea is to extract NDTISs based on PU learning. Figures 1, 2, 3, 4 and 5 show the illustration of the PUDTI framework. The framework consists of five main parts: representing each DTI as a vector based on various biological information, selecting feature subsets of DTIs, constructing strong NDTISs, computing the similarity weights of the ambiguous examples, and building an SVM-based optimization model.
Figure 1.
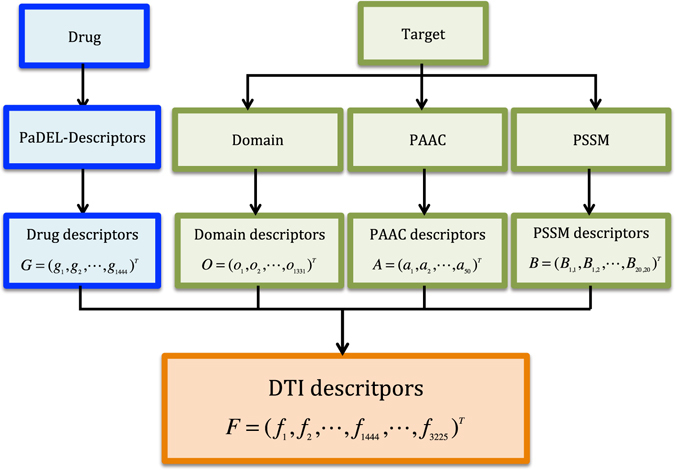
Representing each DTI as a vector.
Figure 2.
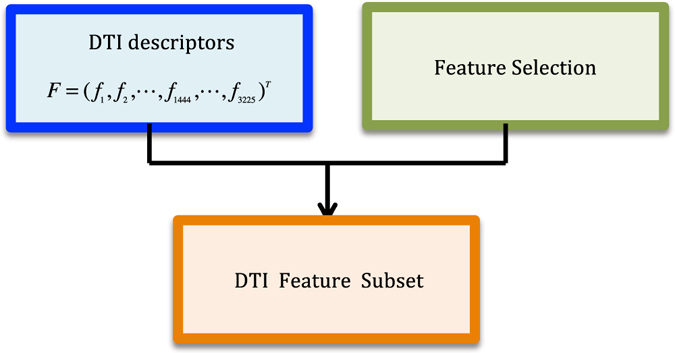
Selecting feature subset of DTIs.
Figure 3.
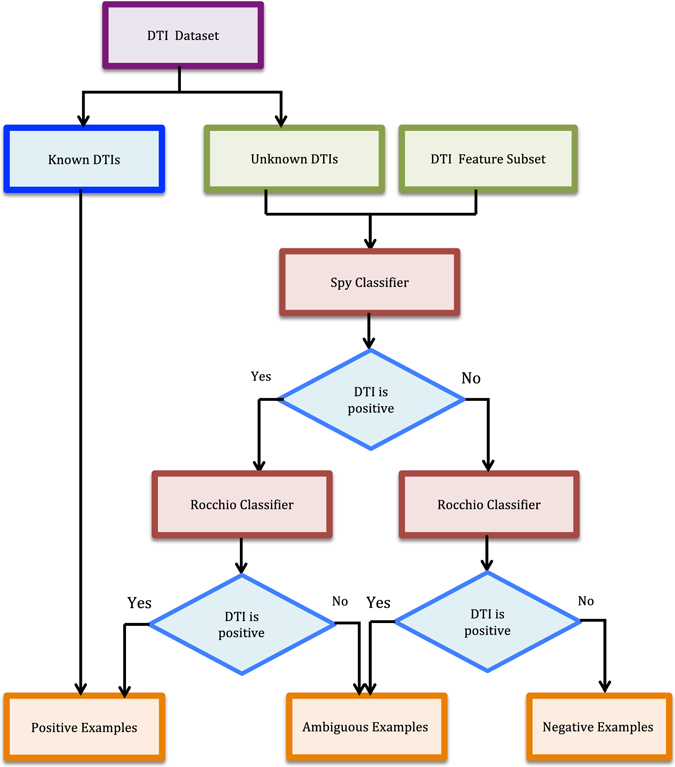
The NDTISE method.
Figure 4.
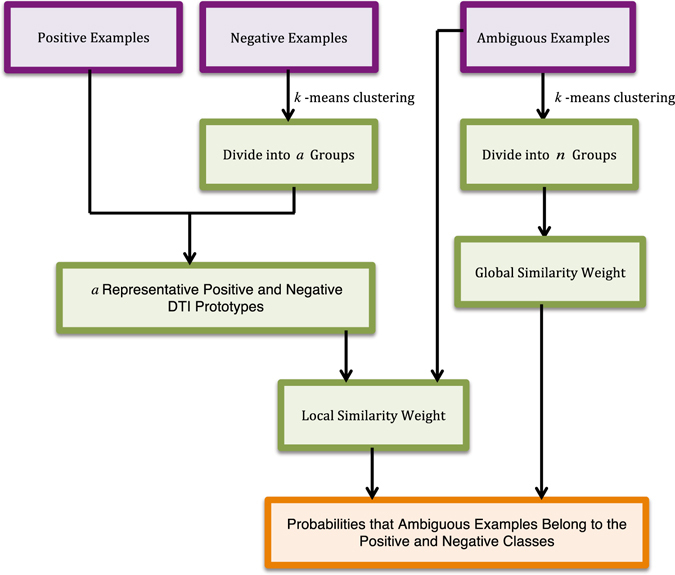
Computing the similarity weights of remaining ambiguous examples.
Figure 5.
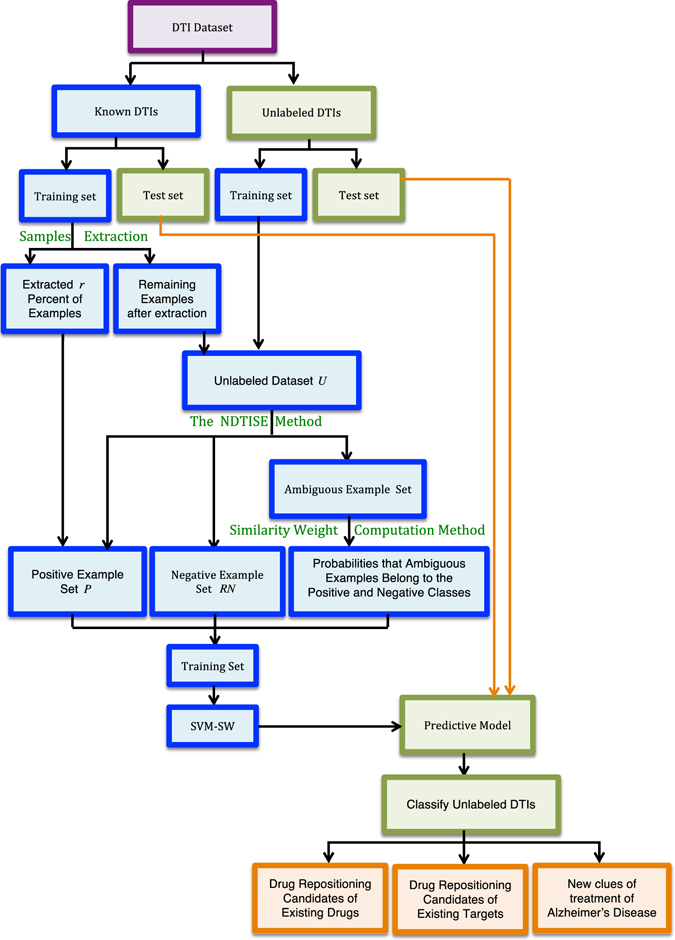
Classify unknown DTIs based on SVM-SM.
We evaluated whether our proposed PUDTI framework can identify potential DTIs properly. We presented extensive experiments under different experimental settings. (1) We compared the performances of our proposed NDTISE method with random selection method and NCPIS on a DTI data provided by NCPIS26. (2) We evaluated our proposed PUDTI framework on four classes of datasets from human enzymes, ion channels, GPCRs and nuclear receptors, respectively. (3) We compared the performances of 5 representative DTI prediction models including BLM, RLS-Avg, RLS-Kron, KBMF2K-classification and KBMF2K-regression by applying the negative samples predicted by NDTISE, random selection and NCPIS, respectively on the DrugBank data. (4) Parts of new drug repositioning candidates of existing drugs and targets are identified. (5) New clues of the treatment of Alzheimer’s disease are inferred.
We executed the feature selection method and ranked each feature based on their discriminant capability scores in constructed positive sample set P and unlabeled sample set U. Moreover, we screened the top 300 features for DTIs. Considering previous studies25 and our test, we chose the radial basis kernel as the kernel function because of its good boundary response24. The parameters C 1, C 2, C 3 and C 4 were set with a step size of 2−4 in the range [2−5, 25].
Performance Comparison of Different Negative Sample Selection Methods
We compared three different negative sample selection methods including NDTISE, random selection and NCPIS on the DTI data provided in the paper26 using six classical classification models including naive Bayes (NB), k-nearest neighbor (kNN), L1-logistic (L1-R) and L2-logistic regression(L2-R), RF and SVM. The parameters on these classifiers were set as the default values provided by ref. 26. The negative ratio in NCPIS was chosen as 3. The k for kNN algorithm was set as 1. Both the codes of the Spy and Rocchio classifiers32, 33 can be achieved from the LPU system30 (http://www.cs.uic.edu/liub/LPU/LPU-download.html).
A total of 10 trials of pairwise 5-fold cross-validation9, 26 were used to measure the NDTISE method against random selection method and NCPIS. (1) The drug-target pairs D (interacting or non-interacting) in the gold standard dataset were randomly partitioned into five mutually exclusive subsets that were roughly equal in size . (2) In each round , one drug-target pair set D t was regarded as a test set, and the entries in D t were masked. The remaining four subsets D\D t were taken as training sets to recover the masked true labels in D t. (3) The experiment was repeated 10 times to avoid sampling bias, and the average predictive performance over the 5-folds for 10 trials was used as the final result.
To extract sub-datasets for PU learning, we specially conducted the following setting: we randomly extracted r percent of samples from known DTI dataset in the training set to form a positive sample set P. The remaining samples from the known DTI dataset and unknown drug-target pairs in the training set were used together to form an unlabeled dataset U. We firstly set r = 10, and evaluated the performances of the NDTISE method by increasing r. We observed that the NDTISE method is basically stable when r is no less than 30. Therefore, we set r as 30 in this study. The above six classifiers utilized P and RN extracted by the three negative sample selection methods as positive and negative samples, respectively. SVM-SW computed the similarity weights of the ambiguous samples besides P and RN.
We listed in Table 1 the performances of the three negative sample selection methods using respective classification models in terms of precision, recall, f-measure and AUC. NDTISE outperforms the other two methods in 4 classification methods and achieves comparable performances to NCPIS in the other two classification methods. Compared to random selection method, for instance, the average AUC values on NDTISE increased by 17.29%, 36.10%, 5.89%, 7.03%, 26.79% and 25.08% in NB, kNN, L1-R and L2-R, RF and SVM, respectively. The F-measure values on NDTISE also increase by 29.34%, 55.38%, 15.60%, 15.54%, 53.31% and 58.60% from naive Bayes to SVM. Compared with NCPIS, NDTISE was found to be superior in NB, kNN, L1-R and L2-R. For instance, the AUC values of NDTISE increased by 10.64%, 2.59%, 1.82% and 2.02% from NB to L2-R. Moreover, the F-measure values of NDTISE increased by 12.87%, 3.88%, 4.69%, and 3.08%. The observations indicated that NDTISE can effectively screen negative DTI samples.
Table 1.
Performance comparison of six classical classification models on random selection method, NCPIS and NDTISE.
| Metric | Negative DTIs | NB | kNN | L1-R | L2-R | RF | SVM |
|---|---|---|---|---|---|---|---|
| Precision | Random | 0.338 | 0.458 | 0.786 | 0.787 | 0.529 | 0.700 |
| NCPIS | 0.361 | 0.716 | 0.823 | 0.837 | 0.847 | 0.969 | |
| NDTISE | 0.422 | 0.759 | 0.877 | 0.842 | 0.840 | 0.965 | |
| Recall | Random | 0.376 | 0.306 | 0.622 | 0.631 | 0.306 | 0.261 |
| NCPIS | 0.560 | 0.882 | 0.749 | 0.773 | 0.824 | 0.883 | |
| NDTISE | 0.625 | 0.897 | 0.775 | 0.817 | 0.821 | 0.876 | |
| F-measure | Random | 0.356 | 0.367 | 0.694 | 0.700 | 0.388 | 0.380 |
| NCPIS | 0.439 | 0.790 | 0.784 | 0.804 | 0.835 | 0.924 | |
| NDTISE | 0.504 | 0.822 | 0.823 | 0.829 | 0.830 | 0.918 | |
| AUC | Random | 0.622 | 0.593 | 0.879 | 0.873 | 0.694 | 0.705 |
| NCPIS | 0.672 | 0.904 | 0.917 | 0.920 | 0.954 | 0.942 | |
| NDTISE | 0.752 | 0.928 | 0.934 | 0.939 | 0.948 | 0.941 |
Although the performances of NDTISE were slightly lower than NCPIS in the RF and SVM, our proposed PUDTI framework based on the SVM-SW classifier was better than NCPIS, as shown in Table 2. The results indicated that considering the probabilities that the ambiguous samples belong to the positive and negative classes may help improve classification performance.
Table 2.
Performance comparison on SVM and SVM-SW.
| Metric | Precision | Recall | F-measure | AUC |
|---|---|---|---|---|
| SVM | 0.965 | 0.876 | 0.918 | 0.941 |
| SVM-SW | 0.973 | 0.892 | 0.931 | 0.962 |
Comparison on Four Classes of Datasets Provided by Yamanishi et al
Yamanishi et al.17 screened 90, 635, 1476 and 2926 interactions based on 54, 223, 210 and 445 drugs and 26, 95, 204 and 664 proteins from human nuclear receptors, GPCRs, ion channels and enzymes, respectively. Table 3 described the details. To demonstrate the performance of our proposed PUDTI framework, we compared it with 6 state-of-the-art methods on these four datasets: DBSI11, NetLapRLS34, KBMF2K21, NetCBP27, WNN-GIP35 and PUDT-Lan28. The six methods were used to predict potential DTIs from human nuclear receptors, GPCRs, ion channels and enzymes and the last method inferred possible DTIs based on PU learning.
Table 3.
Datasets from human nuclear receptors, GPCRs, ion channels and enzymes17.
| Dataset | Nuclear receptors | GPCRs | Ion channels | Enzymes |
|---|---|---|---|---|
| drugs | 54 | 223 | 210 | 445 |
| targets | 26 | 95 | 204 | 664 |
| interactions | 90 | 635 | 1476 | 2926 |
We listed in Table 4 the average AUC values of these six methods and our proposed PUDTI framework. It is clear that PU-based prediction methods significantly outperform other methods on all four datasets, which suggests that extracting negative DTI samples from unlabeled drug-target pairs may help improve prediction performance. In addition, our proposed PUDTI framework is better than the PUDT-Lan method, which might due to the fact that we considered the probabilities that the ambiguous samples belong to the positive and negative classes in PUDTI.
Table 4.
The average AUC values of different DTI prediction methods on four datasets.
| Dataset | DBSI | NetLapRLS | KBMF2K | NetCBP | WNN-GIP | PUDT-Lan | PUDTI |
|---|---|---|---|---|---|---|---|
| Nuclear receptor | 0.759 | 0.761 | 0.810 | 0.838 | 0.839 | 0.885 | 0.907 |
| GPCR | 0.803 | 0.826 | 0.840 | 0.823 | 0.872 | 0.878 | 0.894 |
| Ion channel | 0.803 | 0.793 | 0.802 | 0.803 | 0.775 | 0.831 | 0.875 |
| Enzyme | 0.806 | 0.802 | 0.812 | 0.825 | 0.861 | 0.884 | 0.898 |
Comparison with Representative DTI Prediction Methods on the DrugBank data
We compared the performances of 5 representative DTI prediction models including BLM, RLS-Avg, RLS-Kron, KBMF2K-classification and KBMF2K-regression by applying the negative samples predicted by NDTISE, random selection and NCPIS, respectively on the DrugBank data. These methods were originally used to identify potential DTIs from human enzymes, ion channels, GPCRs and nuclear receptors, which were provided by ref. 17. For RLS-Avg and RLS-Kron, we set the parameters as (0.5, 0.5) and (0.5, 0.5), wherein the two classifiers obtained better classification performances than (1, 1) and (1, 1)26. We extracted strong NDTISs based on algorithm 1. The drug and protein similarity matrices can be calculated according to cosine formula based on the feature vectors of drugs and proteins. We still used 10 trials of pairwise 5-fold cross-validation and conducted sub-dataset extraction for PU learning, similar to the previous section.
The results are as shown in Fig. 6. NDTISE significantly outperforms random selection method in 5 representative DTI prediction models. The recall values of NDTISE were lower than NCPIS in these models. However, the precision values of NDTISE are better than NCPIS, that is, more correctly predicted DTIs were obtained; although, successfully predicted DTIs were relatively few. Moreover, NDTISE obtained better improvement than NCPIS in terms of F-measure and AUC. These results indicated that our designed NDTISE method can extract NDTISs properly.
Figure 6.
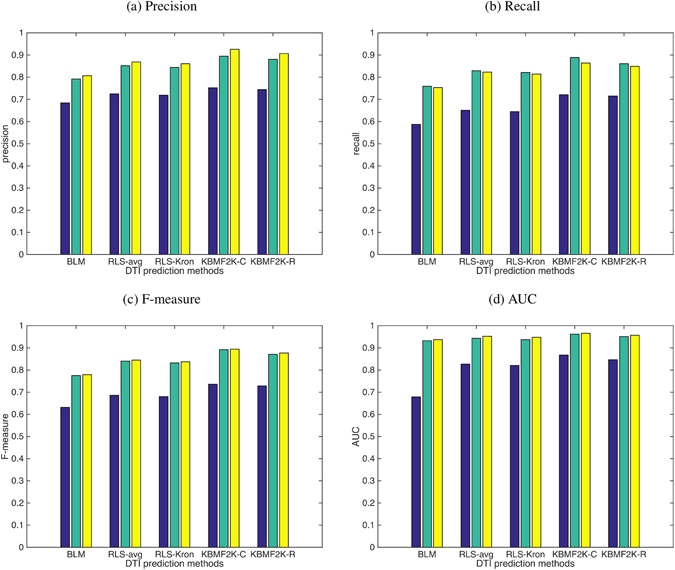
Performance comparison of different negative sample selection methods. Blue denotes the performances of random selection method, green denotes the performances of NCPIS and yellow denotes the performances of our proposed NDTISE method. (a–d) Represent precision, recall, F-measure and AUC values of different negative samples extraction methods using respective classification models, respectively.
Sensitivity Study on the Parameter
The similarity weights of an ambiguous sample are used to measure the probabilities that the sample belongs to the positive and negative classes. The parameter α is used to balance the importance between local and global similarities. To measure the sensitivity of α in our proposed PUDTI framework, we conducted a series of extensive experiments to investigate the performance under different settings.
As described in Fig. 7, when r is 30, and if α < 0.6, the performances increase gradually; and if α > 0.6, the performances decrease gradually. We obtained the similar results when r was selected from 40 to 70 with a step size of 10. Therefore, we set α as 0.6.
Figure 7.
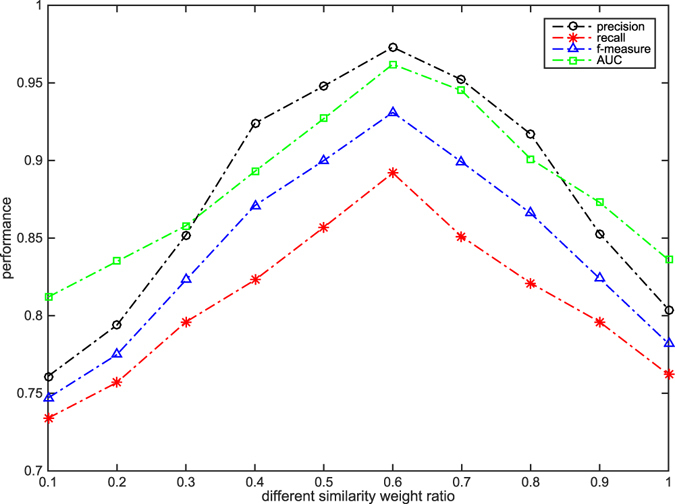
The choice of α values.
Drug Repositioning for Astemizole
Astemizole is a long-acting and non-sedative antihistaminic. The drug has antiallergic properties and is used to treat allergic conjunctivitis, asthma, chronic idiopathic urticaria and seasonal allergic rhinitis36. Recently, ref. 37 reported that astemizole was possibly a new anti-cancer drug. Therefore, identifying new drug repositioning candidates for the drug is significant. We intended to find new association information for the drug from the DrugBank database38 by training SVM-SW classification model after determining the performances of PUDTI.
Astemizole interacts with eight proteins, namely, P24462, P08183, P35367, P51589, P20815, P10635, P08684 and Q12809 in the DrugBank database38. We extracted twelve negative DTIs for the drug, namely, O75600, P07814, P21549, P23378, P23415, P28066, P30793, P34896, P34897, Q10588, Q53ET4 and Q8IWU9. Five of these extracted negative DTIs have been reported by ref. 26. We used cytoscape39 to draw DTI networks. Figure 8(a) listed known DTIs in the DrugBank database38 and reliable NDTISs extracted by algorithm 1.
Figure 8.
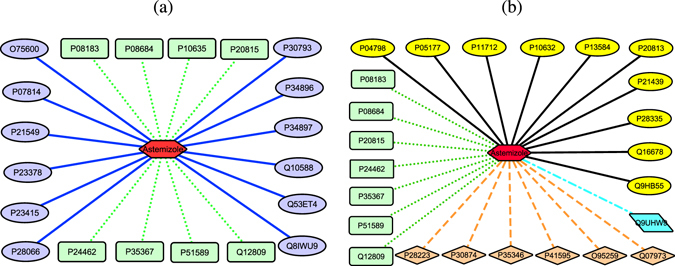
New drug repositioning candidates of astemizole. Figure (a) describes the known DTIs and extracted NDTISs of astemizole. Red hexagon denotes astemizole, the green dotted lines denote known DTIs, the blue solid lines denote extracted NDTISs in (a). Figure (b) describes predicted DTIs of astemizole. The green dotted lines denote successfully predicted DTIs, the orange dash lines denote predicted DTIs that can be validated by the related databases, the azure dash dotted line denotes predicted DTIs which have been reported by ref. 26, the black solid lines denote the other predicted results in (b).
We predicted possible interaction partners for astemizole based on known DTIs and extracted NDTISs. The predicted results are shown in Fig. 8(b). These DTIs can be divided into four parts: the first part includes known DTIs in the DrugBank database38, wherein seven of eight known DTIs are identified by PUDTI. The second part includes DTI candidates that are unknown in the DrugBank database38 but can be validated by retrieving the other databases. Among these DTIs, the interactions between astemizole and four proteins, namely, Q07973, O95259, P28223 and P41595, can be validated by searching the STITCH database40, and the interactions between astemizole and two proteins, namely, P35346 and P30874, can be substantiated by retrieving the SuperTarget database41.
The third part includes the interaction between astemizole and Q9UHW9, which has been reported by ref. 26. The remaining are from the associations between astemizole and P04798, P05177, P10632, P11712, P13584, P20813, P21439, P28335, Q16678 and Q9HB55.
P08183 is an energy-dependent efflux pump and used to decrease drug accumulation in cells42. The protein interacts with astemizole in the DrugBank database38. Phosphatidylcholine translocator ABCB4 (P21439) is energy-dependent phospholipid efflux translocator and used to positively regulate biliary lipid secretion. It specifically translocates phosphatidylcholine from canalicular membrane bilayer into hepatocytes. The translocation enables biliary phospholipids to be extracted into the canaliculi lumen and thus protects hepatocytes from the detergent properties of bile salts42. Both P08183 and P21439 are multidrug resistance proteins38. The function of P21439 is similar to P08183’s41. Moreover, sequence similarity and sequence identity between these two proteins are 0.86 and 0.753 in the SuperTarget database, respectively41. Therefore, we inferred that P21439 may be new drug repositioning candidates of astemizole based on the predictive accuracy of PUDTI, functional similarity, sequence similarity and sequence identity to known target.
Drug Repositioning for DNA topoisomerase 2-alpha
DNA topoisomerase 2-alpha (P11388) encoded by the TOP2A gene is used to control topological states of DNA. It is essential for segregating daughter chromosomes during mitosis and meiosis38. We intended to find new drug repositioning candidates for the protein from the DrugBank database38 by training SVM-SW classification model after determining the performances of PUDTI.
P11388 interacts with thirty-two drugs in the DrugBank database38. Most of these drugs are used to interfere with the transcription process and prevent the RNA synthesis38. We extracted thirteen negative DTIs for the proteins, where eight of these extracted negative DTIs have been reported by ref. 26. We used cytoscape39 to draw DTI networks. Figure 9(a) listed known DTIs in the DrugBank database38 and reliable NDTISs extracted by algorithm 1.
Figure 9.
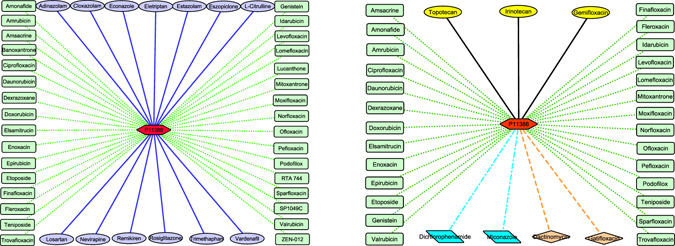
New drug repositioning candidates of P11388. Figure (a) describes the known DTIs and extracted NDTISs of P11388. Red hexagon denotes P11388, the green dotted lines denote known DTIs, the blue solid lines denote extracted NDTISs in (a). Figure (b) describes predicted DTIs of P11388. The green dotted lines denote successfully predicted DTIs, the orange dash lines denote predicted DTIs that can be validated by the related databases, the azure dash dotted lines denote predicted DTIs which have been reported by ref. 26, the black solid lines denote the other predicted results in (b).
We predicted possible interaction partners for P11388 based on known DTIs and extracted NDTISs. The predicted results were shown in Fig. 9(b). These DTIs can be divided into four parts: the first part includes known DTIs in the DrugBank database38, wherein twenty-seven of thirty-two known DTIs are identified by our proposed PUDTI framework. The second part includes DTI candidates that are unknown in the DrugBank database38 but can be validated by retrieving the other databases. Among these DTIs, the interaction between dactinomycin and P11388 can be validated by searching the UniProt database42, and the interaction between gatifloxacin and P11388 can be substantiated by retrieving the SuperTarget database41. Dactinomycin is used to bind to DNA and inhibit RNA synthesis. Protein synthesis, a result of impaired mRNA production, will decline after dactinomycin therapy38. Gatifloxacin is used to inhibit bacterial enzymes DNA gyrase. The drug is available in aqueous solutions for intravenous therapy38.
The third part includes the interactions between P11388 and dichlorophenamide and miconazole, which have been reported by ref. 26. The remaining are from the associations between P11388 and irinotecan and topotecan. P11388 interacts with camptothecine in the SuperTarget database41. Both irinotecan and topotecan are derivatives of camptothecin38. Topotecan is a drug used to treat ovarian cancer. It is used to regulate DNA topology and facilitate DNA recombination, replication and repair by inhibiting DNA topoisomerase I38. The similarity between camptothecine and topotecan is 0.94 in the SuperTarget database41. The association between P11388 and topotecan can be validated by retrieving refs 43–45. Therefore, we inferred that P11388 may interact with topotecan.
Find New Clues of Treatment for Alzheimer’s Diseases
The above results of drug repositioning imply that existing drugs and drug targets may help find new therapies for diseases. We investigated the complex associations between existing drugs and drug targets of Alzheimer’s disease to infer new clues of treatment for the disease. We retrieved six drugs for Alzheimer’s disease based on its indications in the DrugBank database, namely, galantamine, olanzapine, quetiapine, risperidone, thioridazine and ziprasidone38. All the other five drugs except for galantamine target seven proteins, namely, D(1A), D(2) and D3 dopamine receptors (P21728, P14416 and P35462), alpha-1A and alpha-1B adrenergic receptor (P35348 and P35368), 5-hydroxytryptamine receptors (P28223) and potassium voltage-gated channel subfamily H member 2(Q12809)38.
We found some drugs targeting these seven proteins in the DrugBank database. However, we can not infer new clues of the treatment of Alzheimer’s disease only by these seven target proteins. Therefore, we intended to predict the interactions between these six drugs and targets, as well as the associations between these drug targets and the other drugs. The results are shown in Fig. 10. We can observe that the other five drugs except for galantamine generally target parts of target proteins, namely, adrenergic receptors (P35348, P35368, P08913, P18089 and P18825), dopamine receptors (P21728, P21917, P21918, P35462 and P14416), 5-hydroxytryptamine receptors (P28223, P34969 and P08908), muscarinic acetylcholine receptors (P08172, P08173, P08912 and P11229), histamine H1 receptor (P35367) and potassium voltage-gated channel subfamily H member 2(Q12809). Therefore, we inferred that these target proteins may have a strong correlation with Alzheimer’s disease.
Figure 10.
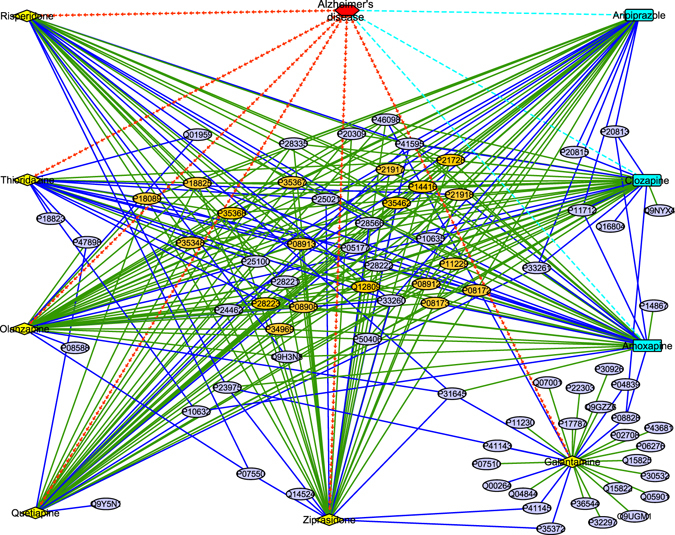
New clues of the treatment of Alzheimer’s disease. Red hexagon denotes Alzheimer’s disease, yellow diamonds denote known drugs of Alzheimer’s disease, azure rectangles denote predicted new clues of treatment of Alzheimer’s disease. Green solid lines denote known DTIs, blue solid lines denote predicted DTIs, red separate arrow lines denote the associations between Alzheimer’s disease and known drugs, azure dash lines denote the associations between Alzheimer’s disease and new clues of treatment.
We further considered the other drugs targeting these proteins in the DrugBank database and found that aripiprazole may have strong correlations with these target proteins. Aripiprazole is atypical antipsychotic medication and is used to treat schizophrenia and mediate its antipsychotic effects primarily by P14416. It has been reported in ref. 46 that aripiprazole may be in clinical trails and used to the treatment of Alzheimer’s disease. Therefore, we inferred that aripiprazole may be a drug candidate of Alzheimer’s disease.
Discussion
Supervised learning-based methods demonstrated better classification performances for potential DTI identification than traditional computational methods. However, experimentally validated NDTISs were impossible to achieve or even unavailable. Therefore, screening negative training samples for DTI prediction models is a recurring problem. In this study, we designed the NDTISE method to extract reliable NDTISs based on PU learning and various biological information. A novel DTI screening framework, PUDTI, is then developed to find new drug repositioning candidates of existing drugs and targets. Experimental results from three different negative sample selection methods on the DTI data provided by NCPIS26, 6 state-of-the-art methods on 4 classes of DTI datasets from human nuclear receptors, GPCRs, ion channels and enzymes, and 5 representative DTI prediction models on the DrugBank data demonstrated the generalization capability and competitiveness of our proposed PUDTI framework. The framework identified new drug repositioning candidates for the drug astemizole and the target DNA topoisomerase 2-alpha, and found new clues of the treatment for Alzheimer’s disease.
The PUDTI framework can produce good results over all measures compared with different methods. This observation may be ascribed to the following advantages of the framework. (1) The framework can effectively extract those DTI candidates that are most likely to be negative samples. These NDTISs are applied to identify possible DTIs with the labeled DTIs. (2) The framework took advantage of multiple classifier combination and effectively integrated two types of PU learning models and various biological information related to drugs and targets. (3) In the DTI prediction problem, the noise in training samples was unavoidable. Different similarity weights were calculated to demonstrate different noise levels of the ambiguous samples. Therefore, the built SVM-SW was more tolerant to different noise levels of various DTI data types.
The PUDTI framework integrated the Spy and Rocchio classifiers32, 33 to extract reliable NDTISs. However, the predictive accuracy can be further improved by integrating multiple PU learning models. In subsequent investigations, we will consider an ensemble PU learning framework for DTI screening to minimize the possible bias and errors in these two types of PU learning methods.
The negative sample construction is a key issue in predicting associations between various biological entities, such as lncRNA-disease associations, miRNA-disease associations and drug-drug associations. The PUDTI framework may also benefit from the extraction of various negative samples, which will in turn assist in identifying underlying associations between these entities. In further experiments, we will consider to build negative lncRNA-disease association dataset and negative miRNA-disease association dataset based on PU learning to improve predictive performance.
Finding new therapies for existing drugs is significant for modern drug development. There are complex associations between diseases and their known drugs and drug targets. In the future, we will consider to build a supervised learning model by constructing a disease-drug-target network to identify new clues of the treatment for existing diseases.
Materials and Methods
Materials
Representing Drug Molecules
Different kinds of descriptors were used to describe various drug molecule properties in drug discovery. A PaDEL-Descriptor software47 has been designed to represent drug molecules. We used the software and represented a drug molecule as based on the preprocessing program provided by ref. 25.
Representing Target Proteins
Various types of protein descriptors were defined based on different properties of target proteins in proteomics. For representing target proteins, we used three types of protein properties, namely, protein domain48, pseudo amino acid composition (PAAC)49 and position specific scores50.
Protein Domain: Domains of target proteins were retrieved from the PFAM database48. A total of 1331 functionally assigned domains on human are available in PFAM. The domain component of a target protein is denoted as , where o i (1 ≤ i ≤ 1331) is equal to 1 if the target protein contains the ith domain; otherwise, o i is equal to 0.
PAAC: The PAAC method49 described each protein based on the amino acid sequence of a protein. Following the PAAC method, we used PAAC features as descriptors to represent each target protein as a 50-dimensional vector:
| 1 |
Position Specific Score Matrix (PSSM): The bi-gram feature extraction method (BiGFE)51 was developed to describe the evolutionary information of target proteins combining position specific scoring matrix (PSSM)50 of target proteins. References 12 and 52 used the method and obtained improved performances in predicting DTIs. We described each protein as a 400-dimensional feature vector based on the BiGFE method:
| 2 |
Combing domains, PAACs and PSSM, a protein target can be represented as a 1781-dimensional vector:
| 3 |
Therefore, each DTI sample can be described as a 3225-dimension vector based on PaDEL-Descriptors of drugs and domains, PAACs and PSSM of target proteins:
| 4 |
, where represents the 1444 PaDEL-Descriptors of drugs, and represents the 1781 descriptors of target proteins.
Drug-target Interaction Data
We downloaded DTI data from STITCH40, DrugBank38 and Matador41, which were provided by ref. 26. In these databases, a total of 2,290,630 interactions between 367,142 unique drug compounds and 19, 342 target proteins on human are available.
Methods
The proposed PUDTI framework can be divided into five steps:
Select the feature subsets of DTI samples.
Screen the high-quality NDTISs.
Calculate the representative positive and negative prototypes.
Compute the similarity weights of the ambiguous samples.
Construct the final classification model and identify DTI candidates.
In the following, we described every step in details.
Step 1: Feature Selection
There are parts of robust features in DTI feature set. Selecting a feature subset from these features may help decrease the false positive and the false negative ratios, thereby avoiding the overfitting problem. Reference 53 developed a feature selection method to distinguish disease genes from non-disease genes, we used the method to select feature subsets for each DTI to efficiently distinguish interacting drug-target pairs from noninteracting drug-target pairs.
For each DTI feature f, we define its association score in P and U (as(f, P) and as(f, U)) as follows:
| 5 |
where DTP i is the ith Drug-Target pair, DTP i ∈ P indicates that the ith DTP is positive and DTP i ∈ U represents that the ith DTP is unlabeled. asso(DTP i, f) represents the association score between DTP i and the feature f, which can be computed as follows:
| 6 |
We then compute the discriminant ability score of f in P and U as,
| 7 |
By Eq. (7), we intend to screen those discriminative features which either frequently present in P but seldom in U or frequently present in U but seldom in P. For a feature f, when as(f, P) in P is large but as(f, U) in U is small or as(f, U) in U is large but as(f, P) in P is small, da(f) will be large because both af(f, P) + af(f, U) and log(|P|/af(f, P) + |U|/af(f, U)) are relatively large. On the contrary, the score will be relatively low when both af(f, P) and af(f, U) are small or large simultaneously. Thus, we can select representative feature subsets for each DTI.
Step 2: Screening Reliable NDTISs
Typically, supervised learning-based models require numerous labeled positive and negative samples to achieve good classification accuracy. However, known DTIs are rare, and NDTISs are difficult to achieve or even unavailable. Moreover, numerous DTI examples are unlabeled. To obtain a good predictive performance, we intend to screen trustworthy NDTISs.
We considered two classical PU learning models, namely, the Spy and Rocchio techniques32, 33. To reduce the expected error rates when screening NDTISs, we minimized the bias of individual model based on multiple classifier combination. The details are described in algorithm 1.
In algorithm 1, RN and EP denote reliable NDTISs and positive samples extracted by algorithm 1, respectively. C Spy and C Roc represent the classification results from the Spy and Rocchio classifiers32, 33, respectively. Steps 1 and 2 initialize P, U, RN and EP. Steps 3–5 classify the unknown DTIs in U. Steps 6–9 screen RN by excluding positive DTIs as far as possible. For instance, a DTI is regarded as a reliable negative sample if its classification results from two classifiers are both negative classes, that is, the DTI simultaneously satisfies C Spy = −1 and C Roc = −1. Steps 10–14 are used to add high-quality positive examples to P. The U in Step 15 denotes the remaining unlabeled DTIs after extracting parts of high-quality positive and negative examples. We considered these remaining DTIs as the ambiguous samples.
Algorithm 1.
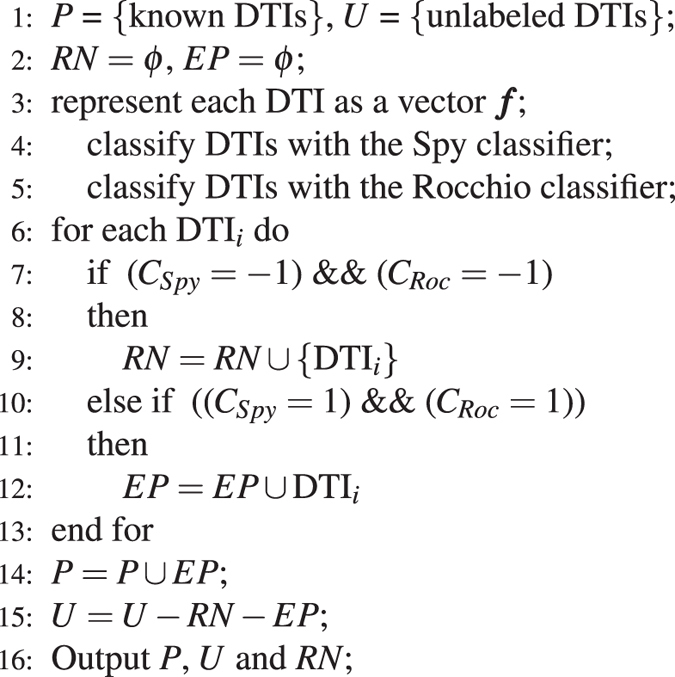
The NDTISE method.
Step 3: Computing the Representative Positive and Negative DTI Prototypes
We achieved reliable NDTISs from the last section. In theory, we can build a classifier and predict new DTIs using P and RN. However, the classification results may not be accurate enough because parts of ambiguous samples remain. For these ambiguous samples, we cannot determine whether they belong to the positive or negative classes. Assigning these examples to the positive or negative class will disturb the classification performance. As such, considering the method provided by refs 29 and 31, we developed a similarity weight calculation method to measure the probabilities that remaining ambiguous samples belong to the positive and negative classes.
To compute the similarity weights of these ambiguous samples, we partitioned DTI samples in RN into a modules using the k-means clustering algorithm and computed the representative positive and negative DTI prototypes. The details are described in algorithm 2.
Algorithm 2.
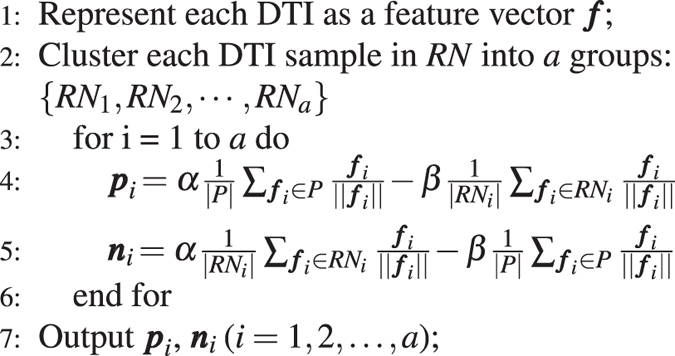
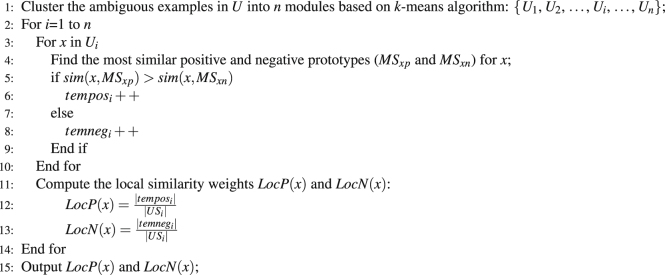
Computing the representative positive and negative DTI prototypes.
The parameter a was set as , where |RN| and |U| denote the numbers of RN and U, respectively. t, α and β were set as 30, 16 and 4, respectively, as recommended by the studies29–31.
Step 4: Computing the Similarity Weights of the Ambiguous Samples
The similarity weights of the remaining ambiguous samples in U represent the probabilities that the samples belong to the positive and negative DTI classes. To compute the similarity weights, we defined the similarities of an ambiguous sample x to the ith representative positive and negative prototypes (p i and n i) as follows:
| 8 |
Computing Local Similarity Weights: We developed an algorithm to measure the local similarity weights of the ambiguous samples.
Algorithm 3.
Computing the Local similarity weights of the ambiguous samples.
where n is set as and t is set as 30, which are recommended by refs 29 and 31. Step 5–9 tag x with a temporary label. |US i| denotes the number of all samples in US i. |tempos i| denotes the number of samples which are temporarily regarded as positive samples in US i, |temneg i| denotes the number of samples which are temporarily regarded as negative samples in US i. The most similar positive and negative prototypes of x can be obtained by equation (8).
As illustrated in Fig. 11, H denotes the decision hyperplane in the process of classification and can be computed by the Rocchio classifier33. The ambiguous examples in U are clustered into four modules, namely, M 1, M 2, M 3 and M 4. The examples in M 1, M 2, M 3 and M 4 are assigned with local similarity weights (1, 0), , and (0, 1), respectively.
Figure 11.
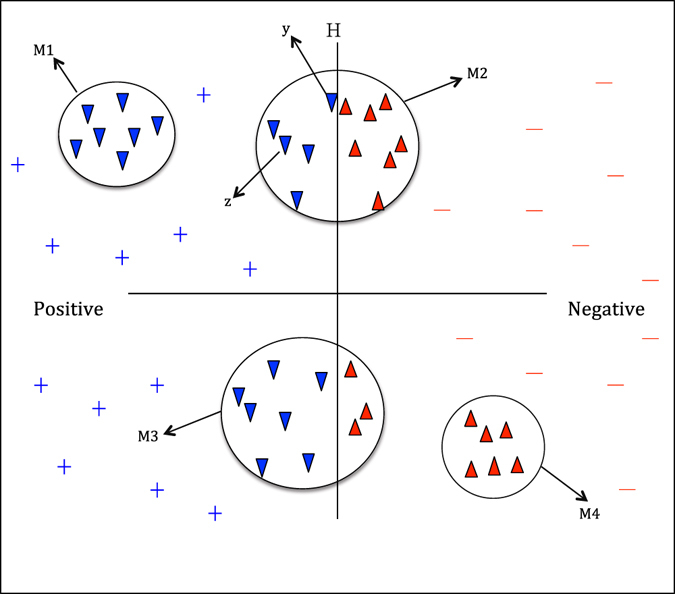
Computing the local similarity weights of the ambiguous samples. Blue lower triangles represent positive DTI samples in a cluster, red upper triangles represent NDTISs in the cluster.
Computing Global Similarity Weights: The local similarity weights utilized the biological features shared by the ambiguous samples and computed the similarities between all samples in a cluster. However, the local similarity weights of samples in the same cluster are possibly different because of different physical locations. For example, assigning the same class weight to the ambiguous samples y and z in M 2 is inappropriate even though the two samples have the same local similarity weights. Therefore, we calculated the global similarity weights between x and all representative prototypes to measure the probabilities that x belongs to the positive and negative DTI classes from a global perspective.
The global similarity weights of x can be measured as follows:
| 9 |
where GloP(x) and GloN(x) represent the probabilities that x belongs to the positive and negative DTI classes from a global perspective.
We obtain the final probabilities that x belongs to the positive and negative DTI classes based on its local and global similarity weights:
| 10 |
where the parameter α is used to balance the importance between the global similarity and the local similarity.
Step 5: Constructing SVM-based Classification Model
By incorporating positive DTI dataset P, reliable negative DTI dataset RN, the similarity weights of the ambiguous examples in U, we obtained training datasets to learn classification model for novel DTI identification. These training examples may include parts of noisy data. Therefore, we built an SVM with similarity weights (SVM-SW) as our basic classifier to tolerate these noisy examples.
Constructing Classification Model: SVM54 is a powerful tool for data classification. We classified unknown DTIs based on SVM. Suppose that
be training dataset. x i denotes the ith DTI sample and can be represented as a feature vector x i after feature selection in Step 1, y i ∈ {+1, −1}. We can classify the unknown DTIs based on standard SVM:
| 11 |
where ε i is a slack variable of x i and is used to allow for misclassifications in the training examples, and C is used to balance the impact of ε i. The test sample x is viewed as the positive class if w · ϕ(x) + b > 0; otherwise, it is negative.
Combining standard SVM with the similarity weights of the ambiguous samples, we further introduced SVM-SW for finding DTI candidates:
| 12 |
where ε i, ε j, ε m and ε n are the error terms. C 1, C 2, C 3 and C 4 are penalty factors that are used to control the trade-off between margin and misclassification errors. W P(x j)ε j and W N(x m)ε m are errors with different weights. Different W P(x j) and W N(x m) reflect different effects of the parameters ε j and ε m on classification accuracy, respectively. The large value of W P(x j) can increase the effect of ε j; therefore, the ambiguous example x j is more likely to belong to the positive class. Similarly, the smaller value of W N(x m) can reduce the effect of ε m; therefore, x m is less significant toward the negative class.
Solving the Model: The model can be solved based on the method provided by refs 29 and 31. For a test sample x, it is regarded as a positive DTI if w · ϕ(x) + b > 0; otherwise, it is regarded as a negative DTI.
Experimental Setup and Evaluation Metrics
Various performance measures have been proposed to evaluate DTI prediction models. Among these, precision, recall, AUC and F-measure are extensively used. Precision, recall and F-measure26 are computed as equations (13)–(15):
| 13 |
| 14 |
| 15 |
where TP, FP, TN and FN represent true positive, false positive, true negative, and false negative, respectively.
Precision is the percentage of correctly predicted DTIs and is used to measure the distinguished capability of a classifier. Recall is the percentage of successfully predicted DTIs. F-measure is used to evaluate the average classification performance. Either small precision or recall will result in a low F-measure30: therefore, F-measure is used to measure predictive models. AUC is the average area under the receiver operating curve. For these four parameters, higher values exhibit better classification performance. We used these four metrics to evaluate our proposed PUDTI framework.
Acknowledgements
This work is supported by the Program for New Century Excellent Talents in University (Grant NCET-10-0365), National Nature Science Foundation of China (Grant 60973082, 11171369, 61202462, 61272395, 61370171, 61300128, 61572178, 61672223), the National Nature Science Foundation of Hunan province (Grant 12JJ2041, 13JJ3091), the Planned Science and Technology Project of Hunan Province (Grant 2012FJ2012) and the Project of Scientific Research Fund of Hunan Provincial Education Department (Grant 14B023).
Author Contributions
L.P., B.L. and J.Y. wrote the manuscript. L.P. designed the research. W.Z., Y.D., M.C. and Y.C. analyzed the data.
Competing Interests
The authors declare that they have no competing interests.
Footnotes
Publisher's note: Springer Nature remains neutral with regard to jurisdictional claims in published maps and institutional affiliations.
References
- 1.Zhou, H., Gao, M. & Skolnick, J. Comprehensive prediction of drug-protein interactions and side effects for the human proteome. Sci. Rep. 5 (2015). [DOI] [PMC free article] [PubMed]
- 2.Chen, S. et al. Drug target identification using network analysis: Taking active components in sini decoction as an example. Sci. Rep. 6 (2016). [DOI] [PMC free article] [PubMed]
- 3.Chen X, et al. Drug-target interaction prediction: databases, web servers and computational models. Brief. Bioinform. 2016;17:696–712. doi: 10.1093/bib/bbv066. [DOI] [PubMed] [Google Scholar]
- 4.Hao, M., Bryant, S. H. & Wang, Y. Predicting drug-target interactions by dual-network integrated logistic matrix factorization. Sci. Rep. 7 (2017). [DOI] [PMC free article] [PubMed]
- 5.Peng, L., Liao, B., Zhu, W. & Li, Z. Predicting drug-target interactions with neighbor interaction information and discriminative low-rank representation. Curr. Protein Pept. Sci. (2016). [DOI] [PubMed]
- 6.Yuan Q, et al. Druge-rank: improving drug-target interaction prediction of new candidate drugs or targets by ensemble learning to rank. Bioinform. 2016;32:i18–i27. doi: 10.1093/bioinformatics/btw244. [DOI] [PMC free article] [PubMed] [Google Scholar]
- 7.Keiser MJ, et al. Relating protein pharmacology by ligand chemistry. Nature biotechnology. 2007;25:197–206. doi: 10.1038/nbt1284. [DOI] [PubMed] [Google Scholar]
- 8.Cheng AC, et al. Structure-based maximal affinity model predicts small-molecule druggability. Nat. Biotechnol. 2007;25:71–75. doi: 10.1038/nbt1273. [DOI] [PubMed] [Google Scholar]
- 9.Ding H, Takigawa I, Mamitsuka H, Zhu S. Similarity-based machine learning methods for predicting drug-target interactions: a brief review. Brief. in Bioinform. 2014;15:734–747. doi: 10.1093/bib/bbt056. [DOI] [PubMed] [Google Scholar]
- 10.Chen X, Liu M-X, Yan G-Y. Drug-target interaction prediction by random walk on the heterogeneous network. Mol. BioSys. 2012;8:1970–1978. doi: 10.1039/c2mb00002d. [DOI] [PubMed] [Google Scholar]
- 11.Cheng F, et al. Prediction of drug-target interactions and drug repositioning via network-based inference. PLoS Comput Biol. 2012;8:e1002503. doi: 10.1371/journal.pcbi.1002503. [DOI] [PMC free article] [PubMed] [Google Scholar]
- 12.Mousavian Z, Khakabimamaghani S, Kavousi K, Masoudi-Nejad A. Drug-target interaction prediction from pssm based evolutionary information. J. Pharm. Toxicol. Methods. 2016;78:42–51. doi: 10.1016/j.vascn.2015.11.002. [DOI] [PubMed] [Google Scholar]
- 13.Yang K, Bai H, Ouyang Q, Lai L, Tang C. Finding multiple target optimal intervention in disease-related molecular network. Mol. Syst. Biol. 2008;4:228. doi: 10.1038/msb.2008.60. [DOI] [PMC free article] [PubMed] [Google Scholar]
- 14.Campillos M, Kuhn M, Gavin A-C, Jensen LJ, Bork P. Drug target identification using side-effect similarity. Science. 2008;321:263–266. doi: 10.1126/science.1158140. [DOI] [PubMed] [Google Scholar]
- 15.Peng L, Liao B, Zhu W, Li K. Predicting drug-target interactions with multi-information fusion. IEEE J. Biomed. Health Inform. 2017;21:561–572. doi: 10.1109/JBHI.2015.2513200. [DOI] [PubMed] [Google Scholar]
- 16.Mei, J.-P., Kwoh, C.-K., Yang, P. & Li, X.-L. Classification and its applications for drug-target interaction identification. arXiv preprint arXiv:1502.04469 (2015).
- 17.Yamanishi Y, Araki M, Gutteridge A, Honda W, Kanehisa M. Prediction of drug-target interaction networks from the integration of chemical and genomic spaces. Bioinform. 2008;24:i232–i240. doi: 10.1093/bioinformatics/btn162. [DOI] [PMC free article] [PubMed] [Google Scholar]
- 18.Bleakley K, Yamanishi Y. Supervised prediction of drug-target interactions using bipartite local models. Bioinform. 2009;25:2397–2403. doi: 10.1093/bioinformatics/btp433. [DOI] [PMC free article] [PubMed] [Google Scholar]
- 19.Mei J-P, Kwoh C-K, Yang P, Li X-L, Zheng J. Drug-target interaction prediction by learning from local information and neighbors. Bioinform. 2013;29:238–245. doi: 10.1093/bioinformatics/bts670. [DOI] [PubMed] [Google Scholar]
- 20.van Laarhoven T, Nabuurs SB, Marchiori E. Gaussian interaction profile kernels for predicting drug-target interaction. Bioinform. 2011;27:3036–3043. doi: 10.1093/bioinformatics/btr500. [DOI] [PubMed] [Google Scholar]
- 21.Gönen M. Predicting drug-target interactions from chemical and genomic kernels using bayesian matrix factorization. Bioinform. 2012;28:2304–2310. doi: 10.1093/bioinformatics/bts360. [DOI] [PubMed] [Google Scholar]
- 22.Wang Y, Zeng J. Predicting drug-target interactions using restricted boltzmann machines. Bioinform. 2013;29:i126–i134. doi: 10.1093/bioinformatics/btt234. [DOI] [PMC free article] [PubMed] [Google Scholar]
- 23.Cao D-S, et al. Computational prediction of drug-target interactions using chemical, biological, and network features. Mol. Inform. 2014;33:669–681. doi: 10.1002/minf.201400009. [DOI] [PubMed] [Google Scholar]
- 24.Chan, K. C., You, Z.-H. et al. Large-scale prediction of drug-target interactions from deep representations. In Neural Networks (IJCNN), 2016 International Joint Conference on, 1236–1243 (IEEE, 2016).
- 25.Zhang, J., Zhu, M., Chen, P. & Wang, B. Drugrpe: Random projection ensemble approach to drug-target interaction prediction. Neurocomputing (2016).
- 26.Liu H, Sun J, Guan J, Zheng J, Zhou S. Improving compound-protein interaction prediction by building up highly credible negative samples. Bioinform. 2015;31:i221–i229. doi: 10.1093/bioinformatics/btv256. [DOI] [PMC free article] [PubMed] [Google Scholar]
- 27.Chen H, Zhang Z. A semi-supervised method for drug-target interaction prediction with consistency in networks. PloS one. 2013;8:e62975. doi: 10.1371/journal.pone.0062975. [DOI] [PMC free article] [PubMed] [Google Scholar]
- 28.Lan W, et al. Predicting drug–target interaction using positive-unlabeled learning. Neurocomput. 2016;206:50–57. doi: 10.1016/j.neucom.2016.03.080. [DOI] [Google Scholar]
- 29.Xiao, Y. et al. Similarity-based approach for positive and unlabeled learning. In Proceedings-International Joint Conference on Artificial Intelligence, vol. 22, 1577 (2011).
- 30.Li, X., Philip, S. Y., Liu, B. & Ng, S.-K. Positive unlabeled learning for data stream classification. In Proceedings of the 2009 International Conference on Data Mining, vol. 9, 257–268 (SIAM, 2009).
- 31.Ren, Y., Ji, D. & Zhang, H. Positive unlabeled learning for deceptive reviews detection. In Proceddings of the 2014 Empirical Methods on Natural Language, 488–498 (2014).
- 32.Liu, B., Lee, W. S., Yu, P. S. & Li, X. Partially supervised classification of text documents. In Proceedings of the 2002 International Conference on Machine Learning, vol. 2, 387–394 (Citeseer, 2002).
- 33.Li, X. & Liu, B. Learning to classify texts using positive and unlabeled data. In Proceedings of the 2003 International Joint Conference on Artificial Intelligence, vol. 3, 587–592 (2003).
- 34.Xia, Z., Wu, L.-Y., Zhou, X. & Wong, S. T. Semi-supervised drug-protein interaction prediction from heterogeneous biological spaces. In BMC Syst Biol., vol. 4, S6 (BioMed Central Ltd, 2010). [DOI] [PMC free article] [PubMed]
- 35.van Laarhoven T, Marchiori E. Predicting drug-target interactions for new drug compounds using a weighted nearest neighbor profile. PloS one. 2013;8:e66952. doi: 10.1371/journal.pone.0066952. [DOI] [PMC free article] [PubMed] [Google Scholar]
- 36.Wang, Y. et al. Pubchem bioassay: 2014 update. Nucleic Acids Res. gkt978 (2013). [DOI] [PMC free article] [PubMed]
- 37.Izumi-Nakaseko, H. et al. Possibility as an anti-cancer drug of astemizole: Evaluation of arrhythmogenicity by the chronic atrioventricular block canine model. J. Pharm. Sci. (2016). [DOI] [PubMed]
- 38.Law V, et al. Drugbank 4.0: shedding new light on drug metabolism. Nucleic Acids Res.h. 2014;42:D1091–D1097. doi: 10.1093/nar/gkt1068. [DOI] [PMC free article] [PubMed] [Google Scholar]
- 39.Su, G., Morris, J. H., Demchak, B. & Bader, G. D. Biological network exploration with cytoscape 3. Curr. Prot. Bioinform. 8–13 (2014). [DOI] [PMC free article] [PubMed]
- 40.Kuhn, M. et al. Stitch 4: integration of protein-chemical interactions with user data. Nucleic Acids Res. gkt1207 (2013). [DOI] [PMC free article] [PubMed]
- 41.Günther S, et al. Supertarget and matador: resources for exploring drug-target relationships. Nucleic Acids Res. 2008;36:D919–D922. doi: 10.1093/nar/gkm862. [DOI] [PMC free article] [PubMed] [Google Scholar]
- 42.Consortium U, et al. Activities at the universal protein resource (uniprot) Nucleic Acids Res. 2014;42:D191–D198. doi: 10.1093/nar/gkt1140. [DOI] [PMC free article] [PubMed] [Google Scholar]
- 43.Frumovitz M, et al. Identifying therapeutic options in small cell cervical cancer by multiplatform evaluation of biomarker alterations. Gyn. Oncol. 2015;137:169. doi: 10.1016/j.ygyno.2015.01.423. [DOI] [Google Scholar]
- 44.Chatterjee S, et al. Uterine leiomyosarcomas exhibit distinct drug resistance molecular profiles compared to extrauterine leiomyosarcomas: A comprehensive analysis of 1,023 leiomyosarcomas. Gyn. Oncol. 2016;141:51–52. doi: 10.1016/j.ygyno.2016.04.156. [DOI] [Google Scholar]
- 45.Burzawa, J. K. et al. Evaluation of biomarker alterations in small cell cervical cancer identifies therapeutic options (2015).
- 46.Mathur, S. & Dinakarpandian, D. Drug repositioning using disease associated biological processes and network analysis of drug targets. In AMIA Annual Symposium Proceedings. 2011, 305 (American Medical Informatics Association, 2011). [PMC free article] [PubMed]
- 47.Yap CW. Padel-descriptor: An open source software to calculate molecular descriptors and fingerprints. J. Comput. Chem. 2011;32:1466–1474. doi: 10.1002/jcc.21707. [DOI] [PubMed] [Google Scholar]
- 48.Finn, R. D. et al. Pfam: the protein families database. Nucleic Acids Res. gkt1223 (2013). [DOI] [PMC free article] [PubMed]
- 49.Chou K-C. Prediction of protein cellular attributes using pseudo-amino acid composition. Proteins: Struct. Funct. Bioinform. 2001;43:246–255. doi: 10.1002/prot.1035. [DOI] [PubMed] [Google Scholar]
- 50.Gribskov M, McLachlan AD, Eisenberg D. Profile analysis: detection of distantly related proteins. Proceedings of the National Academy of Sciences. 1987;84:4355–4358. doi: 10.1073/pnas.84.13.4355. [DOI] [PMC free article] [PubMed] [Google Scholar]
- 51.Sharma A, Lyons J, Dehzangi A, Paliwal KK. A feature extraction technique using bi-gram probabilities of position specific scoring matrix for protein fold recognition. J. Theor. Biol. 2013;320:41–46. doi: 10.1016/j.jtbi.2012.12.008. [DOI] [PubMed] [Google Scholar]
- 52.Wang, L. et al. Rfdt: A rotation forest-based predictor for predicting drug-target interactions using drug structure and protein sequence information. Curr. Protein Pept. Sci. (2016). [DOI] [PubMed]
- 53.Yang, P., Li, X.-L., Mei, J.-P., Kwoh, C.-K. & Ng, S.-K. Positive-unlabeled learning for disease gene identification. Bioinform. 28, 2640–2647 (2012). [DOI] [PMC free article] [PubMed]
- 54.Vapnik VN. An overview of statistical learning theory. IEEE transactions on neural networks. 1999;10:988–999. doi: 10.1109/72.788640. [DOI] [PubMed] [Google Scholar]


