

Abstract
Aim: Early intervention before the progression of chronic kidney disease (CKD) is essential to prevent end-stage renal disease (ESRD) and cardiovascular complications. This study evaluated the correlation between metabolic and lifestyle-related factors and the decline of estimated glomerular filtration rate (eGFR) over 1 year in a Japanese population without CKD.
Methods: Subjects who received two consecutive annual health checkups from 2013 to 2015 were involved. Factors associated with eGFR decline were identified using multiple regression models.
Results: A total of 2531 subjects aged 58.9 ± 11.7 years old were included in this study. Baseline levels of HDL-C and ApoA1 correlated with the eGFR decline over 1 year defined as eGFR reduction rate of 15% or more and/or eGFR at the next year < 60 ml/min/m2 (odds ratio (OR) 0.87 (per 10 mg/dl); 95% CI, 0.80–0.94; p = 0.0012, 0.90 (per 10 mg/dl); 0.86–0.96; p = 0.0004, respectively). A U-shaped relationship between the eGFR decline and HDL-C or ApoA1 levels was not observed in non-CKD population of this study. Metabolic syndrome was significantly associated with eGFR decline (OR 1.32; 1.04–1.67; p = 0.0205), although obesity-related factors did not show a significant correlation with eGFR decline over 1 year.
Conclusion: Low HDL-C and ApoA1 levels significantly correlated with eGFR decline in a short period of 1 year. Metabolic syndrome also showed a significant association with eGFR decline. This study suggests the importance of hypertension and low HDL-C in the metabolic syndrome effect on eGFR decline rather than obesity in non-CKD population.
Keywords: eGFR decline, HDL-C, ApoA1, Metabolic syndrome
Introduction
Chronic kidney disease (CKD) is increasingly recognized as a global public health problem. The prevalence of CKD is now greater than 10%1), and the number of people requiring renal replacement therapy (RRT) with end-stage renal disease (ESRD) was estimated to be from 4.9 to 9 million worldwide2). CKD is a complicated disease because it leads to ESRD, which requires RRT, such as dialysis, and it also increases the risk of cardiovascular diseases3, 4).
CKD is classified into six grades (1, 2, 3A, 3B, 4, and 5) according to the estimated glomerular filtration rate (eGFR). The 2012 Kidney Disease Outcomes Quality Initiative (KDOQI) guideline stressed the importance of albuminuria in predicting the prognosis of CKD, and CKD stages are now determined according to the eGFR categories (G1–G5) and albuminuria categories (A1–A3)5, 6). The guideline also describes other predictors of CKD progression, including the cause of CKD, age, sex, race, elevated blood pressure, hyperglycemia, dyslipidemia, smoking, obesity, history of cardiovascular disease, and ongoing exposure to nephrotoxic agents; however, the most important factor for prediction of CKD incidence in the population without CKD is unknown, and this factor is crucial for patients to avoid CKD.
Most CKD patients are in the early stages of the disease, and more than 10% of the Japanese population is in the CKD stages G1, G2, or G3A7). Early prevention and diagnosis of CKD is the most effective way to prevent ESRD. A recent report suggests that abnormal kidney function is associated with a higher risk for hospitalization, even for patients in stage 3A CKD8). Therefore, it is necessary to perform early interventions against CKD progression in early stage CKD patients and populations without CKD.
A comprehensive medical check-up system is usually organized in Japan, and it may aid in the primary prevention of cerebrovascular and cardiovascular diseases via control of risk factors9). Many people undergo annual health checkups that include blood and urine examinations and receive explanations of the results, advice on their lifestyles, or suggestions for further examination. Therefore, we obtained numerous data, including lifestyle habits and medications, in a healthy population. Health checkups provide a good opportunity for imparting knowledge of CKD or early diagnosis of CKD among people.
This study investigated the factors associated with an eGFR decline over 1 year, in particular, metabolic factors that are strongly affected by individual lifestyle, in Japanese people who received annual health checkups.
Methods
Study Population
Individuals who experienced thorough medical examinations at Keio University Hospital from January 1, 2013 to December 31, 2015 were enrolled (Fig. 1). We selected 2024 participants who received at least two annual health checkups in 2013 and 2014, and 1110 participants who received two annual health checkups in 2014 and 2015 after exclusion of population overlap during 2013 and 2014. We excluded participants without essential data including age, sex, body mass index (BMI), waist circumference, visceral fat area (VFA), systolic blood pressure (BP), diastolic BP, serum chemistries, computed tomography (CT) scan of the chest and the abdomen, medical history, and lifestyle habit. Individuals with eGFR < 60 ml/min/1.73 m2 and/or with proteinuria were excluded from the study. Finally, data from 2531 participants (1617 males and 914 females) aged between 23 and 89 years were analyzed in this study. Additionally, we selected 1709 participants who received health checkups in 2013 and 2015. After exclusion of subjects with eGFR < 60 ml/min/1.73 m2 and/or with proteinuria, we analyzed the data of 2-year-intervals with 1411 participants to confirm the results in 1 year.
Fig. 1.
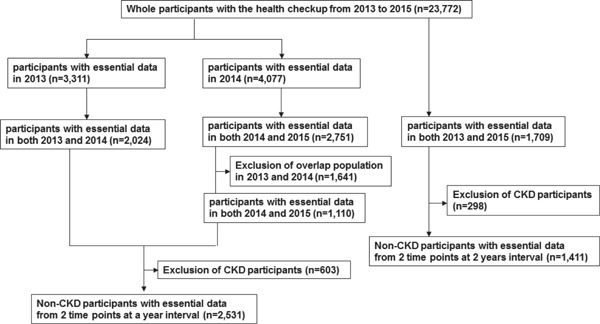
Scheme of inclusion of study population.
Clinical Evaluation and Laboratory Measurements
We examined blood pressure, BMI, and waist circumference at the navel level during minimal respiration. All participants completed a self-administered questionnaire that documented medical history, medication, smoking habit, alcohol consumption habit, the frequency and intensity of daily exercise, eating habits, and sleeping habit. Types of medication for hypertension and dyslipidemia were unknown in 13 and 12 subjects, respectively. Average ethanol consumption per day was approximately calculated as follows: (the frequency of alcohol consumption) × (the amount of alcohol consumed once). Serum markers including triglyceride (TG), high density lipoprotein cholesterol (HDL-C), low density lipoprotein cholesterol (LDL-C), lipoprotein a (Lp(a)), apolipoprotein A1 (ApoA1), apolipoprotein B (ApoB), glucose, hemoglobin A1c (HbA1c), homeostasis model assessment of insulin resistance (HOMA-R), uric acid (UA), and highly sensitive C reactive protein (hs-CRP) were measured. Blood samples were collected after fasting overnight and immediately analyzed using an automated clinical chemical analyzer. We examined urinary protein and blood excretion in urine samples using dipstick testing. VFA was measured at the navel level using a single-slice CT scan (Aquilion CXL; Toshiba Medical Systems Corporation, Tochigi, Japan).
Definitions
Urinary protein and blood excretion was examined using dipstick testing and categorized into 5 degrees; −, ±, 1+, 2+, and 3+. Proteinuria and hematuria were defined as urine protein ≥ 1+ and urine blood ≥ 1+, respectively. CKD was defined as eGFR < 60 ml/min/1.73 m2 and/or the presence of proteinuria. eGFR was calculated using the equation: eGFR (ml/min/1.73 m2) = 194 × serum creatinine (mg/dl) − 1.094 × age (years) − 0.287 × 0.739 (for women)10). Hypertension was defined as systolic BP ≥ 140 mmHg and/or diastolic BP ≥ 90 mmHg or use of antihypertensive drugs in the questionnaire. High BP was defined as systolic BP ≥ 140 mmHg and/or diastolic BP ≥ 90 mmHg. Diabetes was defined in accordance with the guidelines of the American Diabetes Association: fasting glucose concentration ≥ 126 mg/dl, HbA1c level ≥ 6.5%11), or use of antihyperglycemic drugs in the questionnaire. Obesity was defined as BMI ≥ 25 kg/m2. Metabolic syndrome was defined based on the Joint Interim Statement 2009 definition12). Participants having more than three of the following five clinical measures were considered as having metabolic syndrome: (1) central obesity (waist circumference (≥ 90 cm in men, or ≥ 85 cm in women); (2) elevated blood pressure, defined as systolic BP ≥ 130 mmHg or diastolic BP ≥ 85 mmHg, or taking an antihypertensive medication; (3) elevated fasting blood glucose level ≥ 100 mg/dl or taking a hypoglycemic medication; (4) decreased HDL-cholesterol level (< 40 mg/dl in men or < 50 mg/dl in women); and (5) hypertriglyceridemia (≥ 150 mg/dl) or taking a lipid-lowering medication. A change of eGFR was evaluated as ΔeGFR, which was calculated as eGFR in the next year minus eGFR at baseline. Decline of eGFR was evaluated as following criteria: (1) eGFR reduction rate (ΔeGFR/eGFR at baseline × 100) ≤−15%13) and/or (2) eGFR at the next year < 60 ml/min/1.73 m2. In data analysis with 2-year-interval health checkups, we used the following criteria: (1) eGFR reduction rate ≤−30%13) and/or (2) eGFR at the next year < 60 ml/min/1.73 m2.
Statistical Analysis
Factors associated with a decline in eGFR were identified. Factors described as predictors of CKD progression, including age, sex, eGFR, smoking, hypertension, diabetes, obesity, and HDL-C or ApoA1 were included in multivariate regression models. Continuous variables are expressed as the mean ± standard deviation (SD). The significance level for all tests in this study was two-sided 5%. All statistical analyses were performed using JMP version 12 (SAS Institute Inc., Cary, NC, USA).
Results
Participant Characteristics
A total of 23,772 individuals received medical checkups from January 1, 2013 to December 31, 2015. We excluded individuals without the essential data and individuals with CKD as described in the Method section. A total of 2531 participants (1617 males and 914 females) aged 58.9 ± 11.7 years old (range 23–89 years old) were eligible for this study (Fig. 1). Table 1 shows the clinical characteristics of all participants. Additionally, we analyzed the data with 1411 participants who received health checkups in 2-year-intervals to confirm the results over 1 year.
Table 1. Baseline characteristics of all participants.
| Age (y) | 58.9 ± 11.7 |
| Sex (male/female) (male %) | 1617/914 (64%) |
| BMI (kg/m2) | 23.10 ± 3.39 |
| Waist circumference (cm) | 81.77 ± 9.25 |
| Visceral fat area (cm2) | 87.14 ± 46.00 |
| Systolic BP (mmHg) | 119.8 ± 18.2 |
| Diastolic BP (mmHg) | 76.8 ± 11.0 |
| TG (mg/dl) | 109.9 ± 83.4 |
| HDL-C (mg/dl) | 58.0 ± 15.2 |
| LDL-C (mg/dl) | 116.5 ± 28.1 |
| Lp(a) (mg/dl) | 16.1 ± 18.6 |
| ApoA1 (mg/dl) | 147.9 ± 22.0 |
| ApoB (mg/dl) | 85.9 ± 18.7 |
| Glucose (mg/dl) | 107.1 ± 17.8 |
| HbA1c (%) | 5.68 ± 0.59 |
| HOMA-R | 1.51 ± 1.12 |
| UA (mg/dl) | 5.66 ± 1.33 |
| Hs-CRP (mg/dl) | 0.100 ± 0.353 |
| eGFR (ml/min/1.73 m2) | 76.0 ± 12.2 |
| Hematuria | 40 (1.6%) |
| Hypertension | 916 (36%) |
| Medication for hypertension | 618 (24%) |
| ACEI/ARB | 434 (17%) |
| CCB | 393 (16%) |
| Medication for dyslipidemia | 460 (18%) |
| Statin | 381 (15%) |
| Fibrate | 44 (2%) |
| EPA | 55 (2%) |
| Ezetimibe | 42 (2%) |
| Diabetes | 294 (12%) |
| Metabolic syndrome | 293 (12%) |
| History of kidney disease | 2 (0.08%) |
| Lifestyle habits | |
| Current smoker | 321 (13%) |
| Average ethanol consumption (g/day) | 15.7 ± 18.7 |
| Sweating for 30 min ≥ 2 times/week | 961 (38%) |
| Walking ≥ 1 hour/day | 883 (35%) |
| Late evening snack ≥ 3 times/week | 313 (12%) |
| Late dinner ≥ 3 times/week | 540 (21%) |
| Sleeping ≤ 6 hours/day | 1521 (60%) |
BMI, body mass index; BP, blood pressure; TG, triglyceride; HDL-C, high-density lipoprotein cholesterol; LDL-C, low-density lipoprotein cholesterol; Lp(a), lipoprotein a; ApoA1, apolipoprotein A1; ApoB, apolipoprotein B; UA, uric acid; HbA1c, hemoglobin A1c; HOMA-R, homeostasis model assessment of insulin resistance; hs-CRP, highly sensitive C reactive protein; eGFR, estimated glomerular filtration rate; ACEI, angiotensin converting enzyme inhibitor; ARB, angiotensin receptor blocker; CCB, calcium channel blocker; EPA, eicosapentaenoic acid.
Factors Associated with eGFR Decline Over 1 Year in Logistic Regression Models
We examined factors associated with eGFR decline using univariate logistic regression analysis for all factors listed in Table 1 (Suppl Table 1). Decline in eGFR was evaluated using the following definitions: (1) eGFR reduction rate ≤−15% and/or (2) eGFR at the next year < 60 ml/min/1.73 m2 as described in the Methods section. The following factors were significantly associated with eGFR decline: age, systolic BP, HDL-C, ApoA1, HbA1c, eGFR, hypertension, medication for hypertension, use of angiotensin converting enzyme inhibitor (ACEI)/angiotensin receptor blocker (ARB) or calcium channel blocker (CCB), medication for dyslipidemia, use of statin or ezetimibe, diabetes, metabolic syndrome, smoking pattern, alcohol consumption, and exercise habits.
Supplementary Table 1. Univariate logistic regression analysis for associated factors with eGFR decline.
| Factors | OR (95% CI) | p value |
|---|---|---|
| Age (y) | 1.03 (1.02 to 1.04) | < 0.0001 |
| Sex (male/female) (male %) | 1.00 (0.80 to 1.25) | 0.9953 |
| BMI (kg/m2) | 1.01 (0.98 to 1.04) | 0.5416 |
| Waist circumference (cm) | 1.00 (0.99 to 1.02) | 0.5183 |
| Visceral fat area (cm2) | 1.00 (1.00 to 1.00) | 0.2507 |
| Systolic BP (mmHg) | 1.01 (1.00 to 1.01) | 0.0131 |
| Diastolic BP (mmHg) | 1.00 (0.99 to 1.01) | 0.3824 |
| TG (mg/dl) | 1.00 (1.00 to 1.00) | 0.2009 |
| HDL-C (mg/dl) | 0.99 (0.98 to 1.00) | 0.0035 |
| LDL-C (mg/dl) | 1.00 (0.99 to 1.00) | 0.0789 |
| Lp(a) (mg/dl) | 1.00 (0.99 to 1.00) | 0.6688 |
| ApoA1 (mg/dl) | 0.99 (0.99 to 1.00) | 0.0015 |
| ApoB (mg/dl) | 1.00 (0.99 to 1.00) | 0.1786 |
| Glucose (mg/dl) | 1.00 (1.00 to 1.01) | 0.1169 |
| HbA1c (%) | 1.20 (1.01 to 1.42) | 0.0339 |
| HOMA-R | 1.02 (0.92 to 1.12) | 0.6966 |
| UA (mg/dl) | 0.96 (0.86 to 1.04) | 0.3490 |
| Hs-CRP (mg/dl) | 1.18 (0.89 to 1.50) | 0.2248 |
| eGFR (ml/min/1.73 m2) | 0.98 (0.97 to 0.99) | < 0.0001 |
| Hematuria | 1.20 (0.48 to 2.57) | 0.6744 |
| Hypertension | 1.61 (1.29 to 2.01) | < 0.0001 |
| Medication for hypertension | 1.91 (1.51 to 2.41) | < 0.0001 |
| ACEI/ARB | 1.92 (1.48 to 2.47) | < 0.0001 |
| CCB | 1.67 (1.27 to 2.18) | 0.0003 |
| Medication for dyslipidemia | 1.57 (1.20 to 2.04) | 0.0011 |
| Statin | 1.39 (1.04 to 1.84) | 0.0256 |
| Fibrate | 1.46 (0.66 to 2.94) | 0.3318 |
| EPA | 0.82 (0.34 to 1.71) | 0.6195 |
| Ezetimibe | 2.30 (1.12 to 4.42) | 0.0241 |
| Diabetes | 1.68 (1.23 to 2.26) | 0.0011 |
| Metabolic syndrome | 1.41 (1.12 to 1.77) | 0.0038 |
| History of kidney disease | 0.18 (0.01 to 4.49) | 0.2474 |
| Lifestyle habits | ||
| Current smoking | 0.68 (0.47 to 0.97) | 0.0317 |
| Average ethanol consumption (g/day) | 0.99 (0.99 to 1.00) | 0.0149 |
| Sweating for 30 min ≥ 2 times/week | 1.28 (1.02 to 1.59) | 0.0311 |
| Walking more than 1 hour/day | 1.44 (1.15 to 1.80) | 0.0014 |
| Late evening snack ≥ 3 times/week | 0.99 (0.71 to 1.37) | 0.9767 |
| Late dinner ≥ 3 times/week | 0.86 (0.65 to 1.13) | 0.2727 |
| Sleeping ≤ 6 hours/day | 0.89 (0.71 to 1.11) | 0.2951 |
Bold values indicate significant differences. OR, odds ratio; CI, confidence interval; BMI, body mass index; BP, blood pressure; TG, triglyceride; HDL-C, high-density lipoprotein cholesterol; LDL-C, low-density lipoprotein cholesterol; Lp(a), lipoprotein a; ApoA1, apolipoprotein A1; ApoB, apolipoprotein B; UA, uric acid; HbA1c, hemoglobin A1c; HOMA-R, homeostasis model assessment of insulin resistance; hs-CRP, highly sensitive C reactive protein; eGFR, estimated glomerular filtration rate; ACEI, angiotensin converting enzyme inhibitor; ARB, angiotensin receptor blocker; CCB, calcium channel blocker; EPA, eicosapentaenoic acid.
Furthermore, we performed logistic regression analysis for these identified factors adjusted by known factors with CKD progression, including age, sex, eGFR, smoking pattern, hypertension, diabetes, obesity, and HDL-C or ApoA1 levels (Table 2). ApoA1 is the major protein component of HDL-C in plasma, and we confirmed that the ApoA1 level was correlated with HDL-C level using Pearson's correlation coefficient (r = 0.912, p < 0.0001, Fig. 2). Therefore, we used either HDL-C or ApoA1 as a variable in the multiple regression analysis. Hypertension, diabetes, and obesity were defined as described in the Methods section. Baseline levels of HDL-C and ApoA1 significantly correlated with the eGFR decline (odds ratio (OR) 0.87 (per 10 mg/dl); 95% CI, 0.80–0.94; p = 0.0012, 0.90 (per 10 mg/dl); 0.86–0.96; p = 0.0004, respectively). Hypertension and diabetes were also significantly associated with the eGFR decline. Considering lifestyle habits, walking for more than 1 h/day was significantly associated with eGFR decline, and average ethanol consumption more than 40 g/day showed marginal significance (p = 0.0546).
Table 2. Factors associated with eGFR decline over one year in non-CKD participants at baseline using multivariate logistic regression analysis.
| eGFR decline (n = 382) |
||||
|---|---|---|---|---|
| Model 1 |
Model 2 |
|||
| OR (95% CI) | P value | OR (95% CI) | P value | |
| HDL-C (per 10 mg/dl) | 0.87 (0.80 to 0.94) | 0.0012 | 0.86 (0.79 to 0.94) | 0.0009 |
| Hypertension | 1.35 (1.06 to 1.71) | 0.0054 | 1.40 (1.10 to 1.79) | 0.0066 |
| Diabetes | 1.48 (1.07 to 2.03) | 0.0169 | 1.46 (1.05 to 1.99) | 0.0230 |
| Obesity | 0.84 (0.64 to 1.10) | 0.2134 | 0.87 (0.66 to 1.14) | 0.3118 |
| Current smoking | 0.75 (0.51 to 1.08) | 0.1292 | 0.79 (0.53 to 1.15) | 0.2194 |
| Average ethanol consumption < 40g/day | – | 1.41 (0.99 to 2.06) | 0.0546 | |
| Walking ≥ 1 hour/day | – | 1.37 (1.07 to 1.76) | 0.0115 | |
| Sweating for 30 min ≥ 2 times/week | – | 1.06 (0.83 to 1.36) | 0.6160 | |
Bold values indicate significant differences. OR, odds ratio; CI, confidence interval; HDL-C, high-density lipoprotein cholesterol. Multivariate logistic regression analyses were performed for factors described as predictors of CKD progression, including age, sex, eGFR, current smoking, hypertension, diabetes, obesity, and HDL-C (model 1), and for factors described above, average ethanol consumption < 40 g/day, walking ≥ 1 hour/day, and sweating for 30 min ≥ 2 times/week (model 2).
Fig. 2.
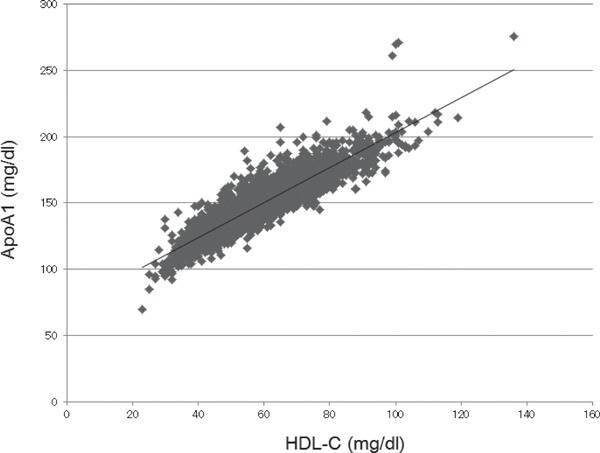
Correlation between HDL-C and ApoA1 levels.
As shown in Table 3, medication for hypertension showed a significant association with the eGFR decline (OR 1.57; 1.21–2.03; p = 0.0007), whereas high BP did not show a significant association with the eGFR decline when we used “high BP” and “medication for hypertension” as independent variables instead of “hypertension.” Considering classes of antihypertensive drugs, use of ACEI/ARB or CCB was significantly associated with the eGFR decline (OR 1.64; 1.25–2.14; p = 0.0004, OR 1.38; 1.04–1.83; p = 0.0284, respectively). Medication for dyslipidemia did not show a significant association with the eGFR decline. When we used HbA1c and medication for diabetes as independent variables instead of “diabetes,” each variable did not show a statistical significance.
Table 3. Effect of medications for dyslipidemia, hypertension and diabetes with eGFR decline in non-CKD participants at baseline.
| eGFR decline (n = 382) |
||
|---|---|---|
| OR (95% CI) | P value | |
| Medication for dyslipidemia | 1.19 (0.89 to 1.57) | 0.2389 |
| Medication for hypertension | 1.57 (1.21 to 2.03) | 0.0007 |
| ACEI/ARB | 1.64 (1.25 to 2.14) | 0.0004 |
| CCB | 1.38 (1.04 to 1.83) | 0.0284 |
| Medication for diabetes | 1.23 (0.73 to 2.04) | 0.4238 |
Bold values indicate significant differences. OR, odds ratio; CI, confidence interval; ACEI, angiotensin converting enzyme inhibitor; ARB, angiotensin receptor blocker; CCB, calcium channel blocker. Multivariate logistic regression analyses were adjusted for factors described as predictors of CKD progression, including age, sex, eGFR, current smoking, hypertension, diabetes, obesity, and HDL-C or ApoA1. For analysis of medication for hypertension, high BP defined in the Method section was used as an independent variable instead of hypertension. For analysis of medication for diabetes, HbA1c level was used as an independent variable instead of diabetes.
We also examined the relationship between metabolic syndrome and eGFR decline. Metabolic syndrome, as defined in the Method section, was significantly associated with eGFR decline using multiple regression model adjusted for age, sex, eGFR, and smoking (OR 1.32; 1.04–1.67; p = 0.0205). Among parameters included in the criteria for metabolic syndrome, elevated BP was significantly associated with eGFR decline, and decreased HDL-C showed a marginal significance (central obesity, OR 1.10; 0.84–1.45; p = 0.4593; elevated blood pressure or taking antihypertensive medications, OR 1.27; 1.00–1.61; p = 0.0486; elevated fasting blood glucose level or taking a hypoglycemic medication, OR 0.97; 0.75–1.25; p = 0.8006; decreased HDL-cholesterol level, OR 1.26; 0.91–1.71; p = 0.1559; and hypertriglyceridemia or taking lipid-lowering medications, OR 1.10; 0.86– 1.40; p = 0.4572).
Based on these results, we performed a stratification analysis of continuous variables, including HDL-C and ApoA1. We categorized participants into six groups according to the serum HDL-C level (HDL-C < 40, 40–49, 50–59, 60–69, 70–79, and ≥ 80 mg/dl; N = 239, 581, 683, 459, 334, and 235, respectively). Individuals with HDL-C ≥ 80 mg/dl exhibited the lowest odds of the eGFR decline in 1 year. Participants with HDL-C < 60 mg/dl exhibited significantly elevated eGFR decline odds over 1 year (Table 4). We also categorized participants into five groups according to serum ApoA1 level (ApoA1 < 120, 120–139, 140–159, 160–179, and > 180 mg/dl; N = 212, 742, 868, 500, and 209, respectively). Individuals with ApoA1 > 180 mg/dl exhibited the lowest odds of the eGFR decline, and participants with ApoA1 < 160 mg/dl demonstrated significantly elevated odds of the eGFR decline in 1 year (Table 5).
Table 4. Association between HDL-C and decline in eGFR using multivariate logistic regression analysis.
| eGFR decline |
|||
|---|---|---|---|
| HDL-C (mg/dl) | OR (95% CI) | P value | |
| < 40 | N = 239 | 2.12 (1.20 to 3.81) | 0.0099 |
| 40–49 | N = 581 | 1.81 (1.11 to 3.06) | 0.0172 |
| 50–59 | N = 683 | 1.86 (1.17 to 3.08) | 0.0086 |
| 60–69 | N = 459 | 1.57 (0.96 to 2.64) | 0.0717 |
| 70–79 | N = 334 | 1.28 (0.75 to 2.21) | 0.3682 |
| 80 ≤ | N = 235 | 1 | – |
Bold values indicate significant differences. HDL-C, high-density lipoprotein cholesterol; OR, odds ratio; CI, confidence interval. Multivariable logistic analyses were adjusted for factors, including age, sex, eGFR, current smoking, hypertension, diabetes, and obesity.
Table 5. Association between ApoA1 and decline in eGFR using multivariate logistic regression analysis.
| eGFR decline |
|||
|---|---|---|---|
| ApoA1 (mg/dl) | OR (95% CI) | P value | |
| < 120 | N = 212 | 1.77 (0.96 to 3.31) | 0.0652 |
| 120–139 | N = 742 | 2.06 (1.26 to 3.50) | 0.0033 |
| 140–159 | N = 868 | 1.80 (1.12 to 3.03) | 0.0147 |
| 160–179 | N = 500 | 1.32 (0.79 to 2.28) | 0.2935 |
| 180 ≤ | N = 209 | 1 | – |
Bold values indicate significant differences. ApoA1, apolipoprotein A1; OR, odds ratio; CI, confidence interval. Multivariable logistic analyses were adjusted for factors, including age, sex, eGFR, current smoking, hypertension, diabetes, and obesity.
Since average ethanol consumption < 40 g/day showed marginal significance in association with eGFR decline using multiple logistic regression analysis, we also categorized participants into four categories according to average ethanol consumption per day (ethanol < 20, 20–39, 40–59, and > 60 g/day; N = 1664, 489, 301, and 77, respectively) to evaluate appropriate amount of alcohol for kidney function. Ethanol consumption 40–59 g/day exhibited the lowest odds of the eGFR decline, and participants with ethanol consumption less than 40 g/day showed elevated odds of the eGFR decline (Table 6).
Table 6. Association between average alcohol consumption and decline in eGFR using multivariate logistic regression analysis.
| eGFR decline |
|||
|---|---|---|---|
| Ethanol (g/day) | OR (95% CI) | P value | |
| < 20 | N = 1664 | 1.57 (1.04 to 2.44) | 0.0296 |
| 20–39 | N = 489 | 1.61 (1.03 to 2.59) | 0.0381 |
| 40–59 | N = 301 | 1 | – |
| 60 ≤ | N = 77 | 1.67 (0.76 to 3.48) | 0.1930 |
Bold values indicate significant differences. OR, odds ratio; CI, confidence interval. Multivariable logistic analyses were adjusted for factors, including age, sex, eGFR, current smoking, hypertension, diabetes, obesity, and HDL-C.
Factors Associated with eGFR Decline Over 1 Year in a Linear Regression Model
We examined factors associated with changes in eGFR in 1 year using linear regression analysis for all factors listed in Table 1. Age, sex, and baseline eGFR were included in the model as covariates. A change of eGFR was evaluated as ΔeGFR and calculated as eGFR in the next year—eGFR at baseline. The average of ΔeGFR was −2.8 ± 7.4 ml/min/1.73 m2. HDL-C and ApoA1 levels and average ethanol consumption were significantly associated with ΔeGFR in the analysis (β = 0.04; p = 0.0002, β = 0.03; p < 0.0001, β = 0.02; p = 0.0114, respectively).
We next investigated factors associated with ΔeGFR using multivariate linear regression analysis adjusted for factors that were related to the progression of CKD clinically, including age, sex, eGFR, smoking, hypertension, diabetes, obesity, and these identified factors, including HDL-C or ApoA1 levels and average ethanol consumption per day. The analysis revealed that each 10 mg/dl decrease in HDL-C and ApoA1 levels was associated with a 0.34 and 0.32 ml/min/1.73 m2 decrease in eGFR in 1 year, respectively (95% CI, 0.14–0.55; 0.18–0.46, p = 0.0012; p < 0.0001, respectively). Each 10 g/day increase in average ethanol consumption was associated with a 0.17 ml/min/1.73 m2 increase in eGFR when adjusted for factors including age, sex, eGFR, smoking, HDLC, hypertension, diabetes, and obesity (p = 0.0357). Exercise habits, which showed a significant association with eGFR decline in logistic regression model, were not associated with eGFR decline in the linear regression model.
Factors Associated with eGFR Decline in 2 Years Using Logistic Regression Model
Moreover, we examined associated factors with eGFR decline in population with 2-year-interval health checkups using multiple logistic regression models to confirm these results over 1 year (Suppl Table 2). Decline in eGFR was evaluated as described in the Method section. HDL-C and ApoA1 levels were significantly correlated with eGFR decline over 2 years (OR 0.86 per 10 mg/dl; 0.75–0.99; p = 0.0363; OR 0.89 per 10 mg/dl; 0.81–0.98; p = 0.0209, respectively). Medication for hypertension was not significantly associated with eGFR decline, whereas high BP was correlated with eGFR decline over 2 years (OR 1.02; 0.69–1.52; p = 0.9391, OR 1.55; 1.01–2.35; p = 0.0455, respectively). Metabolic syndrome was significantly associated with eGFR decline over 2 years using a multiple regression model adjusted for age, sex, eGFR at baseline, and smoking (OR 1.49; 1.01–2.18; p = 0.0453).
Supplementary Table 2. Factors associated with eGFR decline over two years in non-CKD participants at baseline using multivariate logistic regression analysis.
| eGFR decline (n = 163) |
||||
|---|---|---|---|---|
| Model 1 |
Model 2 |
|||
| OR (95% CI) | P value | OR (95% CI) | P value | |
| HDL-C (per 10 mg/dl) | 0.89 (0.81 to 0.98) | 0.0363 | 0.87 (0.75 to 1.00) | 0.0470 |
| Hypertension | 1.22 (0.83 to 1.78) | 0.3115 | 1.23 (0.84 to 1.81) | 0.2822 |
| Diabetes | 1.25 (0.72 to 2.09) | 0.4181 | 1.26 (0.73 to 2.12) | 0.3956 |
| Obesity | 0.88 (0.57 to 1.34) | 0.5494 | 0.88 (0.57 to 1.36) | 0.5756 |
| Current smoking | 1.53 (0.81 to 2.78) | 0.1879 | 1.55 (0.82 to 2.84) | 0.1742 |
| Average ethanol consumption < 40 g/day | – | 1.37 (0.74 to 2.69) | 0.3248 | |
| Walking ≥ 1 hour/day | – | 1.02 (0.70 to 1.48) | 0.9085 | |
| Sweating for 30 min ≥ 2 times/week | – | 0.85 (0.59 to 1.23) | 0.3892 | |
Bold values indicate significant differences. OR, odds ratio; CI, confidence interval; HDL-C, high-density lipoprotein cholesterol. Multivariate logistic regression analyses were adjusted for factors described as predictors of CKD progression, including age, sex, eGFR, current smoking, hypertension, diabetes, obesity, and HDL-C (model 1), and for factors described above, average ethanol consumption < 40 g/day, walking ≥ 1 hour/day, and sweating for 30 min ≥ 2 times/week (model 2).
Discussion
This study investigated metabolic factors associated with a decline in eGFR over 1 year in a Japanese population receiving health checkup, and these results were confirmed in a population with 2-year-interval health checkups. All subjects in this study were without CKD at baseline. This study revealed the following novel and interesting findings. (1) The levels of HDL-C and ApoA1 negatively correlated with eGFR decline even in a short period of 1 year and it was confirmed in a population with 2-year-interval health checkups. (2) Individuals with HDL-C ≥ 80 mg/dl and ApoA1 ≥ 160 mg/dl exhibited the lowest odds of the eGFR decline, and a U-shaped relationship between these levels and eGFR decline was not observed in non-CKD participants in this study. (3) Metabolic syndrome was associated with eGFR decline, although obesity-related parameters did not show a significant correlation with eGFR decline in the non-CKD population. (4) Low alcohol consumption, exercise habits, and medication for hypertension were independent factors associated with the eGFR decline in 1 year.
The relation of dyslipidemia with CKD incidence in the general population was investigated in several studies14–17). These studies demonstrated that low HDL-C and ApoA1 levels were associated with CKD progression. Serum HDL-C and ApoA1 levels were significantly associated with the eGFR decline in this study, as previously reported. Notably, this study showed the effect of HDL-C and ApoA1 on changes in eGFR in a short period of 1 year in non-CKD population. Recently, B. Bowe et al. reported that the relationship between HDL-C levels and renal outcomes exhibits a U-shaped relationship, in which risk increases with low and high levels of HDL-C18). The lowest risk of doubling of creatinine, greater than 30% decline in eGFR and outcome of end-stage renal disease was observed around 40–50 mg/dl of HDL-C in the cohort study. In this study, individuals with HDL-C ≥ 80 mg/dl exhibited the lowest odds of the eGFR decline. The discrepancy may be caused by several reasons, including differences in the observational period, race, and baseline eGFR. All participants showed baseline eGFR greater than 60 ml/min/1.73 m2 in this study, whereas 77% of participants showed in the cohort. It was recently reported that HDL-C in lower eGFR attenuated the salutary association of HDL-C and risk of death19, 20), which suggest the possibility that HDL-C in lower eGFR also attenuated the salutary effect of HDL-C on eGFR decline. Therefore, higher eGFR at baseline in this study may cause higher HDL-C level with lowest odds of an eGFR decline in 1 year. These results suggest that it may be necessary to set different target levels of HDL-C according to eGFR levels in order to avoid rapid eGFR decline, although further studies are necessary to determine the appropriate values with the smallest decline in eGFR over a longer period of time.
A beneficial HDL may degenerate to a dysfunctional HDL according to the oxidative condition or systemic inflammation, which may result in functional impairment of the antiatherogenic properties of HDL-C and lead to microvascular diseases and renal dysfunction with extremely high HDL-C21–23). Quantitative (i.e., serum concentration of HDL-C) and qualitative assessment of HDL, such as antiatherogenic or proatherogenic, HDL subclasses, or HDL composition, may be essential to evaluate the real role of HDL in this relatively healthy population, since it was reported that the levels of HDL subfractions and their oxidized subfraction particles differed according to CKD severity24). Our clinical data lack these functional properties of HDL, and we cannot discuss these issues.
Metabolic syndrome is associated with an increased risk of renal injury and is an essential predictor of CKD25, 26); however, it is difficult to elucidate whether the renal dysfunction is due to the syndrome itself or the individual risk factors. Metabolic syndrome was significantly associated with eGFR decline in non-CKD participants in this study. Interestingly, the obesity-related factors, including BMI, VFA, waist circumference, and the criteria of central obesity that were used in diagnosis of the syndrome, were not associated with eGFR decline. Among parameters included in the criteria for metabolic syndrome, elevated BP was significantly associated with eGFR decline, and low HDL-C showed a marginal significance. These results suggest the importance of hypertension and low HDL-C on the effect of metabolic syndrome on eGFR decline, rather than obesity, in non-CKD population.
This study demonstrated correlations between eGFR decline and medications for hypertension. Medications for hypertension were associated with eGFR decline when it was included as an independent variable in multivariate regression analysis, whereas high BP was not significantly associated with eGFR decline in the analysis. These results suggest that medication for hypertension may be related to eGFR decline in a short observation of 1 year in non-CKD subjects, which is different from previous reports including CKD patients27); however, it was not significantly associated with eGFR decline in 2 years. Although there was a limitation that it was difficult to obtain accurate information of medication, such as doses and durations of these drugs in the questionnaire, it is suggested that careful observation in eGFR decline may be needed in non-CKD patients with antihypertensive drugs. Medications for dyslipidemia were not significantly associated with an eGFR decline in non-CKD participants, consistent with previous reports28).
Lifestyle alternations are important to improve dyslipidemia. Average ethanol consumption per day was significantly associated with eGFR decline in 1 year, which suggests that alcohol consumption partially contributes to a lower decline of eGFR due to elevated HDL-C and ApoA1 levels in non-CKD participants. The effect of alcohol consumption on eGFR decline was controversial. Some studies reported that no association was observed in alcohol intake with the occurrence and progression of CKD29, 30), and others described that low alcohol consumption (20–140 g ethanol/week) was associated with an eGFR reduction of 25% in 3 years31), and that the risk of an eGFR decline was reduced in the subjects drinking alcohol with 23.0–69.0 g ethanol/drinking day and 4–7 times a week32). Low alcohol consumption was associated with an eGFR decline in non-CKD participants of this study and alcohol consumption of 40–59 g/day exhibited the lowest odds of the eGFR decline. Therefore, these results suggested that it was advisable to consume less than 60 g of alcohol per day in the non-CKD population for better kidney function; however, in clinical settings, an appropriate amount of alcohol consumption should be determined based on its influence on the kidney function and other organs, including liver, and metabolism of the person.
Exercise ameliorates metabolic factors associated with development of CKD; however there are no published guidelines to demonstrate the effect of exercise on prevention of CKD33). Recent study suggested that exercise was associated with a lower GFR, and a lower prevalence of proteinuria and eGFR < 45 ml/min/1.73 m2 34). Another report has shown that moderate to vigorous physical activity was not associated with kidney function35). In this study, walking for more than 1 h/day was significantly associated with eGFR decline in 1 year, but not in 2 years, in non-CKD population. The possible reasons may be a short observation period, limitation in evaluation of data from the questionnaire, and different settings in renal outcome. Future studies are necessary to evaluate and validate these results.
There are some limitations in this study. First, it is difficult to show that low HDL-C and ApoA1 levels are the cause or the result of eGFR decline in this observational study. Interventional study that examines the effect of amelioration of HDL-C and ApoA1 levels on eGFR decline is needed in the future. Second, selection bias may exist because participants who receive annual health checkups may be interested in the management of their health. Third, proteinuria was not included in renal outcome, because only 20 participants showed proteinuria in the following year. Moreover, well-known factors associated with CKD progression, such as UA36) and hs-CRP37), were not significantly associated with eGFR decline in 1 year. These factors may affect the change of eGFR with longer time observation, and further examination is needed.
In summary, this study demonstrated that HDL-C and ApoA1 levels negatively correlated with eGFR decline during a short period of only 1 year in non-CKD subjects. Metabolic syndrome also showed a significant association with eGFR decline. This study suggests the importance of hypertension and low HDL-C in the metabolic syndrome effect on eGFR decline rather than obesity in non-CKD population. Based on these results, monitoring of metabolic factors especially HDL-C and hypertension is important for the prevention of a rapid decline in eGFR and the occurrence of CKD in non-CKD population.
Acknowledgments
This study was supported by Grants for Scientific Research (16K19496) from the Ministry of Education, Culture, Sports, Science and Technology (MEXT) of Japan.
Disclosure
The authors declare no conflicts of interest related to this study.
Ethical Statement and Informed Consent
General informed consent was obtained because this study was a non-invasive retrospective study. The records of participants were anonymized and de-identified prior to analysis. The ethics committee of the Keio University School of Medicine approved the study protocol (No.20140329).
References
- 1). Szczech LA, Harmon W, Hostetter TH, Klotman PE, Powe NR, Sedor JR, Smedberg P, Himmelfarb J: World Kidney Day 2009: problems and challenges in the emerging epidemic of kidney disease. J Am Soc Nephrol, 2009; 20: 453-455 [DOI] [PubMed] [Google Scholar]
- 2). Garcia-Garcia G, Jha V: World Kidney Day 2015: CKD in disadvantaged populations. Am J Kidney Dis, 2015; 65: 349-353 [DOI] [PubMed] [Google Scholar]
- 3). K/DOQI clinical practice guidelines for chronic kidney disease: evaluation, classification, and stratification. Am J Kidney Dis, 2002; 39: S1-266 [PubMed] [Google Scholar]
- 4). Sarnak MJ, Levey AS, Schoolwerth AC, Coresh J, Culleton B, Hamm LL, McCullough PA, Kasiske BL, Kelepouris E, Klag MJ, Parfrey P, Pfeffer M, Raij L, Spinosa DJ, Wilson PW: Kidney disease as a risk factor for development of cardiovascular disease: a statement from the American Heart Association Councils on Kidney in Cardiovascular Disease, High Blood Pressure Research, Clinical Cardiology, and Epidemiology and Prevention. Circulation, 2003; 108: 2154-2169 [DOI] [PubMed] [Google Scholar]
- 5). Inker LA, Astor BC, Fox CH, Isakova T, Lash JP, Peralta CA, Kurella Tamura M, Feldman HI: KDOQI US commentary on the 2012 KDIGO clinical practice guideline for the evaluation and management of CKD. Am J Kidney Dis, 2014; 63: 713-735 [DOI] [PubMed] [Google Scholar]
- 6). Levin A, Stevens PE: Summary of KDIGO 2012 CKD Guideline: behind the scenes, need for guidance, and a framework for moving forward. Kidney Int, 2014; 85: 49-61 [DOI] [PubMed] [Google Scholar]
- 7). Japan nephrology s: [Special issue: Clinical practice guidebook for diagnosis and treatment of chronic kidney disease 2012]. Nihon Jinzo Gakkai Shi, 2012; 54: 1034-1191 [PubMed] [Google Scholar]
- 8). Xie Y, Bowe B, Xian H, Balasubramanian S, Al-Aly Z: Rate of Kidney Function Decline and Risk of Hospitalizations in Stage 3A CKD. Clin J Am Soc Nephrol, 2015; 10: 1946-1955 [DOI] [PMC free article] [PubMed] [Google Scholar]
- 9). Ikeda N, Saito E, Kondo N, Inoue M, Ikeda S, Satoh T, Wada K, Stickley A, Katanoda K, Mizoue T, Noda M, Iso H, Fujino Y, Sobue T, Tsugane S, Naghavi M, Ezzati M, Shibuya K: What has made the population of Japan healthy? Lancet, 2011; 378: 1094-1105 [DOI] [PubMed] [Google Scholar]
- 10). Matsuo S, Imai E, Horio M, Yasuda Y, Tomita K, Nitta K, Yamagata K, Tomino Y, Yokoyama H, Hishida A: Revised equations for estimated GFR from serum creatinine in Japan. Am J Kidney Dis, 2009; 53: 982-992 [DOI] [PubMed] [Google Scholar]
- 11). Diagnosis and classification of diabetes mellitus. Diabetes Care, 2010; 33 Suppl 1: S62-69 [DOI] [PMC free article] [PubMed] [Google Scholar]
- 12). Alberti KG, Eckel RH, Grundy SM, Zimmet PZ, Cleeman JI, Donato KA, Fruchart JC, James WP, Loria CM, Smith SC, Jr., International Diabetes Federation Task Force on E, Prevention, Hational Heart L, Blood I, American Heart A, World Heart F, International Atherosclerosis S and International Association for the Study of O : Harmonizing the metabolic syndrome: a joint interim statement of the International Diabetes Federation Task Force on Epidemiology and Prevention; National Heart, Lung, and Blood Institute; American Heart Association; World Heart Federation; International Atherosclerosis Society; and International Association for the Study of Obesity. Circulation, 2009; 120: 1640-1645 [DOI] [PubMed] [Google Scholar]
- 13). Coresh J, Turin TC, Matsushita K, Sang Y, Ballew SH, Appel LJ, Arima H, Chadban SJ, Cirillo M, Djurdjev O, Green JA, Heine GH, Inker LA, Irie F, Ishani A, Ix JH, Kovesdy CP, Marks A, Ohkubo T, Shalev V, Shankar A, Wen CP, de Jong PE, Iseki K, Stengel B, Gansevoort RT, Levey AS, Consortium CKDP : Decline in estimated glomerular filtration rate and subsequent risk of end-stage renal disease and mortality. JAMA, 2014; 311: 2518-2531 [DOI] [PMC free article] [PubMed] [Google Scholar]
- 14). Fox CS, Larson MG, Leip EP, Culleton B, Wilson PW, Levy D: Predictors of new-onset kidney disease in a community-based population. JAMA, 2004; 291: 844-850 [DOI] [PubMed] [Google Scholar]
- 15). Schaeffner ES, Kurth T, Curhan GC, Glynn RJ, Rexrode KM, Baigent C, Buring JE, Gaziano JM: Cholesterol and the risk of renal dysfunction in apparently healthy men. J Am Soc Nephrol, 2003; 14: 2084-2091 [DOI] [PubMed] [Google Scholar]
- 16). Muntner P, Coresh J, Smith JC, Eckfeldt J, Klag MJ: Plasma lipids and risk of developing renal dysfunction: the atherosclerosis risk in communities study. Kidney Int, 2000; 58: 293-301 [DOI] [PubMed] [Google Scholar]
- 17). Tsuruya K, Yoshida H, Nagata M, Kitazono T, Iseki K, Iseki C, Fujimoto S, Konta T, Moriyama T, Yamagata K, Narita I, Kimura K, Kondo M, Asahi K, Kurahashi I, Ohashi Y, Watanabe T: Impact of the Triglycerides to High-Density Lipoprotein Cholesterol Ratio on the Incidence and Progression of CKD: A Longitudinal Study in a Large Japanese Population. Am J Kidney Dis, 2015; 66: 972-983 [DOI] [PubMed] [Google Scholar]
- 18). Bowe B, Xie Y, Xian H, Balasubramanian S, Al-Aly Z: Low levels of high-density lipoprotein cholesterol increase the risk of incident kidney disease and its progression. Kidney Int, 2016; 89: 886-896 [DOI] [PubMed] [Google Scholar]
- 19). Zewinger S, Speer T, Kleber ME, Scharnagl H, Woitas R, Lepper PM, Pfahler K, Seiler S, Heine GH, Marz W, Silbernagel G, Fliser D: HDL cholesterol is not associated with lower mortality in patients with kidney dysfunction. J Am Soc Nephrol, 2014; 25: 1073-1082 [DOI] [PMC free article] [PubMed] [Google Scholar]
- 20). Bowe B, Xie Y, Xian H, Balasubramanian S, M AZ, Al-Aly Z: High Density Lipoprotein Cholesterol and the Risk of All-Cause Mortality among U.S. Veterans. Clin J Am Soc Nephrol, 2016; [DOI] [PMC free article] [PubMed] [Google Scholar]
- 21). Ansell BJ, Fonarow GC, Fogelman AM: The paradox of dysfunctional high-density lipoprotein. Curr Opin Lipidol, 2007; 18: 427-434 [DOI] [PubMed] [Google Scholar]
- 22). Huang Y, DiDonato JA, Levison BS, Schmitt D, Li L, Wu Y, Buffa J, Kim T, Gerstenecker GS, Gu X, Kadiyala CS, Wang Z, Culley MK, Hazen JE, Didonato AJ, Fu X, Berisha SZ, Peng D, Nguyen TT, Liang S, Chuang CC, Cho L, Plow EF, Fox PL, Gogonea V, Tang WH, Parks JS, Fisher EA, Smith JD, Hazen SL: An abundant dysfunctional apolipoprotein A1 in human atheroma. Nat Med, 2014; 20: 193-203 [DOI] [PMC free article] [PubMed] [Google Scholar]
- 23). Huang Y, Wu Z, Riwanto M, Gao S, Levison BS, Gu X, Fu X, Wagner MA, Besler C, Gerstenecker G, Zhang R, Li XM, DiDonato AJ, Gogonea V, Tang WH, Smith JD, Plow EF, Fox PL, Shih DM, Lusis AJ, Fisher EA, DiDonato JA, Landmesser U, Hazen SL: Myeloperoxidase, paraoxonase-1, and HDL form a functional ternary complex. J Clin Invest, 2013; 123: 3815-3828 [DOI] [PMC free article] [PubMed] [Google Scholar]
- 24). Honda H, Hirano T, Ueda M, Kojima S, Mashiba S, Hayase Y, Michihata T, Shibata T: High-Density Lipoprotein Subfractions and Their Oxidized Subfraction Particles in Patients with Chronic Kidney Disease. J Atheroscler Thromb, 2016; 23: 81-94 [DOI] [PubMed] [Google Scholar]
- 25). Locatelli F, Pozzoni P, Del Vecchio L: Renal manifestations in the metabolic syndrome. J Am Soc Nephrol, 2006; 17: S81-85 [DOI] [PubMed] [Google Scholar]
- 26). Tanaka H, Shiohira Y, Uezu Y, Higa A, Iseki K: Metabolic syndrome and chronic kidney disease in Okinawa, Japan. Kidney Int, 2006; 69: 369-374 [DOI] [PubMed] [Google Scholar]
- 27). Kanda D, Takumi T, Miyata M, Tokushige A, Sonoda T, Yoshino S, Saihara K, Ohishi M: Angiotensin-Converting Enzyme Inhibitor Prevents the Worsening of Renal Function in the Late Phase after Percutaneous Coronary Intervention. J Atheroscler Thromb, 2016; 23: 233-240 [DOI] [PubMed] [Google Scholar]
- 28). Abe M, Maruyama N, Maruyama T, Okada K, Soma M: A Trial of Pitavastatin Versus Rosuvastatin for Dyslipidemia in Chronic Kidney Disease. J Atheroscler Thromb, 2015; 22: 1235-1247 [DOI] [PubMed] [Google Scholar]
- 29). Foster MC, Hwang SJ, Massaro JM, Jacques PF, Fox CS, Chu AY: Lifestyle factors and indices of kidney function in the Framingham Heart Study. Am J Nephrol, 2015; 41: 267-274 [DOI] [PMC free article] [PubMed] [Google Scholar]
- 30). Menon V, Katz R, Mukamal K, Kestenbaum B, de Boer IH, Siscovick DS, Sarnak MJ, Shlipak MG: Alcohol consumption and kidney function decline in the elderly: alcohol and kidney disease. Nephrol Dial Transplant, 2010; 25: 3301-3307 [DOI] [PMC free article] [PubMed] [Google Scholar]
- 31). Kanda E, Muneyuki T, Suwa K, Nakajima K: Alcohol and Exercise Affect Declining Kidney Function in Healthy Males Regardless of Obesity: A Prospective Cohort Study. PLoS One, 2015; 10: e0134937. [DOI] [PMC free article] [PubMed] [Google Scholar]
- 32). Sato KK, Hayashi T, Uehara S, Kinuhata S, Oue K, Endo G, Kambe H, Fukuda K: Drinking pattern and risk of chronic kidney disease: the kansai healthcare study. Am J Nephrol, 2014; 40: 516-522 [DOI] [PubMed] [Google Scholar]
- 33). Koba S: Physical Activity and Chronic Kidney Disease. J Atheroscler Thromb, 2016; 23: 395-396 [DOI] [PubMed] [Google Scholar]
- 34). Nagasawa Y, Yamamoto R, Shinzawa M, Hasuike Y, Kuragano T, Isaka Y, Nakanishi T, Iseki K, Yamagata K, Tsuruya K, Yoshida H, Fujimoto S, Asahi K, Moriyama T, Watanabe T: Body Mass Index Modifies an Association between Self-Reported Regular Exercise and Proteinuria. J Atheroscler Thromb, 2016; 23: 402-412 [DOI] [PubMed] [Google Scholar]
- 35). Hawkins MS, Sevick MA, Richardson CR, Fried LF, Arena VC, Kriska AM: Association between physical activity and kidney function: National Health and Nutrition Examination Survey. Med Sci Sports Exerc, 2011; 43: 1457-1464 [DOI] [PubMed] [Google Scholar]
- 36). Li L, Yang C, Zhao Y, Zeng X, Liu F, Fu P: Is hyperuricemia an independent risk factor for new-onset chronic kidney disease?: A systematic review and meta-analysis based on observational cohort studies. BMC Nephrol, 2014; 15: 122. [DOI] [PMC free article] [PubMed] [Google Scholar]
- 37). Kubo S, Kitamura A, Imano H, Cui R, Yamagishi K, Umesawa M, Muraki I, Kiyama M, Okada T, Iso H, Circulatory Risk in Communities Study I : Serum Albumin and High-Sensitivity C-reactive Protein are Independent Risk Factors of Chronic Kidney Disease in Middle-Aged Japanese Individuals: the Circulatory Risk in Communities Study. J Atheroscler Thromb, 2016; 23: 1089-1098 [DOI] [PMC free article] [PubMed] [Google Scholar]