

Abstract
The aim of the study was to explore the clinical significance of let-7 expression in hepatocellular carcinoma (HCC).
A PCR array was conducted to screen for let-7 expression in early-stage HCC. Next, the deregulation of let-7 was confirmed by quantitative real-time RT-PCR (qRT-PCR) in another set of liver tissues, including normal control (NC), chronic hepatitis (CH), liver cirrhosis (LC), HCC, and adjacent nontumor (NT) tissues. In addition, as the potential target mRNA of let-7, alpha 2(I) collagen (COL1A2) mRNA was also quantified in the above liver tissues. Finally, an association study comparing let-7 and COL1A2 and their clinical significance in HCC was conducted.
PCR array analysis revealed that the expression levels of let-7a/7b/7c were significantly downregulated in early-stage HCC compared to those in NT tissues. As compared to NC samples, qRT-PCR further confirmed that let-7a/7b/7c/7e were significantly upregulated in CH, LC, and NT tissues, while there were no significant differences in expression between the HCC and NC groups. Although COL1A2 may be the target mRNA of let-7, only let-7c expression was inversely correlated with COL1A2 mRNA expression in CH tissues. In HCC tissues, levels of let-7a/7b/7c/7e were positively correlated with that of COL1A2 mRNA. The clinical significance study revealed that elevated let-7a expression was significantly correlated with serosal and vein invasion, while elevated let-7c expression was significantly correlated with vein invasion and advanced TNM stage. Elevated let-7e expression was significantly correlated with vein invasion in HCC. Significantly shorter postoperative overall survival was observed in HCC patients with high let-7c expression.
The results suggest that aberrant expression of let-7a/7b/7c/7e occurs in benign liver diseases and HCC. The upregulation of let-7 expression is associated with the progression and poor prognosis of HCC, and further mechanistic studies are warranted.
Keywords: hepatocellular carcinoma, Let-7, microRNA, prognosis
1. Introduction
Despite recent advances in surgical techniques and perioperative management, the prognosis of hepatocellular carcinoma (HCC) remains poor. It is therefore important to develop an effective approach for the early diagnosis of HCC. MicroRNAs (miRNAs) are noncoding RNAs approximately 22 nucleotides in size that act by repressing the translation of target mRNA.[1] Studies show the aberrant expression of miRNAs in various types of cancers. The deregulation of miRNAs may occur earlier than that of their target genes, implying that miRNAs may exhibit higher sensitivity in the early diagnosis of cancers.[2]
The let-7 family was one of the first tumor suppressor miRNAs to be identified. It is composed of 13 members with both overlapping and distinct functions in humans.[3] Extensive evidence suggests that let-7 functions as a tumor suppressor by targeting multiple oncogenes and that a reduction in let-7 is strongly associated with increased tumorigenicity and poor prognosis in patients.[4] For example, let-7 expression is downregulated in lung tumors and associated with shortened postoperative survival. Inducing the expression of let-7 family members can suppress tumor growth both in vitro and in vivo.[5] However, let-7 may also promote tumor progression in some cases, as shown by Wu et al,[6] who found that exaggerated overexpression of let-7g induced hepatotoxicity and liver carcinogenesis. As most cases of HCC arise from hepatitis-associated cirrhosis, it is speculated that changes in let-7 expression in chronic hepatitis (CH), liver cirrhosis (LC), and HCC may be involved in the mechanism of liver carcinogenesis.
In the present study, we used a PCR array to determine the expression levels of nine let-7 family members in early HCC, and we further used qRT-PCR to confirm changes in four significantly deregulated let-7 members in another set of liver tissues. In addition, the mRNA levels of collagen α2 (I) (COL1A2), which is reported to be a direct target gene of let-7g and is associated with susceptibility to HCC,[7,8] were also quantified to assess their correlation with let-7 miRNA levels in the above liver tissues. Finally, we aimed to improve the diagnosis and treatment of HCC by correlating let-7 expression with related clinicopathological factors, such as tumor size, vein invasion, histological grade, and patient survival.
2. Patients and methods
2.1. Patients and specimens
In this study, HCC tissues and adjacent nontumor tissues (NT; 2 cm from the tumor) were both obtained from 104 patients with HCC who received hepatectomy. In addition, we acquired 20 tissue specimens from patients with LC, 6 tissue specimens from patients with chronic hepatitis B or C virus (HBV or HCV; CH), and 8 tissue specimens from hepatic hemangioma patients or hepatic abscesses (normal controls, NC). All tissue specimens were collected from patients who had undergone surgery at Tianjin Third Central Hospital (Tianjin, China) from December 2003 to December 2013. All patients provided informed consent before enrollment in the study, and the study was approved by the Ethics Committee of Tianjin Third Central Hospital. Tissue specimens were collected and stored at −80°C until analysis.
2.2. Follow-up
Follow-up was completed on July 1, 2014. The period of follow-up was defined from the date of surgery to the date of patient's death or the last follow-up point. The follow-up program included serum alpha-fetoprotein (AFP) and liver B ultrasonic assessments.
2.3. MiRNA PCR array analysis
From among the 104 pairs of HCC and matched NT tissues, 11 pairs were selected and used for determination of the expression profile of miRNAs. The 11 pairs of HCC and matched NT tissues came from patients with early stage HCC [Barcelona Clinic Liver Cancer (BCLC) stage A] and HBV infection. Total RNA was extracted using the miRNeasy Mini Kit (Qiagen, Valencia, CA). Total RNA solutions from all 11 HCC tissue specimens were mixed and constituted the HCC RNA pool. The NT RNA pool was constituted in the same manner. MiRNA expression profiling was conducted with 1 μg RNA each from the HCC and NT RNA pools. The cDNA was synthesized with the RT2 miRNA First Strand Kit (SABiosciences, Frederick, MD). The RT2 miRNA PCR Array (SABiosciences) used in this study was a 96-well miRNA PCR array containing 88 target miRNAs, including 9 let-7 family members as well as endogenous controls. The expression of each miRNA in the HCC sample was compared with that in the NT sample, and the ratio of miRNA expression in HCC to NT was calculated for each of the 88 miRNAs.
2.4. MiRNA target prediction and sequence alignment
To identify potential let-7 target mRNAs, the TargetScan bioinformatics database was used. It predicts the biological targets of miRNAs by searching for the presence of conserved 8-mer and 7-mer sites that match the seed region of each miRNA. In mammals, predictions are ranked based on the predicted efficacy of targeting as calculated using the context+ scores of the sites.[9,10] As an option, predictions are also ranked by their probability of conserved targeting (PCT).[11] TargetScan uses the context+ score to reflect differential site efficacy. A more negative context score is associated with a more favorable site. The context+ score threshold for high efficacy targets was set at −0.2.
2.5. Quantitative real-time RT-PCR for miRNAs
Let-7 miRNA expression in the above hepatic tissues, including NC (8 cases), CH (6 cases), LC (20 cases), NT (104 cases), and HCC (104 cases) tissues, was analyzed using TaqMan miRNA assays (Applied Biosystems, Foster, CA). Total RNA was isolated from tissues using TRIzol (Invitrogen, Carlsbad, CA) following the manufacturer's instructions. Single-stranded cDNA was synthesized from 5 ng of total RNA in a 15-μL reaction volume using a TaqMan miRNA reverse transcription kit (Applied Biosystems). The reactions were incubated first at 16°C for 30 minutes, then at 42°C for 30 minutes, and then inactivated by incubation at 85°C for 5 minutes. Each 20-μL PCR included 10 μL of 2× Universal PCR Master Mix, 1 μL of 20× TaqMan miRNA assay mix, and 2 μL of reverse transcription product. The reactions were incubated in a 384-well plate at 95°C for 10 minutes, followed by 40 cycles of 95°C for 15 seconds and 60°C for 1 minute. The cDNA was amplified in triplicate using sequence-specific primers from the TaqMan miRNA assay on a ViiA 7 real-time PCR system (Applied Biosystems). PCR data were analyzed using the 2−ΔΔCT method, with U6 used as an endogenous control.
2.6. Quantitative real-time RT-PCR for COLIA2
To determine the correlation between let-7 and COLIA2 levels, the RNA extracted from the above NC (8 cases), CH (6 cases), LC (20 cases), and 53 pairs of HCC and NT tissues was used to quantify the COLIA2 mRNA level. cDNA was synthesized using 1 μg of total RNA as a template in a reverse transcription reaction using the ImProm-II Reverse Transcription System (Promega, Madison, WI). PCR was carried out using SYBR Green PCR core reagents (Applied Biosystems) according to the manufacturer's instructions. Glyceraldehyde-3-phosphate dehydrogenase (GAPDH) was used as an endogenous control. The primers used for PCR were as follows: COL1A2 forward primer, 5′-GAGGTACTGGCCACGACTGCATG-3′, and reverse primer, 5′-ATTGGCATGTTGCTAGGCATAAGG-3′; GAPDH forward primer, 5′-CTCATGACCACAGTCCATGCCATCACTG-3′, and reverse primer, 5′-CATGAGGTCCACCACCCTGTTGCTGTA-3′. The cDNA was quantified in triplicate using a ViiA 7 real-time PCR system (Applied Biosystems). PCR data were analyzed using the 2−ΔΔCT method.
2.7. Statistical analysis
Data are expressed as medians (25th and 75th percentiles). The Mann–Whitney U test was used to compare differences among groups. Clinicopathological parameters were compared using the χ2 test. Univariate and multivariate analyses of the prognostic factors were performed using Cox proportional hazard analyses. Survival curves were computed using the Kaplan–Meier method, and differences among survival curves were compared using the log-rank test. P < .05 denoted the presence of a statistically significant difference. Statistical analysis was conducted using the SPSS 16.0 software.
3. Results
3.1. Deregulation of 9 let-7 family members in early HCC
To determine whether let-7 is abnormally expressed in the early stage of HCC, including in patients with Child–Pugh A or B status diagnosed with one nodule of any size or a maximum of 3 nodules measuring <3 cm according to the BCLC classification,[12] PCR array analysis was conducted to assess the expression of nine let-7 family members, including let-7a, let-7b, let-7c, let-7d, let-7e, let-7f, let-7g, let-7i, and miR-98, in early-stage HCC and corresponding NT tissues. As shown in Fig. 1, levels of let-7a, let-7b, let-7c, let-7d, let-7e, let-7f, let-7g, and let-7i were reduced and that of miR-98 was elevated in early HCC compared to those in NT, with fold changes of −2.48, −4.09, −3.99, −1.99, −1.43, −1.00, −1.41, −1.81, and 1.16, respectively. Accordingly, we selected let-7a, let-7b, and let-7c, exhibiting significant fold changes (>2), as candidates for subsequent PCR validation. Let-7e, which has been determined to be involved in drug resistance,[13,14] was also selected for subsequent study.
Figure 1.
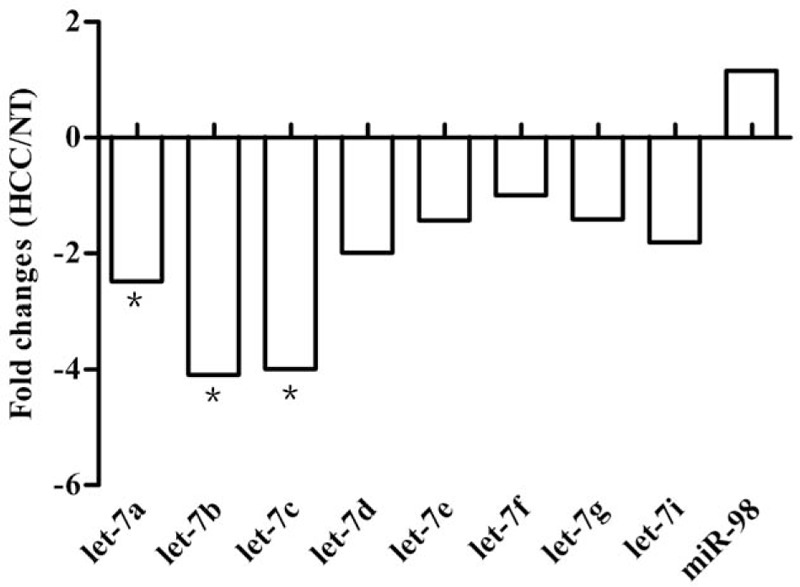
The fold changes of let-7 microRNAs expression in HCC compared with NT. With PCR Array analysis, let-7a, let-7b, and let-7c was found significantly downregulated in HCC compared with NT. ∗Fold change >2.
3.2. Expression of let-7a/7b/7c/7e in various liver tissues
As shown above, early-stage HCC showed abnormal expression of let-7. To determine whether the deregulation of let-7 is observed in different liver tissues, expression levels in NC, CH, LC, HCC, and NT were analyzed. As shown in Fig. 2, the expression levels of let-7a/7b/7c/7e were higher in CH, LC, and NT samples than in NC and HCC samples (P < .05 for all comparisons). Expression levels of let-7a/7b/7c/7e in HCC were slightly higher than those in NC, but this difference was not statistically significant. In benign liver diseases, the expression of let-7a was higher in CH than in NT (P < .05), while there were no significant differences in the expressions of let-7b/7c/7e between CH and NT. The expression of let-7e was higher in LC than in CH (P < .05), while the expressions of let-7a/7b/7c in CH and LC were not significantly different from each other. There were also no significant differences in the expression levels of let-7a/7b/7c/7e between LC and NT.
Figure 2.
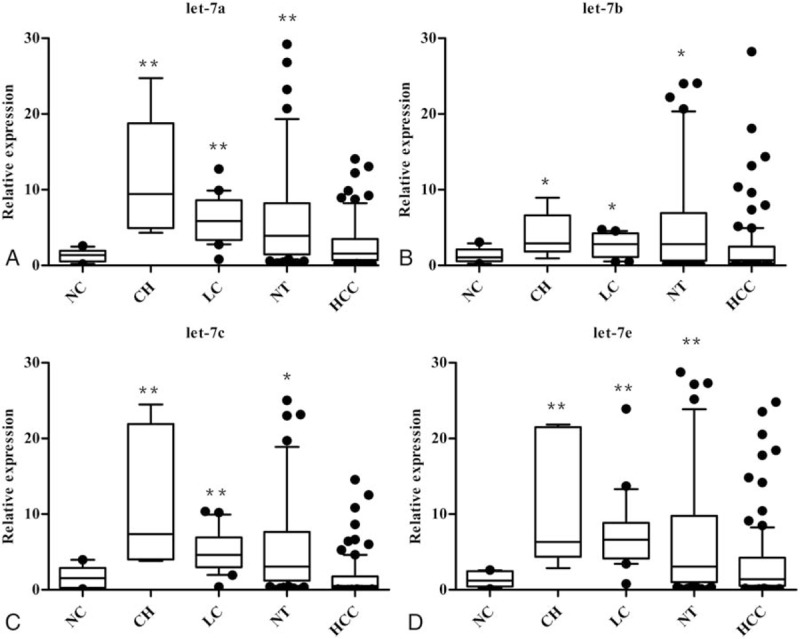
The expression of let-7 microRNAs in normal control and liver tissues. Let-7a (A), let-7b (B), let-7c (C), and let-7e (D) all were upregulated in CH, LC, or NT group compared with NC group. ∗P < .05, ∗∗P < .01.
3.3. Relationship between let-7 and COL1A2
To determine the relationship between let-7 and COL1A2, we performed an in silico screening using TargetScan with a recently described strategy.[15] We found that the 3′ UTR of the COL1A2 gene contained binding sites for let-7 with reasonable scores (Table 1). Sequence analysis revealed that the 3′ UTR of COL1A2 mRNA contains a putative site partially complementary to let-7. Thus, we hypothesized that, besides let-7g,[7]COL1A2 may also be a direct target gene of let-7a, let-7b, let-7c, or let-7e and that there should therefore be an inverse correlation between COL1A2 and let-7 in different liver tissues. As shown in Fig. 3A, the expression level of COL1A2 was 1.01 (0.63, 1.82) in the NC group, 0.99 (0.50, 2.09) in the CH group, 1.05 (0.52, 1.93) in the LC group, 0.87 (0.56, 1.71) in the NT group, and 1.03 (0.36, 2.51) in the HCC group. COL1A2 expression was not significantly different among different liver tissues. Correlation analysis showed that let-7c expression was negatively correlated with COL1A2 mRNA in the CH group (Fig. 3B). The expression levels of let-7a (Fig. 3C), let-7b (Fig. 3D), let-7c (Fig. 3E), and let-7e (Fig. 3F) all showed positive correlations with COL1A2 mRNA in the HCC group. No significant correlations between COL1A2 mRNA and let-7 were found in the NC, LC, or NT groups (data not shown).
Table 1.
Prediction of let-7 microRNAs binding site in the position 378–385 of COL1A2 3′-UTR by TargetScan.
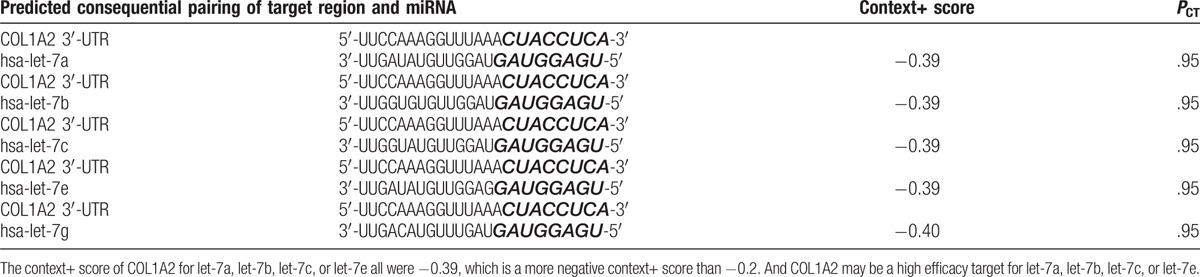
Figure 3.
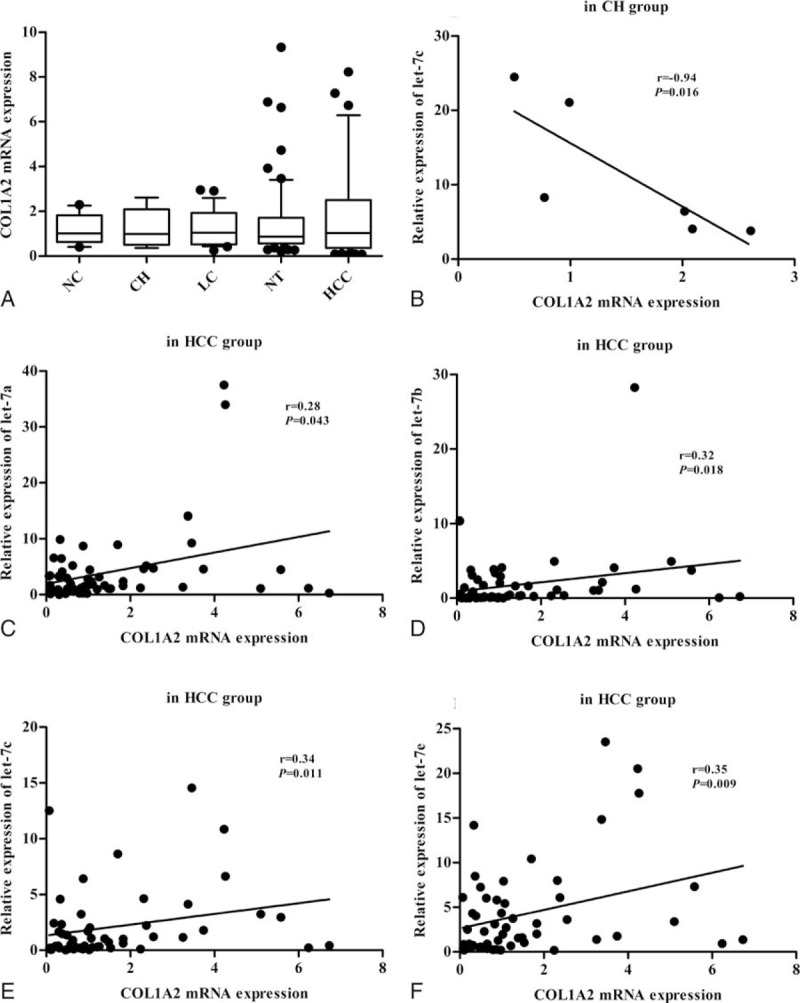
The relationship of let-7 to COL1A2 in liver tissues. There was no significant difference of COL1A2 expression among NC, CH, LC, NT, and HCC group (A). Let-7c expression (B) showed a negative correlation with COL1A2 mRNA in CH group. The expression of let-7a (C), let-7b (D), let-7c (E), and let-7e (F) all showed a positive correlation with COL1A2 mRNA in HCC group.
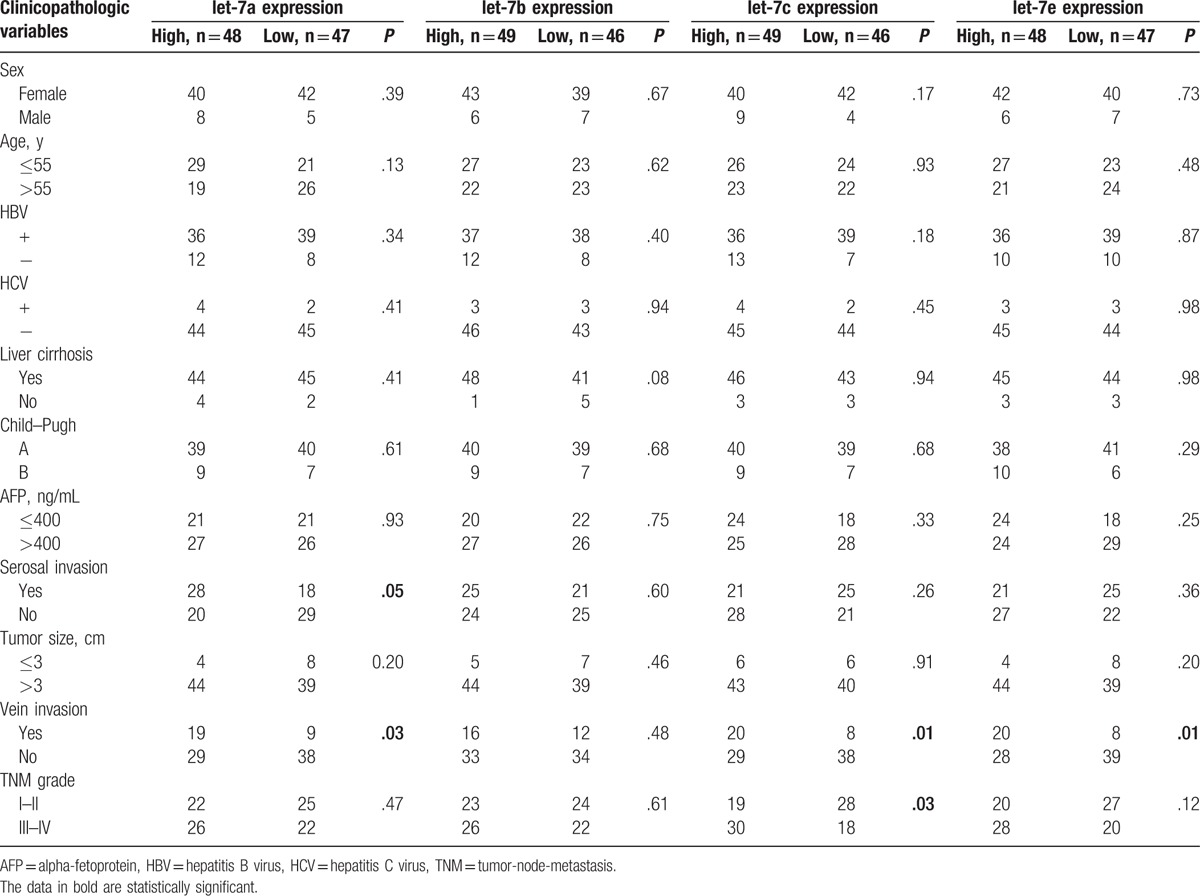
3.4. Correlation of let-7 with clinicopathological variables
Based upon the median let-7 expression level, the 95 clinical cases (9 cases were missing clinicopathological data) were divided into 2 groups, representing high and low let-7 expression. The fold changes of let-7a, let-7b, let-7c, and let-7e expression in the high let-7 HCC group compared to the low let-7 HCC group were 4.42, 13.27, 8.63, and 8.32, respectively. As shown in Table 2, for let-7a, the incidence of venous invasion and serosal invasion was significantly greater in the high-expression group than in the low-expression group (P < .05). For let-7b, no significant differences between the high- and low-expression groups were observed with respect to any clinicopathological variables. For let-7c, the incidence of venous invasion was significantly greater in the high-expression group than in the low-expression group (P < .05), and TNM stage (III–IV) was also associated with high let-7c expression (P < .05). For let-7e, the incidence of venous invasion was significantly greater in the high-expression group than in the low-expression group (P < .05).
Table 2.
Clinicopathologic data and let-7 microRNAs expression in 95 HCC patients.
3.5. Univariate and multivariate analyses of survival
We sought to determine which clinicopathological variables influence the overall survival rate. Based on the results in Table 3, univariate analysis showed that the following factors were significantly related to postoperative survival of HCC patients: AFP, growth pattern, tumor number, tumor size, venous invasion, TNM stage, and let-7c expression level. Multivariate analysis using the Cox proportional hazards model indicated that invasive growth pattern and venous invasion were significant independent prognostic factors for patients with HCC (P < .05). While let-7c expression was not an independent prognostic factors for HCC patients, overall survival was significantly lower in patients with high let-7c expression (P < .05; Fig. 4C).
Table 3.
Univariate and multivariate analysis of clinicopathologic factors affecting survival.
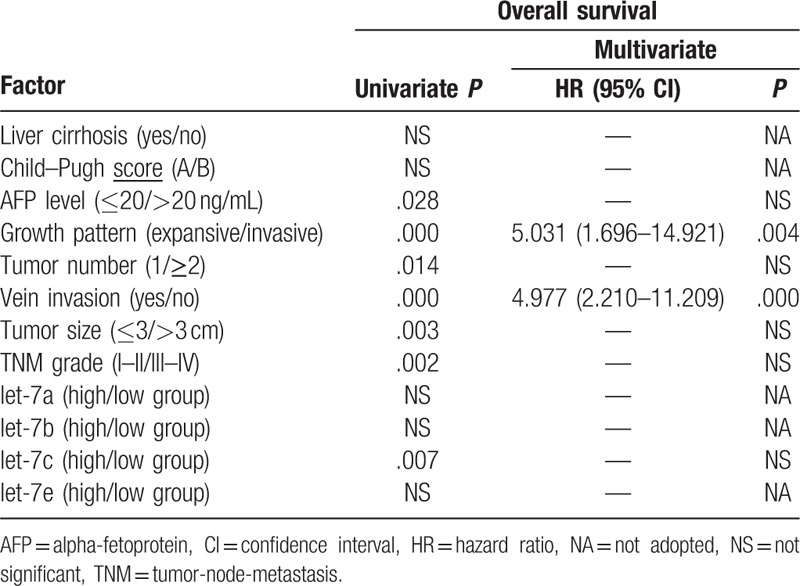
Figure 4.
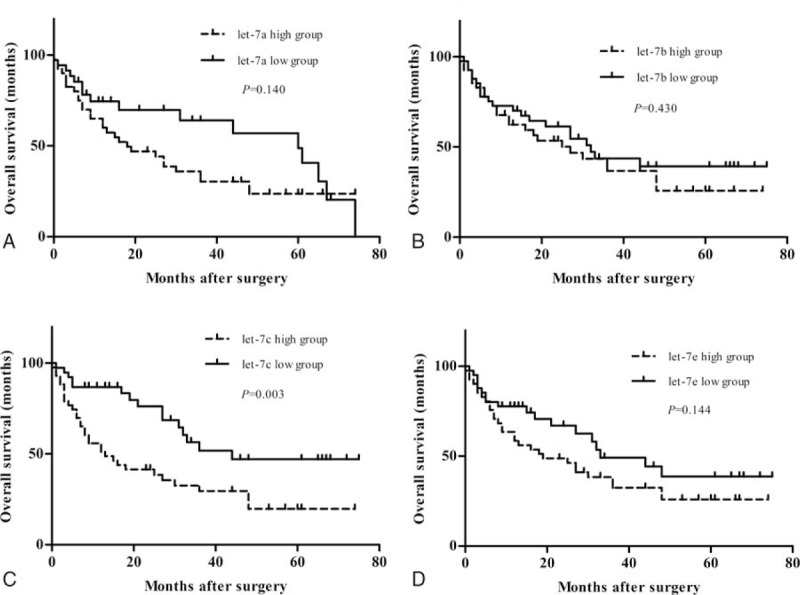
Survival curves of HCC patients by status of let-7 microRNA expression. Patients with high let-7c expression showed significantly poorer prognosis than those with low let-7c expression (C). Prognosis of HCC patients had no significant difference in high let-7a and low let-7a group (A), or in high let-7b and low let-7b group (B), or in high let-7e and low let-7e group (D).
4. Discussion
Previous studies have reported that let-7 is widely viewed as a tumor suppressor miRNA. The expression of let-7 family members is downregulated in many cancer types, such as lung cancer,[5] gastric cancer,[16] colorectal cancer,[17] HCC,[18] and prostate cancer.[19] In addition, let-7 family members have also been shown to be upregulated in some certain cancers. For example, Lawrie et al[20] showed that let-7b and let-7i were upregulated and associated with high grade transformation in lymphoma, while Lu et al[21] found that let-7a-3 was elevated in epithelial ovarian cancer. These data indicate that the expression of let-7 miRNA family members differs across different tissues and may be regulated by many factors.
In this study, we showed that the expression levels of let-7a/7b/7c/7e were elevated in CH, LC, and NT tissues compared to levels in NC or HCC tissues, while there were almost no differences in the expression levels of let-7a/7b/7c/7e among the CH, LC, and NT groups. This can be explained by the fact that chronic hepatitis or cirrhosis is present in the majority of NT cases; in other words, the majority of NT cases can be classified as CH or LC. As in the present study, the 95 HCC cases included 75 cases with hepatitis B, 6 cases with hepatitis C, and 89 cases with cirrhosis. Thus, we conclude that the expressions of let-7a/7b/7c/7e are upregulated in CH and LC samples. Consistent with our results, Jiang et al[22] reported that when compared to noncirrhotic, noninfected samples, samples from cirrhotic, virally infected livers showed increased expression of a host of miRNAs including let-7a and let-7d.
The main etiologies of HCC are known to include chronic hepatitis B, chronic hepatitis C, alcohol abuse, nonalcoholic steatohepatitis (NASH), and aflatoxin exposure. HBV/HCV infection is a global health problem that leads to LC and HCC.[23] This raises the question: as the main etiological factor, does chronic infection with HBV/HCV lead to LC and HCC by affecting let-7 expression? Wu et al[24] found that hepatitis B virus X protein (HBx) acted through Lin28B to suppress the expression of let-7 in HepG2 hepatoma cells. Takata et al showed that HBV mRNA from the preS2 region could be targeted by let-7g. The presence of HBV mRNA as a competitive RNA sequestered let-7g and inhibited let-7g function, which might contribute to the oncogenesis of HCC.[25] The molecular mechanism by which viral infection causes dysregulated miRNA expression may also involve genomic alteration in virally infected cells, as Moroy et al found that the woodchuck hepatitis virus (WHV), which is a hepadnavirus similar to HBV, could induce chromosomal rearrangements[26] and reduce mir-122 expression in virally infected cells.[27] The inflammation induced by viral infection also contributes to dysregulated miRNA expression in the liver. As shown by Iliopoulos et al,[28] there is a striking inverse relationship between the expression levels of let-7a and interleukin-6 (IL-6), an inflammatory cytokine known to be released from macrophages and T lymphocytes as well as from cancer cells.[29] Thus it is necessary to reveal the relationship between HBV/HCV infection and let-7 expression in HCC, though the 2 groups of HCC, those with or without HBV/HCV infection, showed no differences in let-7 expression in our study.
MiRNAs regulate gene expression at the posttranscriptional level by binding to target mRNAs, leading to mRNA degradation or translation inhibition.[30] Therefore, there should be an inverse correlation between the expressions of miRNAs and their target mRNAs. To date, many mRNAs have been experimentally confirmed to be target mRNAs of let-7 miRNAs, such as RAS,[31]COL1A2,[7] and high mobility group AT-hook 2 (HMGA2).[16] The expression levels of these target mRNAs show inverse correlations with let-7 miRNA expression. Interestingly, our study showed that the expression of COL1A2, a target mRNA of let-7 miRNAs, was only inversely correlated with let-7c in CH tissues. There was even a positive correlation between the expressions of let-7a/7b/7c/7e and COL1A2 in HCC, whereas let-7 and COL1A2 were not significantly correlated in NC, LC, or NT tissues. We presume that this discordance is due to the fact that the regulation of a target mRNA does not rely solely on the activity of the miRNA. Different pathological states can induce different systemic responses, which can in turn influence the expressions of miRNAs and their target mRNAs. Thus, the underlying mechanism for this regulation requires further exploration.
The dysregulation of let-7 miRNAs and their target mRNAs is associated with various clinicopathological factors and has prognostic value for many types of cancers. Hu et al[32] showed that low expression levels of 3 let-7 family members (let-7a, let-7b, and let-7g) were significantly associated with lymph node metastasis in breast cancer. Han et al[33] confirmed that the downregulation of let-7c in primary cancer tissue was significantly associated with metastasis, advanced TNM stage, and poor survival of colorectal cancer. Inconsistent with these findings, we found that the expression levels of let-7 miRNAs were not significantly different between HCC and NC tissues. High expression levels of let-7a/7c/7e were significantly associated with venous invasion and high TNM stage. The high let-7c HCC group even exhibited poorer prognoses than the low let-7c HCC group. This suggests that let-7 may not always function as a tumor suppressor miRNA. This was also shown by Wu, who found that modest let-7 overexpression abrogated MYC-driven liver cancer by antagonizing multiple let-7-sensitive oncogenes in a mouse model. In turn, chronic high-dose let-7 overexpression caused liver damage and degeneration, paradoxically leading to tumorigenesis.[6] Thus, we presume that let-7 expression can lead to dramatically different outcomes in distinct cancers.
Taken together, our results showed that let-7a/7b/7c/7e levels were upregulated in CH, LC, and NT. As a potential target mRNA, COL1A2 was not always negatively correlated with let-7 in different liver tissues. The upregulation of let-7a/7b/7c/7e expression is associated with serosal and/or vein invasion and/or advanced TNM stage in HCC patients. HCC patients with high let-7c expression exhibit poorer prognoses. These results reveal that overexpression of let-7 may promote the development of HCC and be associated with poor prognosis, though the underlying regulatory mechanism requires further study.
Acknowledgments
We thank all members in Key Laboratory of Artificial Cell and Department of Hepatobiliary Surgery of Tianjin Third Central Hospital for their technical supports in our study. We would like to thank Editage (www.editage.com) for English language editing.
Footnotes
Abbreviations: AFP = alpha-fetoprotein, BCLC = the Barcelona Clinic Liver Cancer, CH = chronic hepatitis, COL1A2 = alpha 2(I) collagen, GAPDH = glyceraldehyde-3-phosphate dehydrogenase, HBV = hepatitis B virus, HBx = hepatitis B virus X protein, HCC = hepatocellular carcinoma, HCV = hepatitis C virus, HMGA2 = high mobility group AT-hook 2, IL-6 = interleukin-6, LC = liver cirrhosis, miRNA = microRNA, NASH = nonalcoholic steatohepatitis, NC = normal controls, NT = nontumor tissues, PCT = probability of conserved targeting, qRT-PCR = quantitative real-time RT-PCR, WHV = woodchuck hepatitis virus.
WS and ZZ contributed equally to this work.
Funding: This study is supported by Research Project of Tianjin Healthy Bureau (2011KZ21) and Key projects of health industry of Tianjin Health Department (12KG107, 12KG108, 2011KR05).
The authors have no conflicts of interest to disclose.
References
- [1].Ambros V. microRNAs: tiny regulators with great potential. Cell 2001;107:823–6. [DOI] [PubMed] [Google Scholar]
- [2].Macfarlane LA, Murphy PR. MicroRNA: biogenesis, function and role in cancer. Curr Genomics 2010;11:537–61. [DOI] [PMC free article] [PubMed] [Google Scholar]
- [3].Boyerinas B, Park SM, Hau A, et al. The role of let-7 in cell differentiation and cancer. Endocr Relat Cancer 2010;17:F19–36. [DOI] [PubMed] [Google Scholar]
- [4].Balzeau J, Menezes MR, Cao S, et al. The LIN28/let-7 pathway in cancer. Front Genet 2017;8:31. [DOI] [PMC free article] [PubMed] [Google Scholar]
- [5].Takamizawa J, Konishi H, Yanagisawa K, et al. Reduced expression of the let-7 microRNAs in human lung cancers in association with shortened postoperative survival. Cancer Res 2004;64:3753–6. [DOI] [PubMed] [Google Scholar]
- [6].Wu L, Nguyen LH, Zhou K, et al. Precise let-7 expression levels balance organ regeneration against tumor suppression. Elife 2015;4:e09431. [DOI] [PMC free article] [PubMed] [Google Scholar]
- [7].Ji J, Zhao L, Budhu A, et al. Let-7g targets collagen type I alpha2 and inhibits cell migration in hepatocellular carcinoma. J Hepatol 2010;52:690–7. [DOI] [PMC free article] [PubMed] [Google Scholar]
- [8].Zhu Z, Jiang Y, Chen S, et al. An insertion/deletion polymorphism in the 3′ untranslated region of type I collagen a2 (COL1A2) is associated with susceptibility for hepatocellular carcinoma in a Chinese population. Cancer Genet 2011;204:265–9. [DOI] [PubMed] [Google Scholar]
- [9].Grimson A, Farh KK, Johnston WK, et al. MicroRNA targeting specificity in mammals: determinants beyond seed pairing. Mol Cell 2007;27:91–105. [DOI] [PMC free article] [PubMed] [Google Scholar]
- [10].Garcia DM, Baek D, Shin C, et al. Weak seed-pairing stability and high target-site abundance decrease the proficiency of lsy-6 and other microRNAs. Nat Struct Mol Biol 2011;18:1139–46. [DOI] [PMC free article] [PubMed] [Google Scholar]
- [11].Friedman RC, Farh KK, Burge CB, et al. Most mammalian mRNAs are conserved targets of microRNAs. Genome Res 2009;19:92–105. [DOI] [PMC free article] [PubMed] [Google Scholar]
- [12].Forner A, Llovet JM, Bruix J. Hepatocellular carcinoma. Lancet (London, England) 2012;379:1245–55. [DOI] [PubMed] [Google Scholar]
- [13].Sorrentino A, Liu CG, Addario A, et al. Role of microRNAs in drug-resistant ovarian cancer cells. Gynecol Oncol 2008;111:478–86. [DOI] [PubMed] [Google Scholar]
- [14].Boren T, Xiong Y, Hakam A, et al. MicroRNAs and their target messenger RNAs associated with ovarian cancer response to chemotherapy. Gynecol Oncol 2009;113:249–55. [DOI] [PubMed] [Google Scholar]
- [15].Heo I, Joo C, Cho J, et al. Lin28 mediates the terminal uridylation of let-7 precursor MicroRNA. Mol Cell 2008;32:276–84. [DOI] [PubMed] [Google Scholar]
- [16].Motoyama K, Inoue H, Nakamura Y, et al. Clinical significance of high mobility group A2 in human gastric cancer and its relationship to let-7 microRNA family. Clin Cancer Res 2008;14:2334–40. [DOI] [PubMed] [Google Scholar]
- [17].Smits KM, Paranjape T, Nallur S, et al. A let-7 microRNA SNP in the KRAS 3′UTR is prognostic in early-stage colorectal cancer. Clin Cancer Res 2011;17:7723–31. [DOI] [PMC free article] [PubMed] [Google Scholar]
- [18].Zhu XM, Wu LJ, Xu J, et al. Let-7c microRNA expression and clinical significance in hepatocellular carcinoma. J Int Med Res 2011;39:2323–9. [DOI] [PubMed] [Google Scholar]
- [19].Liu C, Kelnar K, Vlassov AV, et al. Distinct microRNA expression profiles in prostate cancer stem/progenitor cells and tumor-suppressive functions of let-7. Cancer Res 2012;72:3393–404. [DOI] [PMC free article] [PubMed] [Google Scholar]
- [20].Lawrie CH, Chi J, Taylor S, et al. Expression of microRNAs in diffuse large B cell lymphoma is associated with immunophenotype, survival and transformation from follicular lymphoma. J Cell Mol Med 2009;13:1248–60. [DOI] [PMC free article] [PubMed] [Google Scholar]
- [21].Lu L, Katsaros D, de la Longrais IA, et al. Hypermethylation of let-7a-3 in epithelial ovarian cancer is associated with low insulin-like growth factor-II expression and favorable prognosis. Cancer Res 2007;67:10117–22. [DOI] [PubMed] [Google Scholar]
- [22].Jiang J, Gusev Y, Aderca I, et al. Association of MicroRNA expression in hepatocellular carcinomas with hepatitis infection, cirrhosis, and patient survival. Clin Cancer Res 2008;14:419–27. [DOI] [PMC free article] [PubMed] [Google Scholar]
- [23].Lampertico P, Agarwal K, Berg T, et al. EASL 2017 Clinical Practice Guidelines on the management of hepatitis B virus infection. J Hepatol 2017;67:370–98. [DOI] [PubMed] [Google Scholar]
- [24].Wu G, Huang P, Ju X, et al. Lin28B over-expression mediates the repression of let-7 by hepatitis B virus X protein in hepatoma cells. Int J Clin Exp Med 2015;8:15108–16. [PMC free article] [PubMed] [Google Scholar]
- [25].Takata A, Otsuka M, Ohno M, et al. Mutual antagonism between hepatitis B viral mRNA and host microRNA let-7. Sci Rep 2016;6:23237. [DOI] [PMC free article] [PubMed] [Google Scholar]
- [26].Moroy T, Marchio A, Etiemble J, et al. Rearrangement and enhanced expression of c-myc in hepatocellular carcinoma of hepatitis virus infected woodchucks. Nature 1986;324:276–9. [DOI] [PubMed] [Google Scholar]
- [27].Chang J, Guo JT, Jiang D, et al. Liver-specific microRNA miR-122 enhances the replication of hepatitis C virus in nonhepatic cells. J Virol 2008;82:8215–23. [DOI] [PMC free article] [PubMed] [Google Scholar]
- [28].Iliopoulos D, Hirsch HA, Struhl K. An epigenetic switch involving NF-kappaB, Lin28, Let-7 MicroRNA, and IL6 links inflammation to cell transformation. Cell 2009;139:693–706. [DOI] [PMC free article] [PubMed] [Google Scholar]
- [29].Bromberg J, Wang TC. Inflammation and cancer: IL-6 and STAT3 complete the link. Cancer Cell 2009;15:79–80. [DOI] [PMC free article] [PubMed] [Google Scholar]
- [30].Iorio MV, Croce CM. MicroRNA dysregulation in cancer: diagnostics, monitoring and therapeutics. A comprehensive review. EMBO Mol Med 2012;4:143–59. [DOI] [PMC free article] [PubMed] [Google Scholar]
- [31].Johnson SM, Grosshans H, Shingara J, et al. RAS is regulated by the let-7 microRNA family. Cell 2005;120:635–47. [DOI] [PubMed] [Google Scholar]
- [32].Hu X, Guo J, Zheng L, et al. The heterochronic microRNA let-7 inhibits cell motility by regulating the genes in the actin cytoskeleton pathway in breast cancer. Mol Cancer Res 2013;11:240–50. [DOI] [PMC free article] [PubMed] [Google Scholar]
- [33].Han HB, Gu J, Zuo HJ, et al. Let-7c functions as a metastasis suppressor by targeting MMP11 and PBX3 in colorectal cancer. J Pathol 2012;226:544–55. [DOI] [PubMed] [Google Scholar]