

Abstract
Determination of protease specificity is of crucial importance for understanding protease function. We have developed the first gel‐based label‐free proteomic approach (DIPPS—direct in‐gel profiling of protease specificity) that enables quick and reliable determination of protease cleavage specificities under large variety of experimental conditions. The methodology is based on in‐gel digestion of the gel‐separated proteome with the studied protease, enrichment of cleaved peptides by gel extraction, and subsequent mass spectrometry analysis combined with a length‐limited unspecific database search. We applied the methodology to profile ten proteases ranging from highly specific (trypsin, endoproteinase GluC, caspase‐7, and legumain) to broadly specific (matrix‐metalloproteinase‐3, thermolysin, and cathepsins K, L, S, and V). Using DIPPS, we were able to perform specificity profiling of thermolysin at its optimal temperature of 75°C, which confirmed the applicability of the method to extreme experimental conditions. Moreover, DIPPS enabled the first global specificity profiling of legumain at pH as low as 4.0, which revealed a pH‐dependent change in the specificity of this protease, further supporting its broad applicability.
Keywords: caspase, legumain, protease, proteomics, specificity profiling
Subject Categories: Chemical Biology; Methods & Resources; Post-translational Modifications, Proteolysis & Proteomics
Introduction
Proteases are key effectors in numerous physiological processes. In humans, more than 550 proteases participate in dynamic turnover of the whole proteome either through bulk protein degradation or through specific protein processing, thereby regulating specific physiological pathways (Lopez‐Otin & Bond, 2008). Therefore, understanding protease cleavage specificity is one of the key elements required for determination of protease function. Protease specificity is embedded in the architecture of the active site and enables recognition of amino acids surrounding the scissile peptide bond. Especially under in vivo conditions, other determinants, such as spatiotemporal location of a protease and its substrates, exosites, and three‐dimensional structure of native substrates, additionally influence substrate proteolysis (Timmer et al, 2009; Turk et al, 2012a). Protease cleavage specificity therefore facilitates our understanding of the dynamic interactions of proteases with their substrates in homeostasis or disease and provides additional information for designing selective substrates, probes for imaging and activity assays as well as specific inhibitors (Turk, 2006; Sukuru et al, 2010; Kasperkiewicz et al, 2012; Sanman & Bogyo, 2014).
Although synthetic peptide libraries can also be applied in such experiments, proteome‐derived libraries remain the most common choice since they require no peptide synthesis (O'Donoghue et al, 2012). Over the years, a number of proteomic approaches have been developed to study protease cleavage specificity (Shahinian et al, 2013; Vizovisek et al, 2016). In these approaches, peptide or protein‐based libraries are proteolytically cleaved and neo‐N‐termini are identified by mass spectrometry. When working with proteome‐derived libraries, the N‐terminal peptides generated by the protease are typically chemically modified to be distinguished from internal tryptic peptides, which are generated later during sample preparation for mass spectrometry analysis (Shahinian et al, 2013; Vizovisek et al, 2016). To maximize the number of identified peptide cleavages, the protease‐generated N‐terminal peptides are typically separated from the internal tryptic peptides either by positive or by negative enrichment. Examples of positive enrichment are PICS (proteomic identification of protease cleavage sites) and other N‐terminal biotinylation‐based methodologies, where biotinylation of the N‐terminal peptides is used for their subsequent isolation by affinity purification (Mahrus et al, 2008; Schilling & Overall, 2008; Timmer et al, 2009). In the negative enrichment strategies, additional chemical labeling steps of tryptic peptides are introduced, which enable their separation from the N‐terminal peptides. In those cases, removal of chemically modified tryptic peptides can be based on their altered chromatographic properties, which is utilized in COFRADIC and ChaFRADIC methodologies (COFRADIC—COmbined FRactional DIagonal Chromatography; ChaFRADIC—Charge based FRactional DIagonal Chromatography; Gevaert et al, 2003; Van Damme et al, 2009; Venne et al, 2015) or on their covalent immobilization (TAILS—Terminal Amine Isotopic Labeling of Substrates; Kleifeld et al, 2010; Doucet et al, 2011). The drawback of all these approaches is their complexity given that they consist of several steps of chemical modifications and/or chromatographic separations. Furthermore, use of chromatographic separation for enrichment and separation of the labeled peptides can introduce biases related to peptide amino acid composition (Vizovisek et al, 2015).
Here, we present a simple proteomic approach for the protease cleavage site fingerprinting that does not require chemical labeling or chromatographic enrichment of cleaved peptides. The direct in‐gel profiling of protease specificity (DIPPS) approach offers a straightforward solution for characterizing the specificity of a wide array of proteases regardless of their enzyme class, specificity, and assay conditions. The DIPPS approach combines in‐gel digestion, peptide gel extraction with subsequent mass spectrometry analysis, and, most importantly, length‐limited unspecific database searches. The method was thoroughly evaluated using nine proteases with vastly different substrate specificities and then applied to profile legumain, a protease not previously characterized by proteomic approaches. The canonical Asn P1 specificity was only observed at pH 6.0, whereas a decrease in pH to 5.0 or even 4.0 resulted in a substantially increased number of cleavages of which almost half were after Asp, implying a potential role of legumain in differential substrate recognition during endolysosomal maturation.
Results
DIPPS workflow
The method of direct in‐gel profiling of protease specificity (DIPPS) is based on treatment of a gel‐separated cellular proteome with the protease of interest, extraction of the cleaved peptides from the gel, and their subsequent analysis by LC‐MS/MS (Fig 1). Briefly, the soluble cell lysate is first separated by sodium dodecyl sulfate–polyacrylamide gel electrophoresis (SDS–PAGE), thereby unfolding the proteins and simultaneously preventing their aggregation. Next, the protease under investigation is diluted in a selected assay buffer and transferred to the dehydrated polyacrylamide gel containing linearized proteins. Following in‐gel proteolysis, the generated peptides are extracted from the gel and analyzed by LC‐MS/MS, which enables identification of their neo‐N‐ and neo‐C‐termini. Therefore, instead of applying the protease cleavage specificity setting in the database search algorithm, a database search is performed using the peptide length limitation. The lower limit is set to a minimum peptide length (i.e., 8 amino acids) that is required for reliable peptide identification, whereas the upper limit is optimized and set according to the size limitation of peptide extraction from the polyacrylamide gel. The assembly of the identified N‐ and C‐terminal cleavage windows from identified peptides is simply aligned and used to determine their frequency relative to the natural amino acid occurrence in the human (or other species) proteome. Visualization of relative ratios as iceLogos (Colaert et al, 2009) or heat map representations provide unambiguous insight into the extended cleavage preferences of the assayed protease.
Figure 1. The experimental workflow of DIPPS (direct in‐gel profiling of protease specificity).
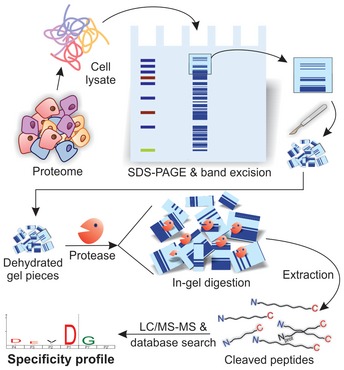
A soluble cell lysate providing natural amino acid sequence diversity is separated using SDS–PAGE. The whole protein lanes are sliced and cut into pieces that are dehydrated and dipped into a buffer containing the protease of interest. The in‐gel digestion results in the formation of cleaved peptides that are extracted from the gel and analyzed by LC‐MS/MS. The cleaved peptides are identified with a length‐limited unspecific database search and aligned to generate a substrate specificity profile of the studied protease.
DIPPS validation: proteases with narrow specificity
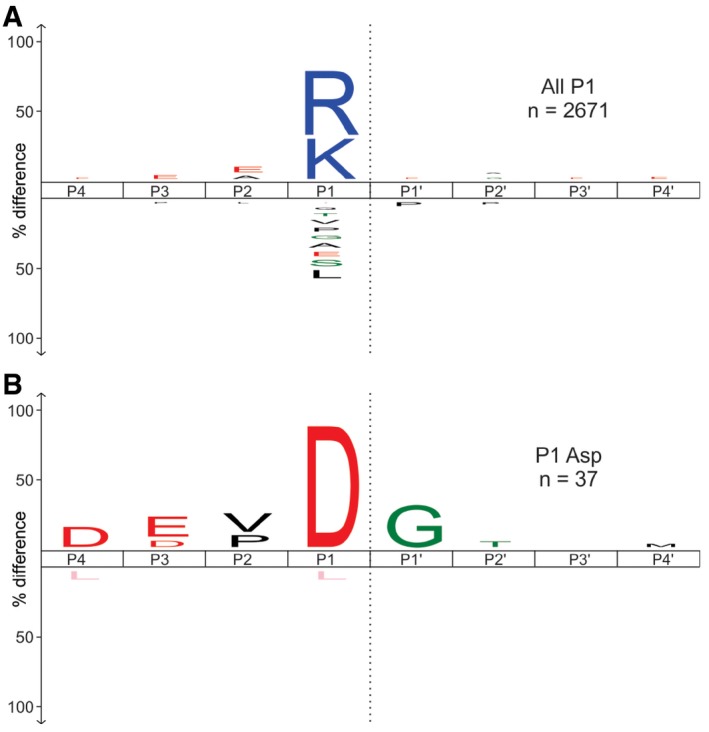
A crucial factor in DIPPS is the maximal length of peptides extracted from the gel, as it determines the upper peptide length limit used in the non‐specific database search. To address this problem, we applied caspase‐7, which is known for its characteristic DEVD extended recognition motif and a very low number of cleavages generated during apoptosis, resulting in long peptide fragments (Thornberry et al, 1997; Wejda et al, 2012; Rawlings et al, 2014). The analysis revealed that the maximum number of cleavages was identified at an upper peptide length limit of ~40 amino acids (Appendix Fig S1), suggesting that this is also the largest size of a peptide extracted from the gel under the experimental conditions. Using these settings, 601 cleavage sites were identified for caspase‐7 (Fig 2, Dataset EV1), accurately revealing the canonical DEVD↓G cleavage motif (Talanian et al, 1997; Thornberry et al, 1997; Stennicke et al, 2000). A direct comparison of the 601 cleavage sites identified by DIPPS with the 179 caspase‐7 cleavages deposited in the MEROPS database (Schilling & Overall, 2008; Rawlings et al, 2016) and apoptotic cleavages deposited in the DegraBase (Crawford et al, 2013) revealed no major differences in the DEVD motif appearance and the relative amino acid abundances (Fig 2A and B). With 85% Asp and 8% Glu P1 residues identified, the P1 position remains the most important for the caspase‐7 substrate recognition. The remaining 7% of identified random cleavages can be attributed to false positives (1% false discovery rate) and background proteolysis that happened prior to lysate preparation and caspase treatment. In addition, the P4 position is dominated by Asp (22%), P3 by Glu (19%), P2 by Val (16%), and P1ʹ by Gly (37%; Fig EV1). This makes our results consistent with the recent report (Seaman et al, 2016) that identified the presence of the P1 Glu cleavages in the extended DEVE↓G specificity profile of caspase‐7 (Figs 2C and EV2).
Figure 2. Human caspase‐7 extended cleavage specificity profiling.
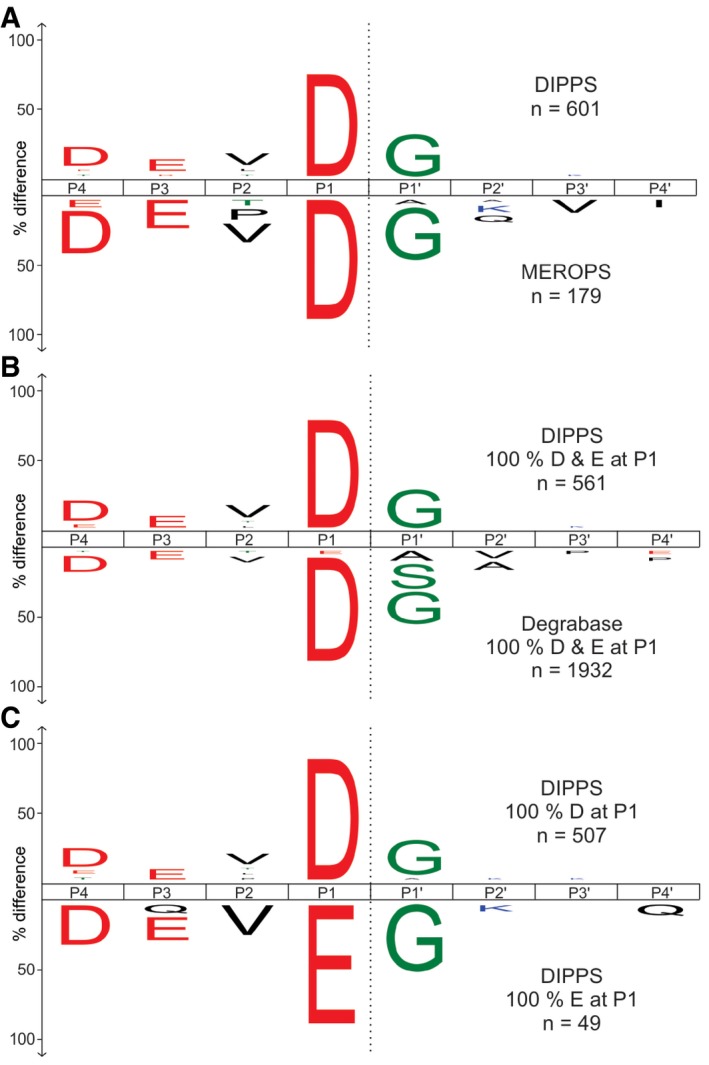
- The iceLogos showing amino acid frequency distribution at P4–P4ʹ positions of caspase‐7 generated cleavages obtained by DIPPS (above x‐axis) compared with cleavages from the MEROPS database (below x‐axis).
- The comparison of P1 Asp‐ and Glu‐specific cleavage sequences obtained by DIPPS in comparison with apoptotic cleavages deposited in the DegraBase database (Seaman et al, 2016).
- The comparison of P4‐P4′ sequence specificity between P1 Asp (above x‐axis) and P1 Glu (below x‐axis) specific cleavages.
Figure EV1. Caspase‐7 cleavage specificity profiling.
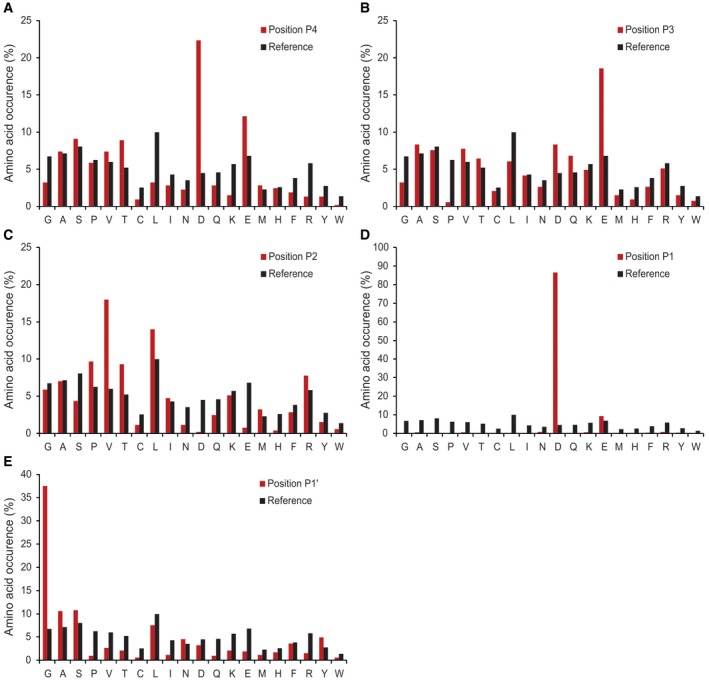
-
A–EThe amino acid frequency distribution of caspase‐7 P4 to P1′ sites compared with the human proteome amino acid frequency distribution.
Figure EV2. Correlation of DIPPS caspase‐7 specificity with apoptotic cleavages.
Matching cleavage site identifications between DIPPS and DegraBase with representative number of identified cleavage sites (n‐values).
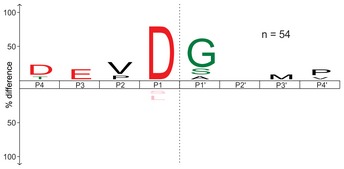
To exclude the possibility that larger protein fragments retained in the gel statistically affect the determined specificity profile, we additionally digested the extracted gel pieces (after caspase‐7 treatment) with trypsin. This second extraction step yielded numerous trypsin‐specific cleavages and additional 37 caspase‐7‐specific P1 Asp cleavage sequences (Fig EV3 and Dataset EV2). The sequence analysis of those cleavages also revealed the characteristic DEVD↓G specificity profile, indicating that the peptides retained in the gel did not affect the specificity profile.
Figure EV3. Cleavage specificity profile of caspase‐7 after the secondary digestion of extracted gel pieces with trypsin.
- The first digestion of the gel pieces with caspase‐7 was followed by the trypsin digestion. The cleavage specificity profile after the second digestion is presented in the upper panel.
- In the lower panel, the cleavage profile is only shown for P1 Asp cleavage sequences. The representative number of the cleavage sites used for the cleavage fingerprint construction is presented as n‐values. The scissile peptide bond between P1 and P1′ is indicated as a gray dashed line. P‐value used for the iceLogo construction was 0.05.
Next, we validated the approach by trypsin and endoproteinase GluC, which are regularly used in bottom‐up proteomic approaches and have a well‐characterized cleavage specificity profile. Trypsin is traditionally used for in‐gel digestion of proteins, and its strict P1 Arg and Lys cleavage specificity has been extensively studied in the past (Olsen et al, 2004; Rodriguez et al, 2008). Our analysis showed that over 99% of the 18,613 identified cleavage sites were exclusively after Lys (52.2%) and Arg (46.8%) in the P1 position (Fig 3A and B, and Dataset EV3), with a high level of correct tryptic cleavage site assignment and < 1% false‐positive identifications. As expected, no extended trypsin cleavage preference was observed beyond the P1 position except for the negative correlation with the P1ʹ Pro. The latter was revealed by an ~15‐fold depletion relative to the Pro abundance in the human proteome (Fig 3C). In addition, we also validated endoproteinase GluC cleavage specificity. We identified 5,190 cleavage sites (Fig 3D and E, and Dataset EV4), confirming the high selectivity for Glu (94.7%) in the P1 position, although Asp (2.5%) was also found, as previously reported (Schilling & Overall, 2008; Jakoby et al, 2012).
Figure 3. Trypsin and endoproteinase GluC cleavage specificity profiling.
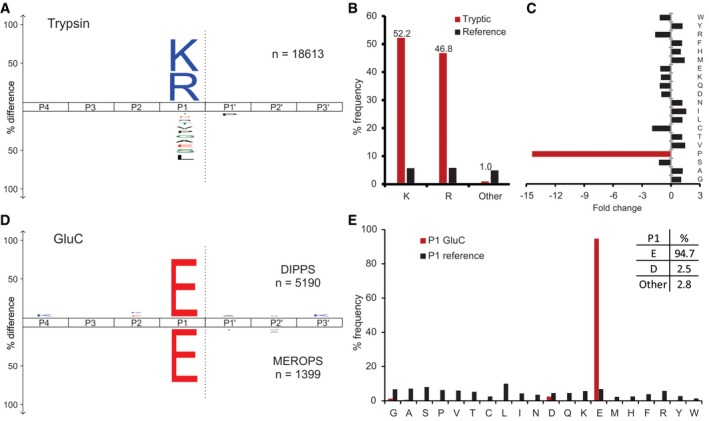
- Trypsin cleavage specificity profile presented as iceLogo (Colaert et al, 2009) with the representative number of cleavage sites used for the data analysis (n‐values).
- The frequency distribution of tryptic P1 sites compared with human amino acid frequency distribution.
- The fold‐change distribution of each amino acid at the P1ʹ position relative to the normal distribution in the human proteome.
- Endoproteinase GluC iceLogo showing the amino acid frequency distribution obtained by DIPPS (above x‐axis) compared with cleavages from the MEROPS database (below x‐axis).
- The frequency distribution of the GluC P1 cleavage sites compared with the human amino acid frequency distribution.
DIPPS validation: broad specificity proteases
To validate the applicability of the approach on broad specificity proteases, we profiled four members of the human cysteine cathepsin family, cathepsins K, L, V, and S, and the metalloprotease MMP‐3. Cathepsins are known for their broad specificity and similar substrate preferences (Turk et al, 2012b). With DIPPS, we identified 14,596 cleavage sites for the four cathepsins studied (3,762 cleavages for cathepsin K, 3,561 cleavages for cathepsin L, 4,238 cleavages for cathepsin S, and 3,035 cleavages for cathepsin V; Fig 4 and Datasets EV5, EV6, EV7 and EV8). The high number of recorded cleavage events enabled the construction of reliable cleavage specificity profiles, which are in agreement with the general cathepsin substrate specificity features. Accordingly, in the P2 position, which is known as the major recognition site in the cathepsins (Turk et al, 1998), mainly small aliphatic amino acids (Val, Leu, Ile) were identified, whereas the P1 position was enriched for the basic Lys and Arg residues (~30% of all cleavages). Enrichment in other positions was generally insignificant, except for the minor enrichment of negatively charged Asp and Glu patches in the P4 and P4ʹ positions and beyond. The specificities of cathepsins L, S, and V were highly similar and differed slightly from cathepsin K. The most important difference was probably the acceptance of Pro in the P2 position (12%) in the latter, which is linked with the collagenolytic activity of the enzyme. Similarly, MMP‐3 is a metalloprotease known for its broad specificity (Schilling & Overall, 2008). With DIPPS, 3,922 cleavage sites were identified. Its profile was governed primarily by P3 Pro (31%), P2 Ala (34%), and P1ʹ Leu (28%; Figs 5 and EV4, Dataset EV9).
Figure 4. DIPPS‐generated cathepsin K, L, S and V cleavage specificity.
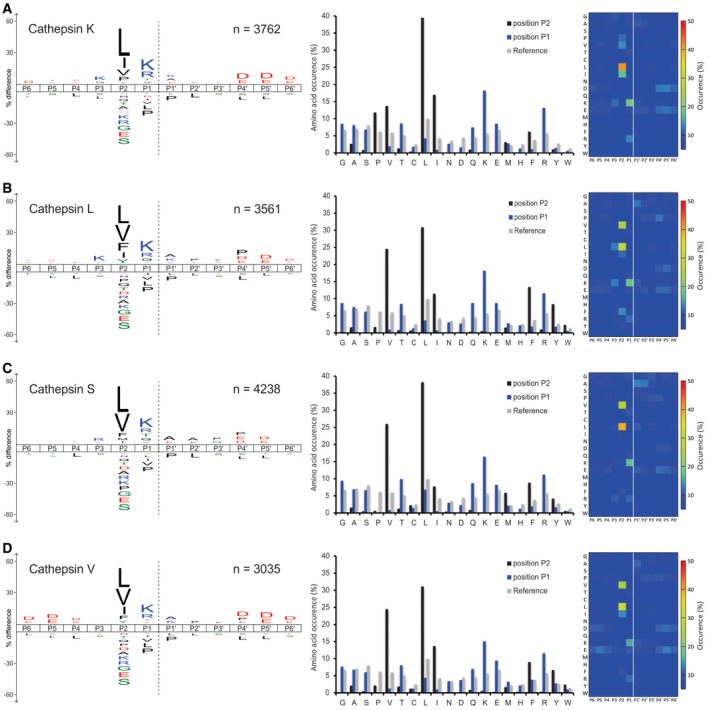
-
A–DThe cleavage sites for (A) cathepsin K, (B) cathepsin L, (C) cathepsin S, and (D) cathepsin V are represented as iceLogos (left panels), bar charts with occurrence of amino acid residues on P2 and P1 positions (middle panels), and heat maps with percent amino acid occurrence (right panels). The significantly enriched (above x‐axis) and under‐represented (below x‐axis) amino acids are indicated on iceLogos. The scissile peptide bond between P1 and P1ʹ in iceLogos is indicated as gray dashed lines. The P‐value for iceLogo construction was 0.05.
Figure 5. Specificity profiling of human MMP‐3.
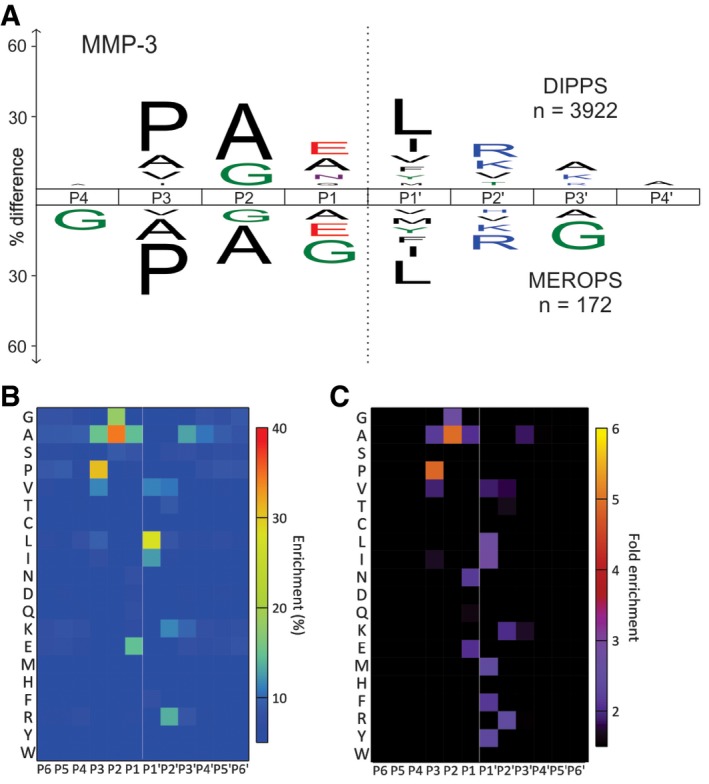
-
AThe frequency distribution iceLogo for P4‐P4ʹ positions compared with MEROPS deposited distribution (below x‐axis).
-
B, CThe identified cleavage sites are presented as heat maps with percent occurrence (B) and as fold‐change over the natural abundance in the human proteome (C).
Figure EV4. MMP‐3 cleavage specificity profiling.
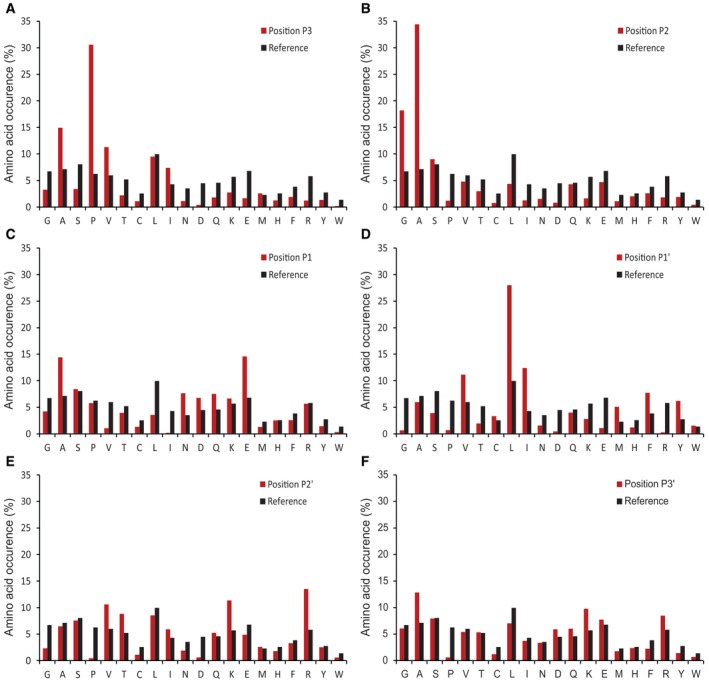
-
A–FThe frequency distribution of MMP‐3 P3 to P3′ sites compared with the human proteome amino acid frequency distribution.
Protease specificity profiling under high temperatures
Bacillus thermoproteolyticus thermolysin is a thermostable protease with the optimal cleavage temperature in the range of 65–85°C (Coffey et al, 2000), that is, under the conditions where the vast majority of proteins denature and precipitate. However, due to the stabilizing effect of the gel, we were able to profile thermolysin specificity at its optimal temperature of 75°C. We identified 2,852 cleavages, which is one order of magnitude higher than the number of cleavages deposited in the MEROPS database (Fig 6 and Dataset EV10; Rawlings et al, 2014). For comparison, we have additionally performed DIPPS profiling of thermolysin using the cell lysate of the obligatory thermophile Aeropyrum pernix. Both datasets correlated well and indicated that the most important substrate specificity determinant was the S1ʹ subsite, primarily accommodating aliphatic and aromatic amino acid residues (Fig 6D and E, and Dataset EV11). Interestingly, thermolysin was the only protease of the tested with prime‐site specificity and no identified non‐prime‐site specificity.
Figure 6. Specificity profiling of thermolysin from Bacillus thermoproteolyticus at 75°C.
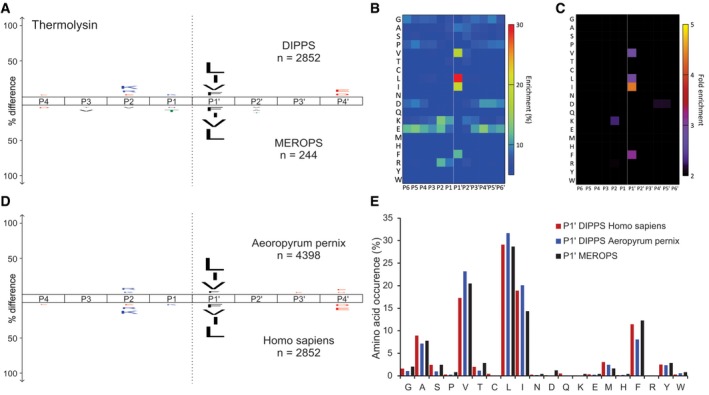
-
AThe frequency distribution iceLogo for P4‐P4′ positions compared with MEROPS deposited distribution (below x‐axis).
-
B, CThe identified cleavage sites are presented as heat maps with percent occurrence (B) and as fold‐change over the natural abundance in the human proteome (C).
-
DComparison of thermolysin frequency distribution plots between Aeropyrum pernix (above axis) and human (below axis) proteome.
-
EAmino acid occurrences at P1ʹ cleavage sites.ʹ
Protease specificity profiling under low pH
Given that a number of proteases are regularly exposed to the acidic environment of cellular organelles, we next evaluated the applicability of DIPPS to the acidic pH. The endolysosomal cysteine endopeptidase legumain, which cleaves substrates specifically after Asn at pH ~6.0, appeared suitable for the test, as it was known to be able to accept also Asp in the P1 position at lower pH (Dall & Brandstetter, 2012). To test the profiling conditions, we recorded the increasing preference of the P1 Asp over Asn at acidic pH using the synthetic substrates z‐AAN‐AMC and z‐AAD‐AMC (Fig 7D). Interestingly, the analysis showed the P1 preference transition from Asn to Asp in the pH range 6.0–4.5. We therefore profiled legumain at pH 6.0 in two technical replicates and identified 923 and 690 cleavages (Fig 7B, Appendix Fig S2, and Datasets EV12 and EV13). Both replicates showed high reproducibility and revealed identical specificity profile with Asn highly enriched at the P1 position (81%). In addition, a small number of cleavages were also observed after Asp (Figs 7A and EV5A). This finding is consistent with the canonical specificity of legumain reported in the MEROPS database, which is based on 81 cleavages (Rawlings et al, 2014). At pH 5.0, a major increase in the number of identified cleavage sites (3,154), as well as an increased preference for cleavage after Asp, was observed (Dataset EV14). Hence, the percentage of Asp P1 residues increased from 4.4% at pH 6.0 to 32.1% at pH 5.0. Acidification to pH 4.0 resulted in a further decline of the P1 legumain specificity for Asn (56.3%), which was compensated by an increase of the cleavages after Asp (39%). Interestingly, at pH 4.0, the number of identified cleavage sites decreased (2,505), which is consistent with a general decrease of legumain activity at this pH (Dataset EV15).
Figure 7. Legumain pH‐dependent cleavage specificity determination with DIPPS.
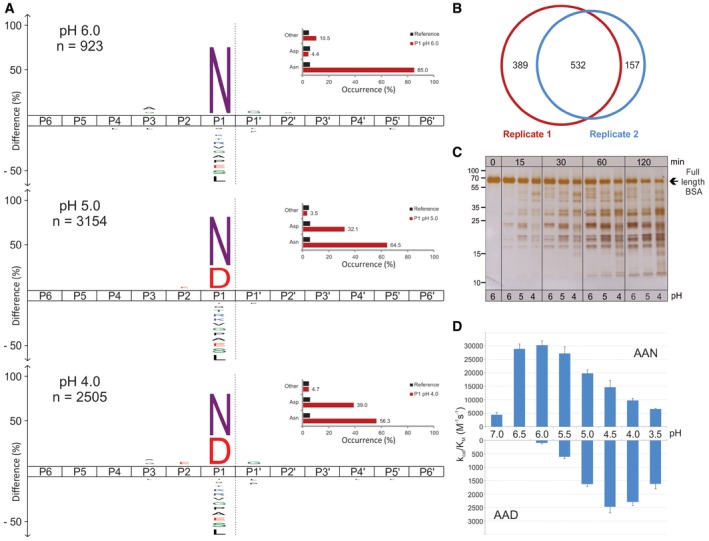
- The amino acid frequency distribution plots for legumain cleavages at different pH values with the percent occurrence bar chart at P1 position for Asn/Asp. The representative number of cleavage sites used for the data analysis is presented as n‐values. The scissile peptide bond between P1 and P1ʹ is indicated as a gray dashed line. The P‐value for iceLogo construction was 0.05.
- The area proportional Venn diagram of unique and shared cleavage sites of legumain at pH 6 in two independent replicates.
- The in‐solution digestion of BSA with legumain showing pH‐dependent profile of proteolysis.
- The k cat/K M values of legumain cleavage of z‐AAN‐AMC and z‐AAD‐AMC substrates in pH range 7.0 to 3.5. All measurements were performed in triplicate and are presented with their corresponding standard deviations.
Figure EV5. Legumain cleavage specificity profiling.
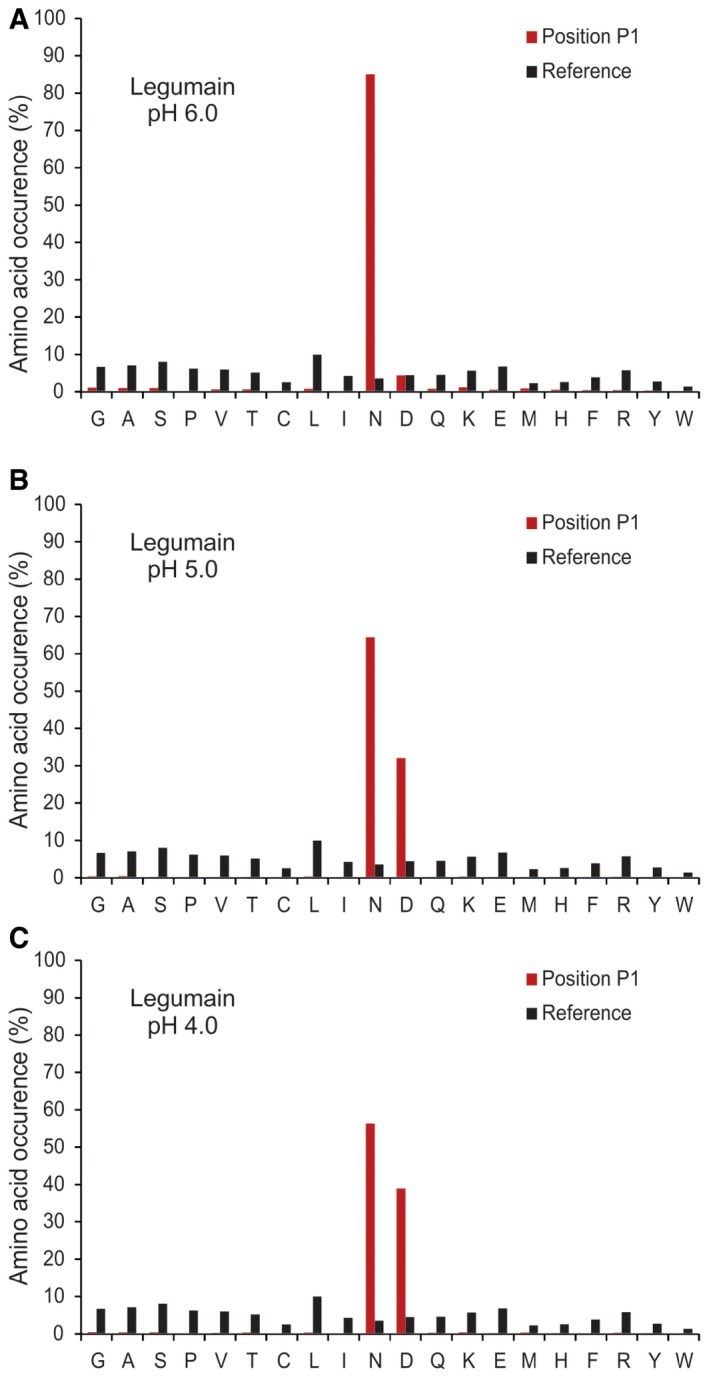
-
A–CThe frequency distribution of legumain P1 site at (A) pH 6.0, (B) pH 5.0, and (C) pH 4.0 compared with the human proteome amino acid frequency distribution.
Next, we evaluated this shift in solution by incubation of legumain with serum albumin. A specific and stable cleavage pattern of albumin observed at pH 6.0 was replaced by a stronger and faster degradation at lower pH, which is consistent with proteomic data (Fig 7C). This pH‐dependent shift of P1 specificity from Asn to Asp was also seen in the hydrolysis of small substrates z‐AAD‐AMC and z‐AAN‐AMC. A comparison of k cat/K M values thus showed that at pH 6.0 z‐AAN‐AMC was cleaved over 300‐fold more efficiently than z‐AAD‐AMC, whereas at pH 4.0, this difference was only about fourfold (Fig 7D, Appendix Table S1).
Discussion
The demonstrated capabilities reveal DIPPS as a reliable and easy to use approach, which provides a novel insight into substrate specificity profiling of proteases. It can be performed in any biochemical laboratory with access to a proteomic facility and can be applied to a broad range of physiological conditions. The idea for the methodology presented here originates from the in‐gel digestion approach that is widely used in proteomic sample preparation protocols (Shevchenko et al, 1996, 2006; Steen & Mann, 2004). However, in DIPPS, the in‐gel digestion is no longer used only to prepare the tryptic peptides from proteins prior to the MS analysis. Instead, the peptides generated by the protease of interest from the linearized proteins are extracted from the gel and directly used for the determination of the protease specificity. In contrast to other methodologies that utilize identification of either prime (N‐terminomics) or non‐prime sequences (C‐terminomics) and subsequent bioinformatic analysis, DIPPS is based on the experimental determination of the entire sequence of the protease‐generated peptide, thereby revealing neo‐N‐ and C‐termini in a single experiment. The corresponding cleavage sequences are then determined bioinformatically. The direct application of the gel extracted peptides to mass spectrometry analysis is a further advantage of DIPPS, when compared to other established approaches that all consist of 1–2 chemical labeling steps with at least one chromatographic step, which are time‐ and labor‐intensive. In addition, chromatographic enrichment of peptides can also be a source of experimental bias given that peptide binding to an ion‐exchange resin depends on the peptide amino acid composition (Vizovisek et al, 2015).
The extensive and rigorous validation of DIPPS by profiling ten proteases of different catalytic classes delivered extremely reliable and accurate datasets, which were generally in agreement with the data deposited in the MEROPS database (Rawlings et al, 2014). The strength of DIPPS is perhaps best demonstrated with profiles of proteases with broader specificity extending beyond the P1 position, such as cathepsins and MMP‐3. In the case of cathepsins, the data obtained by DIPPS correlated with the data obtained by positional peptide libraries, COFRADIC and FPPS (Choe et al, 2006; Biniossek et al, 2011; Vizovisek et al, 2015), while eliminating the minor bias for charged amino acid residues in the positions beyond P2ʹ in the latter two approaches. Compared to PICS, DIPPS produced superior datasets. While DIPPS facilitates profiling of the entire repertoire of 20 amino acid residues, PICS eliminates P1 residues generated by the protease used for the peptide library preparation and severely depletes the same residue(s) in the other positions. PICS can therefore profile only 19 or less aminoacid residues (18 when tryptic peptide library is used; Schilling & Overall, 2008; Biniossek et al, 2011). Given that only trypsin was used for the peptide library preparation, PICS excluded all Arg and Lys residues from the P1 sites of cathepsin specificity profiles. In a similar way, Arg and Lys residues at the P2′ site of MMP‐3 specificity profile were also missed (Eckhard et al, 2016). Contrary to PICS, Arg and Lys residues were correctly assigned in the specificity profiles obtained by DIPPS. Although similar specificity of cathepsins L, V, and S imply certain degree of functional redundancy, due to their different localization they perform also individual tissue‐specific functions (Turk et al, 2012b).
Importantly, the DIPPS‐generated datasets were in most cases larger than the datasets obtained by other studies. In part, this resulted from the use of linearized proteins where all the potential cleavage sites are readily accessible to the protease in contrast to the methods based on native proteins, such as COFRADIC, FPPS, TAILS, and biotinylation‐based N‐terminomics (Vizovisek et al, 2016). Although the use of linearized proteins (polypeptides) in DIPPS precludes identification of natural substrates of proteases, the high number of cleavage sites resulting in high accuracy in determining protease specificities more than compensates this drawback. This compensation is perhaps the best illustrated with caspase‐7. By determining 601 different cleavage sites, DIPPS provided the largest set of experimentally determined caspase‐7 cleavage sites to date. Compared with DIPPS, other degradomics approaches identified < 70 caspase‐7 cleavage sites (PICS identified 37 cleavage sites, whereas COFRADIC and biotinylation‐based N‐terminomics yielded 66 and 58 cleavage sites, respectively; Schilling & Overall, 2008; Agard et al, 2012; Wejda et al, 2012). Furthermore, DIPPS did not only accurately determine the consensus DEVD↓G‐specific recognition motif but also confirmed the presence of the very recently reported DEVE↓G caspase specificity motif (Seaman et al, 2016), which was previously missed by COFRADIC, PICS, and biotinylation‐based N‐terminomics due to the low number of identified cleavage events (Schilling & Overall, 2008; Timmer et al, 2009; Wejda et al, 2012).
Finally, the potential of DIPPS was demonstrated by profiling proteases under extreme temperature and pH conditions, found in nature. Specificity profiling of proteases by in‐solution approaches can be difficult given that extreme conditions often cause precipitation of proteins from complex proteomes. The in‐gel approach of DIPPS was an ideal solution given that the stabilizing effect of the gel environment prevents precipitation of protein substrates. Moreover, this study is the first example of proteomic specificity profiling of a thermophilic protease at an elevated temperature. Advantages of DIPPS were demonstrated also at acidic pH where the profiling revealed that at low pH legumain is turned into an Asn/Asp‐specific protease capable of faster degradation of proteins. These results are in agreement with recent results obtained by combinatorial substrate libraries, which showed that recognition of small substrates by legumain depends solely on the P1 residue (Poreba et al, 2016). However, the total number of cleavages and the percentage of cleavages after Asp observed in large substrates at acidic pH were much higher as that in small fluorogenic substrates (z‐AAN‐AMC and z‐AAD‐AMC), suggesting differential binding of the substrates. While small substrates bind only to the non‐prime side of the active site cleft, large polypeptide substrates occupy the entire active site on prime‐ and non‐prime side (Turk et al, 2012a), possibly explaining the difference. In addition, these results also validated legumain as a highly specific protease, which can be used for peptide generation in proteomic or sequencing studies.
However, DIPPS also has some limitations. Because of the use of denatured proteins, it is not suitable for identification of physiological substrates. In addition, its applicability is limited in the case of extremely large proteases (e.g., proteasome), which are not efficiently absorbed into a polyacrylamide gel, or exopeptidases.
In summary, we presented a reliable and straightforward approach for the determination of protease specificity profiles that does not require any chemical labeling or chromatographic enrichment of cleaved peptides and can be applied at extreme physiological conditions such as high temperature and acidic pH. Despite its simplicity, DIPPS provides rich and accurate datasets that in several aspects surpass other well‐established degradomic approaches. The obtained data of > 50,000 cleavages showed excellent correlation with published protease specificities and no observable experimental biases in amino acid recognition, suggesting that DIPPS can be easily applied to a wide range of endopeptidases.
Materials and Methods
Expression and purification of recombinant proteins
Human legumain was expressed in the baculovirus expression system (Poreba et al, 2016), whereas human cathepsins K, L, S, and V were expressed in the Pichia pastoris expression system (Invitrogen; Bromme et al, 2004; Mihelic et al, 2008). Active MMP‐3 was purchased from Sigma (SRP7783). Recombinant human caspase‐7 was expressed and purified from Escherichia coli BL21 as described elsewhere (Stennicke & Salvesen, 1997).
Cell culture and whole‐cell lysate preparation
MDA‐MB‐231 breast cancer cells were cultured in DMEM (Lonza), supplemented with 10% fetal bovine serum, 1% glutamine, and 1% penicillin/streptomycin at 37°C and 5% CO2. The cells were grown to confluency, washed twice with DPBS (Lonza), and detached with Hank's based enzyme‐free cell dissociation solution (Millipore). The detached cells were centrifuged, and cell pellets were stored at −80°C until further use. For the experiment, cell pellets were thawed on ice, resuspended in lysis buffer [50 mM Tris.HCl buffer pH 8.0, 150 mM NaCl, 1 mM EDTA, 0.1% SDS, 0.5% sodium deoxycholate, 1% protease inhibitor cocktail (Sigma)], and lysed on ice for 20 min. Aeropyrum pernix cells were resuspended in the lysate buffer and sonificated with three pulses for 5 s. All insoluble material was removed by centrifugation at 16,000 g for 10 min, and the approximate protein concentration was determined using the Bradford assay. The protein extracts were mixed with loading buffer and denaturated for 5 min at 95°C and stored afterward at −20°C until further use.
SDS–PAGE and sample preparation
The proteins were separated on 12.5% SDS–PAGE Precast gels (Lonza) with 150 μg of total proteins loaded per lane. SDS–PAGE was stained for 1 h with Coomassie Brilliant blue stain followed by overnight destaining in 30% ethanol/10% acetic acid. The whole protein lanes were cut using a gel grid cutter (The gel company) to produce 30 even sized bands. Each sample was combined from five adjacent bands to produce a total of six samples per condition. The gel bands were further sliced into ~1‐mm3 pieces and destained twice with 150 μl 50% ACN (acetonitrile) in 25 mM ABC (ammonium bicarbonate) for 30 min at 25°C and 1,200 rpm. The gel pieces were dehydrated with 100% ACN and vacuum‐dried. The cysteine residues were reduced with 150 μl 10 mM DTT (dithiothreitol) in 25 mM ABC for 30 min at 56°C. Afterward, alkylation was performed with 150 μl 55 mM IAM (iodoacetamide) in 25 mM ABC in the dark for 30 min at 25°C. The excess IAM was quenched with 150 μl 20 mM DTT in 25 mM ABC for 30 min at 37°C, and the gel pieces were further washed with 150 μl MS grade water followed by two additions of 150 μl 100% ACN until complete dehydration. The samples were vacuum‐dried and stored at −20°C until digestion.
In‐gel digestion
For the in‐gel digestion, 80 μl of 1 μM protease solution in the appropriate protease buffer was added to the samples and incubated on ice for 30 min to allow the gel pieces to absorb the buffer with the protease. Prolegumain was first activated in activation buffer (50 mM citric buffer, pH 4.0, 5 mM DTT) for 30 min at 37°C. Activated 16.7 μM legumain was diluted in 0.1 M citric buffer pH 4.0, pH 5.0, or pH 6.0 with 5 mM DTT for in‐gel digestion. Prior to in‐gel digestion, legumain was pretreated with 10 μM E‐64 in order to inhibit the trace amounts of cathepsin L‐like protease from Spodoptera frugiperda present in the sample (Johnson & Jiang, 2005). The cathepsins with different active concentrations (cathepsin B = 47 μM, cathepsin K = 33 μM, cathepsin L = 45 μM, cathepsin S = 20 μM, cathepsin V = 98 μM) were diluted in 0.1 M citric buffer pH 6.0 with 5 mM DTT. Matrix‐metalloproteinase‐3 was diluted in 50 mM Tris.HCl, 150 mM NaCl, 10 mM CaCl2 buffer pH 7.5. Caspase‐7 with active concentration 50 μM was diluted in 0.1 M HEPES pH 7.4 with 5 mM DTT and incubated for 18 h at 37°C. Thermolysin (Promega) was profiled at 1 μM in 50 mM Tris.HCl, 0.5 mM CaCl2, pH 8.0 for 2 h at 75°C. The sequencing grade modified porcine trypsin (Promega) was used at 1 μM in 0.1 M ABC buffer pH 7.8. GluC (Promega) from S. aureus V8 was diluted in 100 mM phosphate buffer pH 7.8 to 1 μM final concentration. To prevent the gel pieces from drying out during digestion, 100 μl of protease assay buffer was added to each sample and incubated for 2 h at 37°C unless otherwise noted.
Peptide extraction and desalting
The peptides generated by the investigated protease were extracted using 150 μl of 50% ACN in 5% FA for 30 min at 25°C. The extracted peptide solution was transferred into a new tube, and the extraction step was repeated twice. The extracted peptides were vacuum concentrated to ~100 μl to remove the excess acetonitrile. The peptides were desalted using 4 stacks of C18 disks (Empore) in a 200‐μl pipet tip. The C18 tips were first activated with 100% methanol and washed with 80% ACN/3% acetic acid and subsequently equilibrated with 0.1% FA in water and loaded with 100 μl of peptide solution. The bound peptides were washed with 0.1% FA followed by the peptide elution with 60% ACN/0.1% FA in water. Acetonitrile was removed by vacuum concentrating to a final volume of 12 μl.
LC‐MS/MS analysis
The samples were analyzed by LC‐MS/MS using an EASY‐nanoLC II HPLC unit (Thermo Fischer Scientific) coupled to an Orbitrap LTQ Velos mass spectrometer (Thermo Fischer Scientific) automatically operated via Xcalibur software (Thermo Fischer Scientific). The samples containing 0.1% FA were loaded onto a C18 trapping column (Proxeon Easy‐column, Thermo Fischer Scientific) and separated on a C18 PicoFrit Aquasil analytical column (New Objective). The peptides were eluted using a 5–40% (v/v) 50 min linear gradient of acetonitrile with 0.1% FA at a flow rate of 300 nl/min. The full MS mass spectra were acquired with the Orbitrap mass analyzer in the mass range of 300 to 2,000 m/z at resolution of 30,000 in the profile mode. The MS/MS spectra were obtained by HCD fragmentation of the nine most intense MS precursor ions and recorded at resolution of 7,500 in the centroid mode. Only the precursor ions with assigned charge state (> 1) were chosen for MS/MS fragmentation. The dynamic exclusion was set to repeat count of 1, repeat duration of 30 s, and exclusion duration of 20 s.
Spectrum to sequence assignment and data analysis
Database searches were performed using the MaxQuant software package version 1.5.6.0 imbedded with the Andromeda search engine (Cox & Mann, 2008; Cox et al, 2011). The searches were performed against the UniProt‐derived human reference proteome (UniProtKB, Homo sapiens, canonical database containing 20,114 entries, released in November 2016) and Uniprot‐derived Aeropyrum pernix canonical database (1,700 entries, released in April 2017). The protease‐generated peptides were searched using the unspecific cleavage settings with peptide length limitation from 8 to 40 amino acid residues and a maximum molecular weight of 4,600 Da. The search engine parameters were set to consider carbamidomethylation of cysteine residues (+57.0215 Da) as fixed modification and oxidation of methionine (+15.9949 Da) and acetylation of protein N‐termini (+42.0106 Da) as variable modifications. The precursor ion and fragment ion mass tolerances were set as 4.5 ppm and 0.5 Da, respectively. A reversed database search was performed with 1% false discovery rate for protein and peptide identification. The identified peptide list (peptides.txt) was filtered to remove the reverse and contaminant peptides and peptides with scores < 40 and PEP values larger than 0.05. Additionally, the identified peptide N‐ or C‐termini corresponding to N‐ or C‐protein termini and duplicated cleavage sites were removed. The protease cleavage window was used for the protease specificity determination using the iceLogo tool (Colaert et al, 2009). The reference set used for the calculation of the chance of the amino acid occurrence (P‐value) at a certain position was the human reference proteome (also used for the database searches). The background proteome was sampled using the random sampling method. The amino acid occurrences (enrichment and fold of change) obtained by iceLogo were plotted as heat maps using Gnuplot (www.gnuplot.info) and the heat map script as shown previously (Eckhard et al, 2016).
Determination of k cat/K M
Kinetics of z‐AAN‐AMC, z‐AAD‐AMC cleavage by legumain was measured by standard procedures, where 40 nM legumain was mixed with 5–300 μM substrates in 100 mM citric buffer (pH 7.0, 6.5, 6.0, 5.5, 5.0, 4.5, 4.0, 3.5) supplemented with 2 mM DTT. Fluorescence increase over time was measured with a microplate reader (Tecan M1000) at excitation/emission wavelength 370/460 nm. The turnover rate constant (k cat/K M) together with standard deviation values were determined as described elsewhere (Poreba et al, 2014).
Data availability
Mass spectrometry proteomics data have been deposited to the ProteomeXchange Consortium via the PRIDE partner repository with the dataset identifier PXD004218.
Author contributions
RV and MV performed the experiments and data analysis; DT provided legumain; MF and BT supervised the work; RV, MV, MF, and BT wrote the manuscript.
Conflict of interest
The authors declare that they have no conflict of interest.
Supporting information
Appendix
Expanded View Figures PDF
Review Process File
Dataset EV1
Dataset EV2
Dataset EV3
Dataset EV4
Dataset EV5
Dataset EV6
Dataset EV7
Dataset EV8
Dataset EV9
Dataset EV10
Dataset EV11
Dataset EV12
Dataset EV13
Dataset EV14
Dataset EV15
Acknowledgements
We want to thank Ivica Klemenčič (Jožef Stefan Institute) for expression and purification of cysteine cathepsins and Nataša Poklar Ulrih (University of Ljubljana) for a kind gift of Aeropyrum pernix cell sample. We would also like to thank Ulrich Eckhard (The University of British Columbia) for providing the heat map scripts. The work was funded by the Slovenian Research Agency (P1‐0140, J1‐3602, and N1‐0022 to B.T.; J1‐0185 and J1‐5449 to M.F.; and I0‐0048 to D.T.) and the COST Action PROTEOSTASIS BM1307.
The EMBO Journal (2017) 36: 2455–2465
Contributor Information
Boris Turk, Email: boris.turk@ijs.si.
Marko Fonović, Email: marko.fonovic@ijs.si.
References
- Agard NJ, Mahrus S, Trinidad JC, Lynn A, Burlingame AL, Wells JA (2012) Global kinetic analysis of proteolysis via quantitative targeted proteomics. Proc Natl Acad Sci USA 109: 1913–1918 [DOI] [PMC free article] [PubMed] [Google Scholar]
- Biniossek ML, Nagler DK, Becker‐Pauly C, Schilling O (2011) Proteomic identification of protease cleavage sites characterizes prime and non‐prime specificity of cysteine cathepsins B, L, and S. J Proteome Res 10: 5363–5373 [DOI] [PubMed] [Google Scholar]
- Bromme D, Nallaseth FS, Turk B (2004) Production and activation of recombinant papain‐like cysteine proteases. Methods 32: 199–206 [DOI] [PubMed] [Google Scholar]
- Choe Y, Leonetti F, Greenbaum DC, Lecaille F, Bogyo M, Bromme D, Ellman JA, Craik CS (2006) Substrate profiling of cysteine proteases using a combinatorial peptide library identifies functionally unique specificities. J Biol Chem 281: 12824–12832 [DOI] [PubMed] [Google Scholar]
- Coffey A, van den Burg B, Veltman R, Abee T (2000) Characteristics of the biologically active 35‐kDa metalloprotease virulence factor from Listeria monocytogenes . J Appl Microbiol 88: 132–141 [DOI] [PubMed] [Google Scholar]
- Colaert N, Helsens K, Martens L, Vandekerckhove J, Gevaert K (2009) Improved visualization of protein consensus sequences by iceLogo. Nat Methods 6: 786–787 [DOI] [PubMed] [Google Scholar]
- Cox J, Mann M (2008) MaxQuant enables high peptide identification rates, individualized p.p.b.‐range mass accuracies and proteome‐wide protein quantification. Nat Biotechnol 26: 1367–1372 [DOI] [PubMed] [Google Scholar]
- Cox J, Neuhauser N, Michalski A, Scheltema RA, Olsen JV, Mann M (2011) Andromeda: a peptide search engine integrated into the MaxQuant environment. J Proteome Res 10: 1794–1805 [DOI] [PubMed] [Google Scholar]
- Crawford ED, Seaman JE, Agard N, Hsu GW, Julien O, Mahrus S, Nguyen H, Shimbo K, Yoshihara HA, Zhuang M, Chalkley RJ, Wells JA (2013) The DegraBase: a database of proteolysis in healthy and apoptotic human cells. Mol Cell Proteomics 12: 813–824 [DOI] [PMC free article] [PubMed] [Google Scholar]
- Dall E, Brandstetter H (2012) Activation of legumain involves proteolytic and conformational events, resulting in a context‐ and substrate‐dependent activity profile. Acta Crystallogr Sect F Struct Biol Cryst Commun 68: 24–31 [DOI] [PMC free article] [PubMed] [Google Scholar]
- Doucet A, Kleifeld O, Kizhakkedathu JN, Overall CM (2011) Identification of proteolytic products and natural protein N‐termini by Terminal Amine Isotopic Labeling of Substrates (TAILS). Methods Mol Biol 753: 273–287 [DOI] [PubMed] [Google Scholar]
- Eckhard U, Huesgen PF, Schilling O, Bellac CL, Butler GS, Cox JH, Dufour A, Goebeler V, Kappelhoff R, Keller UA, Klein T, Lange PF, Marino G, Morrison CJ, Prudova A, Rodriguez D, Starr AE, Wang Y, Overall CM (2016) Active site specificity profiling of the matrix metalloproteinase family: proteomic identification of 4300 cleavage sites by nine MMPs explored with structural and synthetic peptide cleavage analyses. Matrix Biol 49: 37–60 [DOI] [PubMed] [Google Scholar]
- Gevaert K, Goethals M, Martens L, Van Damme J, Staes A, Thomas GR, Vandekerckhove J (2003) Exploring proteomes and analyzing protein processing by mass spectrometric identification of sorted N‐terminal peptides. Nat Biotechnol 21: 566–569 [DOI] [PubMed] [Google Scholar]
- Jakoby T, van den Berg BH, Tholey A (2012) Quantitative protease cleavage site profiling using tandem‐mass‐tag labeling and LC‐MALDI‐TOF/TOF MS/MS analysis. J Proteome Res 11: 1812–1820 [DOI] [PubMed] [Google Scholar]
- Johnson GD, Jiang W (2005) Characterization of cathepsin L secreted by Sf21 insect cells. Arch Biochem Biophys 444: 7–14 [DOI] [PubMed] [Google Scholar]
- Kasperkiewicz P, Gajda AD, Drag M (2012) Current and prospective applications of non‐proteinogenic amino acids in profiling of proteases substrate specificity. Biol Chem 393: 843–851 [DOI] [PubMed] [Google Scholar]
- Kleifeld O, Doucet A, Auf dem Keller U, Prudova A, Schilling O, Kainthan RK, Starr AE, Foster LJ, Kizhakkedathu JN, Overall CM (2010) Isotopic labeling of terminal amines in complex samples identifies protein N‐termini and protease cleavage products. Nat Biotechnol 28: 281–288 [DOI] [PubMed] [Google Scholar]
- Lopez‐Otin C, Bond JS (2008) Proteases: multifunctional enzymes in life and disease. J Biol Chem 283: 30433–30437 [DOI] [PMC free article] [PubMed] [Google Scholar]
- Mahrus S, Trinidad JC, Barkan DT, Sali A, Burlingame AL, Wells JA (2008) Global sequencing of proteolytic cleavage sites in apoptosis by specific labeling of protein N termini. Cell 134: 866–876 [DOI] [PMC free article] [PubMed] [Google Scholar]
- Mihelic M, Dobersek A, Guncar G, Turk D (2008) Inhibitory fragment from the p41 form of invariant chain can regulate activity of cysteine cathepsins in antigen presentation. J Biol Chem 283: 14453–14460 [DOI] [PubMed] [Google Scholar]
- O'Donoghue AJ, Eroy‐Reveles AA, Knudsen GM, Ingram J, Zhou M, Statnekov JB, Greninger AL, Hostetter DR, Qu G, Maltby DA, Anderson MO, Derisi JL, McKerrow JH, Burlingame AL, Craik CS (2012) Global identification of peptidase specificity by multiplex substrate profiling. Nat Methods 9: 1095–1100 [DOI] [PMC free article] [PubMed] [Google Scholar]
- Olsen JV, Ong SE, Mann M (2004) Trypsin cleaves exclusively C‐terminal to arginine and lysine residues. Mol Cell Proteomics 3: 608–614 [DOI] [PubMed] [Google Scholar]
- Poreba M, Szalek A, Kasperkiewicz P, Drag M (2014) Positional scanning substrate combinatorial library (PS‐SCL) approach to define caspase substrate specificity. Methods Mol Biol 1133: 41–59 [DOI] [PubMed] [Google Scholar]
- Poreba M, Solberg R, Rut W, Lunde NN, Kasperkiewicz P, Snipas SJ, Mihelic M, Turk D, Turk B, Salvesen GS, Drag M (2016) Counter selection substrate library strategy for developing specific protease substrates and probes. Cell Chem Biol 23: 1023–1035 [DOI] [PMC free article] [PubMed] [Google Scholar]
- Rawlings ND, Waller M, Barrett AJ, Bateman A (2014) MEROPS: the database of proteolytic enzymes, their substrates and inhibitors. Nucleic Acids Res 42: D503–D509 [DOI] [PMC free article] [PubMed] [Google Scholar]
- Rawlings ND, Barrett AJ, Finn R (2016) Twenty years of the MEROPS database of proteolytic enzymes, their substrates and inhibitors. Nucleic Acids Res 44: D343–D350 [DOI] [PMC free article] [PubMed] [Google Scholar]
- Rodriguez J, Gupta N, Smith RD, Pevzner PA (2008) Does trypsin cut before proline? J Proteome Res 7: 300–305 [DOI] [PubMed] [Google Scholar]
- Sanman LE, Bogyo M (2014) Activity‐based profiling of proteases. Annu Rev Biochem 83: 249–273 [DOI] [PubMed] [Google Scholar]
- Schilling O, Overall CM (2008) Proteome‐derived, database‐searchable peptide libraries for identifying protease cleavage sites. Nat Biotechnol 26: 685–694 [DOI] [PubMed] [Google Scholar]
- Seaman JE, Julien O, Lee PS, Rettenmaier TJ, Thomsen ND, Wells JA (2016) Cacidases: caspases can cleave after aspartate, glutamate and phosphoserine residues. Cell Death Differ 23: 1717–1726 [DOI] [PMC free article] [PubMed] [Google Scholar]
- Shahinian H, Tholen S, Schilling O (2013) Proteomic identification of protease cleavage sites: cell‐biological and biomedical applications. Expert Rev Proteomics 10: 421–433 [DOI] [PubMed] [Google Scholar]
- Shevchenko A, Wilm M, Vorm O, Mann M (1996) Mass spectrometric sequencing of proteins silver‐stained polyacrylamide gels. Anal Chem 68: 850–858 [DOI] [PubMed] [Google Scholar]
- Shevchenko A, Tomas H, Havlis J, Olsen JV, Mann M (2006) In‐gel digestion for mass spectrometric characterization of proteins and proteomes. Nat Protoc 1: 2856–2860 [DOI] [PubMed] [Google Scholar]
- Steen H, Mann M (2004) The ABC's (and XYZ's) of peptide sequencing. Nat Rev Mol Cell Biol 5: 699–711 [DOI] [PubMed] [Google Scholar]
- Stennicke HR, Salvesen GS (1997) Biochemical characteristics of caspases‐3, ‐6, ‐7, and ‐8. J Biol Chem 272: 25719–25723 [DOI] [PubMed] [Google Scholar]
- Stennicke HR, Renatus M, Meldal M, Salvesen GS (2000) Internally quenched fluorescent peptide substrates disclose the subsite preferences of human caspases 1, 3, 6, 7 and 8. Biochem J 350(Pt 2): 563–568 [PMC free article] [PubMed] [Google Scholar]
- Sukuru SC, Nigsch F, Quancard J, Renatus M, Chopra R, Brooijmans N, Mikhailov D, Deng Z, Cornett A, Jenkins JL, Hommel U, Davies JW, Glick M (2010) A lead discovery strategy driven by a comprehensive analysis of proteases in the peptide substrate space. Protein Sci 19: 2096–2109 [DOI] [PMC free article] [PubMed] [Google Scholar]
- Talanian RV, Quinlan C, Trautz S, Hackett MC, Mankovich JA, Banach D, Ghayur T, Brady KD, Wong WW (1997) Substrate specificities of caspase family proteases. J Biol Chem 272: 9677–9682 [DOI] [PubMed] [Google Scholar]
- Thornberry NA, Rano TA, Peterson EP, Rasper DM, Timkey T, Garcia‐Calvo M, Houtzager VM, Nordstrom PA, Roy S, Vaillancourt JP, Chapman KT, Nicholson DW (1997) A combinatorial approach defines specificities of members of the caspase family and granzyme B. Functional relationships established for key mediators of apoptosis. J Biol Chem 272: 17907–17911 [DOI] [PubMed] [Google Scholar]
- Timmer JC, Zhu W, Pop C, Regan T, Snipas SJ, Eroshkin AM, Riedl SJ, Salvesen GS (2009) Structural and kinetic determinants of protease substrates. Nat Struct Mol Biol 16: 1101–1108 [DOI] [PMC free article] [PubMed] [Google Scholar]
- Turk D, Guncar G, Podobnik M, Turk B (1998) Revised definition of substrate binding sites of papain‐like cysteine proteases. Biol Chem 379: 137–147 [DOI] [PubMed] [Google Scholar]
- Turk B (2006) Targeting proteases: successes, failures and future prospects. Nat Rev Drug Discovery 5: 785–799 [DOI] [PubMed] [Google Scholar]
- Turk B, Turk D, Turk V (2012a) Protease signalling: the cutting edge. EMBO J 31: 1630–1643 [DOI] [PMC free article] [PubMed] [Google Scholar]
- Turk V, Stoka V, Vasiljeva O, Renko M, Sun T, Turk B, Turk D (2012b) Cysteine cathepsins: from structure, function and regulation to new frontiers. Biochem Biophys Acta 1824: 68–88 [DOI] [PMC free article] [PubMed] [Google Scholar]
- Van Damme P, Van Damme J, Demol H, Staes A, Vandekerckhove J, Gevaert K (2009) A review of COFRADIC techniques targeting protein N‐terminal acetylation. BMC Proc 3(Suppl 6): S6 [DOI] [PMC free article] [PubMed] [Google Scholar]
- Venne AS, Solari FA, Faden F, Paretti T, Dissmeyer N, Zahedi RP (2015) An improved workflow for quantitative N‐terminal charge‐based fractional diagonal chromatography (ChaFRADIC) to study proteolytic events in Arabidopsis thaliana . Proteomics 15: 2458–2469 [DOI] [PubMed] [Google Scholar]
- Vizovisek M, Vidmar R, Van Quickelberghe E, Impens F, Andjelkovic U, Sobotic B, Stoka V, Gevaert K, Turk B, Fonovic M (2015) Fast profiling of protease specificity reveals similar substrate specificities for cathepsins K, L and S. Proteomics 15: 2479–2490 [DOI] [PubMed] [Google Scholar]
- Vizovisek M, Vidmar R, Fonovic M, Turk B (2016) Current trends and challenges in proteomic identification of protease substrates. Biochimie 122: 77–87 [DOI] [PubMed] [Google Scholar]
- Wejda M, Impens F, Takahashi N, Van Damme P, Gevaert K, Vandenabeele P (2012) Degradomics reveals that cleavage specificity profiles of caspase‐2 and effector caspases are alike. J Biol Chem 287: 33983–33995 [DOI] [PMC free article] [PubMed] [Google Scholar]
Associated Data
This section collects any data citations, data availability statements, or supplementary materials included in this article.
Supplementary Materials
Appendix
Expanded View Figures PDF
Review Process File
Dataset EV1
Dataset EV2
Dataset EV3
Dataset EV4
Dataset EV5
Dataset EV6
Dataset EV7
Dataset EV8
Dataset EV9
Dataset EV10
Dataset EV11
Dataset EV12
Dataset EV13
Dataset EV14
Dataset EV15
Data Availability Statement
Mass spectrometry proteomics data have been deposited to the ProteomeXchange Consortium via the PRIDE partner repository with the dataset identifier PXD004218.