

ABSTRACT
Background: Extracellular vesicles contain biological molecules specified by cell-type of origin and modified by microenvironmental changes. To conduct reproducible studies on exosome content and function, storage conditions need to have minimal impact on airway exosome integrity.
Aim: We compared surface properties and protein content of airway exosomes that had been freshly isolated vs. those that had been treated with cold storage or freezing.
Methods: Mouse bronchoalveolar lavage fluid (BALF) exosomes purified by differential ultracentrifugation were analysed immediately or stored at +4°C or −80°C. Exosomal structure was assessed by dynamic light scattering (DLS), transmission electron microscopy (TEM) and charge density (zeta potential, ζ). Exosomal protein content, including leaking/dissociating proteins, were identified by label-free LC-MS/MS.
Results: Freshly isolated BALF exosomes exhibited a mean diameter of 95 nm and characteristic morphology. Storage had significant impact on BALF exosome size and content. Compared to fresh, exosomes stored at +4°C had a 10% increase in diameter, redistribution to polydisperse aggregates and reduced ζ. Storage at −80°C produced an even greater effect, resulting in a 25% increase in diameter, significantly reducing the ζ, resulting in multilamellar structure formation. In fresh exosomes, we identified 1140 high-confidence proteins enriched in 19 genome ontology biological processes. After storage at room temperature, 848 proteins were identified. In preparations stored at +4°C, 224 proteins appeared in the supernatant fraction compared to the wash fractions from freshly prepared exosomes; these proteins represent exosome leakage or dissociation of loosely bound “peri-exosomal” proteins. In preparations stored at −80°C, 194 proteins appeared in the supernatant fraction, suggesting that distinct protein groups leak from exosomes at different storage temperatures.
Conclusions: Storage destabilizes the surface characteristics, morphological features and protein content of BALF exosomes. For preservation of the exosome protein content and representative functional analysis, airway exosomes should be analysed immediately after isolation.
KEYWORDS: Extracellular vesicles, bronchoalveolar lavage, storage conditions, label-free, quantitative proteomics
Introduction
Exosomes are small <150 nm extracellular vesicles derived from endosomal multivesicular bodies, and function in extracellular signal transduction.[1,2] Enclosed within protective phospholipid bilayers, exosomes contain proteins, vasoactive leukotrienes, and small RNAs whose composition dynamically changes with the cellular microenvironment.[2] We currently understand that exosomes affect cellular behaviour through paracrine actions on signal transduction pathways in distal cells. With a greater understanding of how the exosome content is affected by cellular responses to its microenvironment, profiling and quantification of the exosome content may be used as “liquid biopsies” to detect occult cellular stress and inflammation.[3] Although much study has focused on exosomes in the circulation, all cell types produce exosomes, which consequently are found in virtually every biological fluid, including the airways.
Asthma is a chronic inflammatory lung disease that affects over 300 million adults and children, making it a major public health problem.[4,5] In asthma, epithelial damage and repair is a major pathophysiological process mediating the progression.[6] Although epithelial injury in asthma is exacerbated by aero-allergens and environmental pollutants, recurrent airway infections are the most common cause of episodic decompensation.[7] Over time, these exacerbations lead to an accelerated decline in lung function, accounting for significant morbidity and mortality.[8,9] Understanding how viruses trigger epithelial inflammation and remodelling is therefore a clinically important question.
The airway mucosa senses viruses and initiates the inflammatory response by detecting molecular patterns unique to viral replication.[10,11] One of these, extracellular dsRNA [poly(I:C)], is a potent viral molecular pattern that triggers innate inflammation through the toll-like receptor (TLR)-3 pathway, resulting in rapid recruitment of neutrophils.[12,13] Genomic and proteomic studies have shown that viruses trigger airway epithelial cells to express and secrete over 570 proteins including soluble type I and type III interferons (IFNs),[14–16] and C-, CXC- and CC-type chemokines.[17–21] These proteins participate in inducing antiviral protection and activate adaptive immunity.[18–21] Our recent systematic study discovered that exosome secretion was a significant component of the epithelial innate anti-viral response, accounting for approximately 1/3 of all the secreted proteins.[18] Although we know that exosomes constitute a significant component of the virus-induced innate response, their functional role in the exacerbations and progression of asthma is poorly understood.
A better insight into how airway inflammation changes exosome content will advance our understanding of their functional role in airway remodelling and accelerate the development of sensitive preclinical assays for regional remodelling. Sampling the bronchoalveolar lavage fluid (BALF) provides a means to selectively study the status of the proximal airway mucosa.[22] Studies examining BALF exosomes isolated from atopic asthmatics have shown that these exosomes have differential cytokine, leukotriene and miRNA content than normal; these biomolecules could potentially regulate bronchial hyperresponsiveness and inflammation.[23,24] Exosomes isolated from ciliated tracheal epithelial cells mediate a protective innate immune response by the expression of sialoproteins that block influenza infection.[25] Others have found that IL-13, a mediator of allergy and Th2 lymphocyte recruitment in asthma, induces exosome production in the airway, promoting chemotaxis of macrophages.[26] Understanding the biological processes mediated by exosomes will provide major new insights into respiratory disease.
For unbiased analysis of exosome function, standard methods should be identified that maintain exosomes in their original biological state as much as possible. Although exosomes are widely thought to be biologically inert vesicles that can be stored for long periods of time,[27] and are stable upon freezing,[28] we observed that the biophysical and protein content of airway exosomes dramatically change upon storage. We therefore conducted a systematic physical characterization and proteomic analysis of BALF exosomes under different temperatures. Our data indicate that storage temperature affects BALF exosome morphology, size and protein content, and this behaviour should be taken into consideration in any diagnostic or mechanistic studies.
Materials and methods
Materials
Polyinosinic–polycytidylic acid poly (I:C) was obtained from Sigma (St Louis, MO, USA) as the sodium salt and freshly prepared in phosphate buffered saline (PBS; 300 μg/40 µl). All PBS used in poly (I:C) administration and exosome isolation was Ca++ and Mg++-free. All reagents and solvents in LC-MS/MS analyses were ACS grade. Ammonium bicarbonate (ABC),2,2,2,-trifluoroethanol(TFE), and acetic acid were purchased from Sigma-Aldrich. Iodoacetamide (IDA), dithiothreitol (DTT), acetonitrile (ACN), formic acid, and methanol were purchased from Thermo Scientific (Waltham, MA, USA). Urea ultra was from MP Biomedicals (Santa Ana, CA, USA). Sequencing-grade modified trypsin and LysC were from Promega (Madison, WI, USA).
Bronchoalveolar lavage (BAL) fluid collection
Male mice (strain C57BL/6J, 8–10 weeks old, 25–30 g) were purchased from Jackson Laboratory (Bar Harbor, ME, USA) and housed according to IACUC protocol# 1312058 (UTMB). For stimulation, mice were lightly anaesthetized and poly (I:C) solution was administered slowly via the intranasal route, alternating nostrils. BALF was collected 24 h later. Anaesthetized mice were tracheostomized and BALF collected by gentle lavage with 1 ml sterile PBS three times. The total BALF recovered (about 3.5 ml) was kept at +4°C and immediately processed for exosome isolation.
Exosome isolation
Isolation of exosomes was performed by differential centrifugation of the BALF following established centrifugation times and parameters.[29,30] All centrifugations and procedures were carried out at +4°C to minimize protein degradation. Cells present in the BALF were removed by low-speed centrifugation at 400 × g for 10 min. The cleared supernatant was then sequentially centrifuged at 2000 × g for 15 min (ThermoScientific IEC CL31R multispeed centrifuge, rotor T41*11210435) and 10,000 × g for 30 min to remove any remaining cell debris/microvesicles (Beckman Optima TLX ultracentrifuge, rotor TLA-100.3, Indianapolis, IN, USA). Exosomes were finally pelleted by ultracentrifugation at 100,000 × g for 2 h and washed in PBS at 100,000 × g, 60 min. After washing, the exosomal pellet was carefully resuspended in a total of 300 µl PBS, divided into aliquots (100 µl each) and analysed immediately (fresh) or stored for four days at +4°C or −80°C. After four days, both exosomal samples were placed on ice, allowing the −80°C sample to thaw. Exosomes in both aliquots were re-pelleted by an additional centrifugation (100,000 × g for 2h) and supernatants collected. Exosomes were evaluated by size and morphological features using dynamic light scattering and transmission electron microscopy. Supernatants were concentrated using Amicon ultra-4 centrifugal filters-3K (Millipore, Billerica, MA, USA). Both exosomes and supernatants were collected for LC-MS/MS analysis.
Dynamic light scattering (DLS)
A 10 µl aliquot from the resuspended exosome sample was diluted in 990 µl of PBS, mixed well and loaded into the cuvette. Three determinations per sample were taken at room temperature using a Malvern High Performance Particle Sizer (HPPS, incorporating non-Invasive Back Scatter Technologies, Malvern Instruments, Westborough, MA, USA) for each independent experiment. The exosome size was calculated using the Stokes–Einstein equation to determine the particle’s hydrodynamic radius (Rh) or diameter. In brief, the Brownian motion of a particle is measured by the fluctuations of scattered light intensity at a fixed angle (173°), laser wavelength 633 nm, as an indication of the velocity distribution of the particle movement in solution. Exosomes suspended in a sample volume of 1 ml of PBS was measured and a total of three readings per sample were performed. Data acquisition and analysis were performed using Dispersion Technology Software (DTS, V4.1.26.0, Bedford Hills, NY, USA) configured for HPPs analysis. DTS analysis allows one to interpret the data acquired considering several parameters, such as intensity, volume and number distribution, as well as statistical analysis. The average particle diameter results from a peak of a Gaussian model fitting to the particle distribution, and the polydispersity index (Pdl) reflects the width of the primary size distribution present in the solution. To ensure proper operation of the instrument the equipment was calibrated periodically using polymer latex spheres (Malvern).
Transmission electron microscopy (TEM)
A 10 µl aliquot from the exosome suspension was diluted in deionized water, applied to 200 mesh Formvar/carbon coated copper grids (Electron Microscopy Sciences, Hatfiled, PA, USA) for 10 min at room temperature (24°C) and negatively stained with 2% uranyl acetate (UA). The grids were examined in a Philips CM-100 transmission electron microscope at 60 kV FEI (Thermo-Fischer, Waltham, MA, USA). Two independent experiments were carried out and several fields were pictured for each experimental condition. Exosome images were acquired with a Gatan Orius 2001 charge-coupled device (CCD, Pleasanton, CA, USA) camera.
Digestion of proteins in exosomes and supernatant
The proteins in 80 µl of the supernatant were reduced with 10 mM dithiothreitol (DTT) for 30 min, followed by alkylation with 30 mM iodoacetamide for 60 min at room temperature in the dark. The proteins were digested with 1.0 μg LysC-tr (Promega) for 12 h at 37°C and then diluted and further digested with 1.0 μg trypsin (Promega) for 16 h at 37°C. The digestion was terminated with 0.5% trifluoroacetic acid.
The proteins present in the exosomes were separated from the lipid components by chloroform/methanol precipitation.[31] After resuspension of the chloroform/methanol precipitation pellet in 45 µl of 8 M guanidine, proteins were reduced with 10 mM DTT for 30 min, followed by alkylation with 30 mM iodoacetamide for 60 min in the dark. The sample was diluted 1:1 with 50 mM ammonium bicarbonate. Proteins were digested with 1.0 μg LysC-tr for 12 h at 37C and then diluted 4:1 with 50 mM NH4HCO3. The proteins were further digested with 1.0 μg trypsin for 16 h at 37°C, and the digestion stopped with 0.5% trifluoroacetic acid. The peptides were desalted on a reversed-phase SepPak C18 cartridge (Waters, Milford, MA, USA), and eluted with 80% acetonitrile. The eluate was dried in a SpeedVac and the peptides acidified with 2% acetonitrile-0.1% trifluoroacetic acid.
LC-MS/MS analysis
A nanoflow UHPLC instrument (Easy nLC, Thermo Fisher Scientific, Waltham, MA, USA) was coupled on-line to a Q Exactive mass spectrometer (Thermo Fisher Scientific) with a nanoelectrospray ion source (Thermo Fisher Scientific). Peptides were loaded onto a C18 reversed-phase column (25 cm long, 75 μm inner diameter) and separated with a linear gradient of 5–35% buffer B (100% acetonitrile in 0.1% formic acid) at a flow rate of 300 nl min–1 over 180 min. MS data were acquired using a data-dependent Top15 method dynamically choosing the most abundant precursor ions from the survey scan (400–1400 m/z) using HCD fragmentation. Survey scans were acquired at a resolution of 70,000 at m/z 400. Unassigned precursor ion charge states as well as singly charged species were excluded from fragmentation. The isolation window was set to 3 Da and fragmented with normalized collision energies of 27. The maximum ion injection times for the survey scan and the MS/MS scans were 20 ms and 60 ms respectively, and the ion target values were set to 1E6 and 1e5, respectively. Selected sequenced ions were dynamically excluded for 30 s. Data were acquired using Xcalibur software (Thermo-Fishcer, Waltham, MA, USA).
Data processing and bioinformatic analysis
Mass spectra were analysed using MaxQuant software version 1.5.2.8 using the Andromeda search engine.[32,33] The initial maximum allowed mass deviation was set to 10 ppm for monoisotopic precursor ions and 0.5 Da for MS/MS peaks. Enzyme specificity was set to trypsin, defined as C-terminal to arginine and lysine excluding proline, and a maximum of two missed cleavages were allowed. Carbamidomethylcysteine was set as a fixed modification, N-terminal acetylation and methionine oxidation as variable modifications. The spectra were searched with the Andromeda search engine against the Human SWISSPROT sequence database (containing 20,193 human protein entries) combined with 248 common contaminants and concatenated with the reversed versions of all sequences. Protein identification required at least one unique or razor peptide per protein group. Quantification in MaxQuant was performed using the built-in XIC-based label-free quantification (LFQ) algorithm.[32] The required false positive rate for identification was set to 1% at the peptide level and 1% at the protein level, and the minimum required peptide length was set to six amino acids. Contaminants, reverse identification and proteins only identified by modified peptides were excluded from further data analysis. The LFQ values were log2-transfomed. After filtering (at least two valid LFQ values in at least one group), the remaining missing LFQ values were imputed from a normal distribution (width 0.3; down-shift 1.8). A two sample t-test was used to assess statistical significance of protein abundances using p ≤ 0.05 as the cut-off. For proteomic data analysis including normalization, statistics, hierarchical clustering, and Fisher’s exact tests, we used the Perseus platform.[34] The unsupervised hierarchical clustering and heat map were based on protein expression. The rows of the heat map indicate the proteins, and the columns indicate the samples. The log2 ratios of each protein were z-score normalized for each row. Hierarchical clustering of the z-normalized log2 ratio was performed using Euclidean distances between means. The number of clusters was set as 300. Genome ontology analysis, molecular functions and signalling pathways in differentially expressed proteins was using the GO Slim analysis in the Panther database (http://pantherdb.org/). This classification uses an evolutionary framework to infer protein functions in a species-independent manner.[35]
Measurement of zeta potential (ζ)
The zeta potentials of BAL exosomes were measured using a ZetaPALS Zeta Potential Analyzer (Brookhaven Instruments Corporation, Holtsville, NY, USA) and previously established procedures.[36] It was not necessary to adjust the exosome concentration or the pH of the solution. The first set of exosomes was measured directly at 18°C. A second sample was stored at +4°C for four days. A third sample was frozen at −80°C for four days, allowed to warm up to room temperature over 60 min and then measured. Each of these procedures was repeated independently five times.
Western immunoblot
Exosome and cell pellets were lysed in sodium dodecyl sulfate (SDS)-urea lysis buffer [5% SDS, 9 M urea, 125 mM Tris HCl pH 6.8 supplemented with protease inhibitor cocktail (Sigma P8340)]. Protein concentration was determined by bicinchoninic acid (BCA, Pierce, Thermo Scientific) and 10 μg were dissolved into SDS loading buffer (with 5% βME) and fractionated on 4–15% Mini-protean TGX gels (BioRad, Hercules CA, USA) in 1× Tris Glycine SDS (TGS) 1× running buffer at room temperature. Proteins were electro-transferred to PVDF (Immobilon-P, Millipore) in 1× TGS buffer-methanol (20%) buffer. The blots were blocked with 5% milk Tween-20 (0.1%) PBS buffer (T-PBS, pH 7.4) for 1 h and incubated overnight at 4°C in primary antibodies. Antibodies were: anti-CD63 (Abcam ab193349); anti-HSP90 (Cell Signaling C45G5, Danvers, MA, USA); anti-Alix/PDC61 (Ab76608); Anti-GRP4 (Cell Signaling #2104); and anti- β-actin (Sigma, AC-15). Secondary antibodies were HRP-conjugated anti-rabbit IgG and anti-mouse IgG from Cell Signaling and Southern Biotech (Birmingham, AL, USA), respectively.
Public submission: We have submitted all relevant data of our experiments to the EV-TRACK knowledgebase (EV-TRACK ID: EV170017).[37]
Results
Our analysis of secreted proteins from RNA virus-infected lung epithelial cells indicated innate pathway activation produced secretion of exosomes and changes in the exosome content of over >240 proteins.[10] Seeking to extend these studies to airway in vivo, we isolated exosomes from mice stimulated with synthetic poly (I:C), a toll-like receptor (TLR)-3 ligand that mimics the effects of viral replication in a much more reproducible manner.[16,19] In preliminary studies, we observed that freshly prepared BALF exosomes had distinctly different dynamic light scattering (DLS) patterns compared to those frozen at −80°C. Intrigued that storage conditions may underlie this effect, we conducted a comparative study using a pool of enriched exosomes freshly prepared from the BALF. BALF exosomes were prepared using conventional ultracentrifugation, washed in PBS, and analysed right after isolation or stored in aliquots at +4°C or at −80°C (Figure 1). To confirm exosome enrichment in our preparation, the fresh exosomal fraction was subjected to Western blot analysis; here we identified the presence of CD63 and Alix (Supplemental Figure 1). Stored samples were re-pelleted by ultracentrifugation, and the storage supernatant saved. The fresh and stored exosome samples were compared by DLS properties, ultrastructural features, charge densities and protein contents by LC-MS/MS. To detect proteins lost during leakage, the storage supernatants were compared to the original wash solution from the fresh exosomes by LC-MS/MS (Figure 1).
Figure 1.
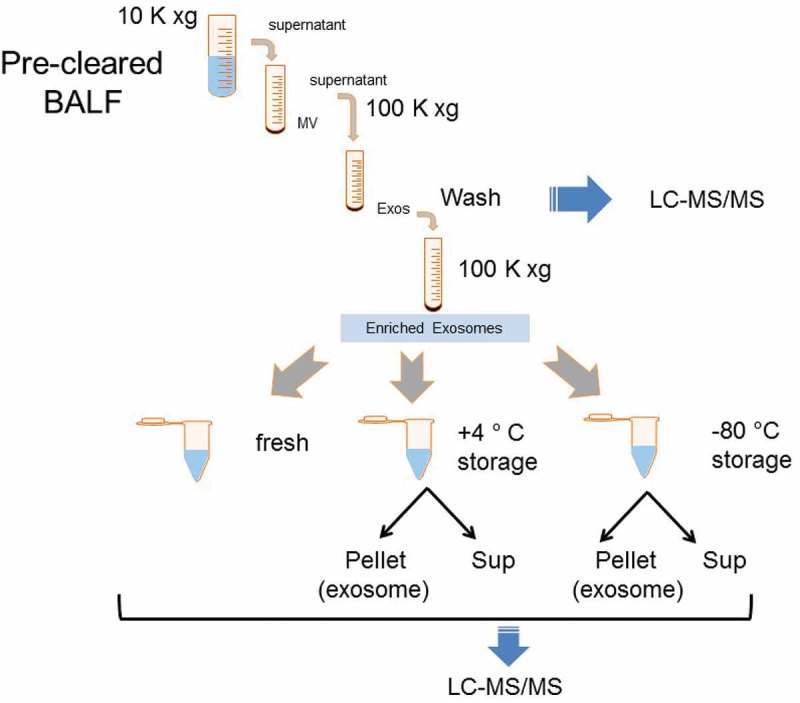
Experimental strategy and analysis of exosome size as a function of storage temperature. Schematic of experiment and protein analysis. Enriched exosomes isolated via differential centrifugation were prepared, washed, and aliquoted for storage under different conditions. After storage, samples were re-pelleted, and the pellet (exosome) and storage supernatant assayed. Blue arrows indicate fractions subjected to unbiased LC-MS/MS analyses.
Temperature effects on exosome DLS properties
To determine the effect of storage temperature on exosome size, the population distribution for the different storage conditions was measured by DLS (Figure 2(a)). Freshly prepared exosomes showed an asymmetric size distribution of 50–170 nm (Figure 2(a)), with an average size of 94.5 ± 1.7 nm (Figure 2(b)). By contrast, exosomes stored at +4°C underwent a shift in average size to 104 ± 1.15 nm (Figure 2(b)). We also observed a dramatic shift to a Poisson-like distribution in the DLS profile of exosomes stored at −80°C, indicating polydispersity in the size distribution. Multiple overlapping Gaussian size distributions result in a long tail mixture appearance, suggesting that freezing produced a population of larger nanovesicle aggregates up to 400 nm in diameter (Figure 2(a)). This shift was observed in two independent isolations, each measured in triplicate (p < 0.05, t-test; Supplemental Figure 2). The average size of the frozen exosomes increased to 125 ± 1.15 nm (Figure 2(b), p < 0.001, t-test). These results were consistent in multiple experiments, and independent of whether the exosomes were thawed slowly on ice or rapidly at 37°C (not shown).
Figure 2.
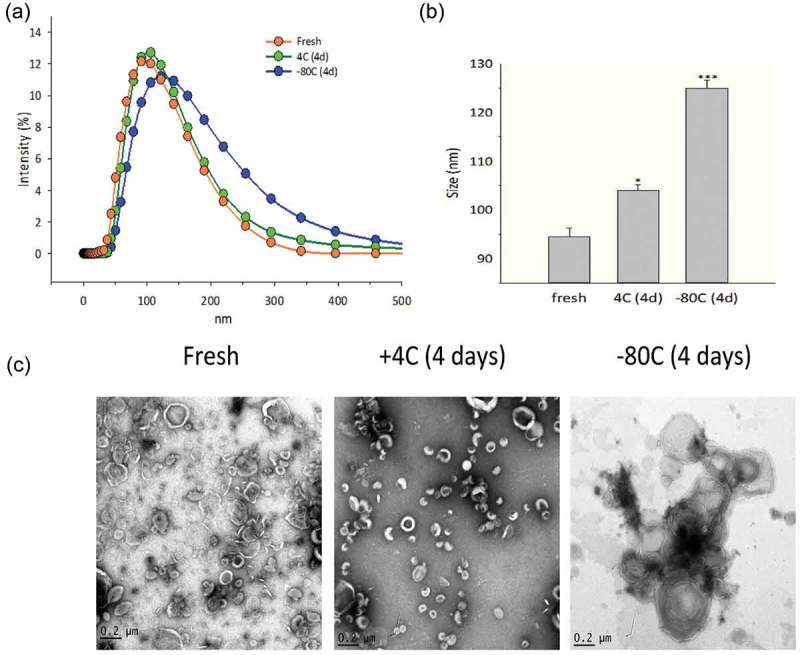
Effects of storage conditions on exosome size and structure. (a) Dynamic light scattering (DLS) analysis. DLS of enriched exosomes after storage relative to fresh preparations. Shown are intensity plots of size distribution. (b) Average exosome size. Shown is the average size for the exosome preparation from n = 2 separate biological replicates. For each indicated temperature, the mean ± SE is shown. * = p < 0.05; *** = p < 0.001. (c) TEM for exosomes as a function of storage temperature. Note the presence of multi-lamellar membranes in −80°C storage. Images are representative of two independent biological experiments. Additional pictures from these preparations are shown in Supplementary Figure 1.
Temperature effects on exosome ultrastructure
To further understand the changes in DLS, we subjected the exosomes to ultrastructural studies using transmission electron microscopy (TEM). Both the freshly prepared exosomes and those stored at +4°C appeared in TEM as isolated, membrane-encapsulated nanovesicles, with the characteristic artificial central depression (“cupping”) ascribed to cellulose embedding (Figure 2(c)).[38] By contrast, the exosomes stored at −80°C were larger, aggregated and showed the appearance of multi-lamellar membrane layers, consistent with the DLS study (additional images are shown in Supplemental Figure 3).
Storage effects on exosome zeta potential (ζ)
We next examined the effect of storage conditions on the charge density distribution around the exosome, a parameter known as the zeta potential (ζ) that is virtually independent of temperature. Freshly prepared BALF exosomes maintained at 18°C demonstrated ζ between −34.8 and −32.4 mV. Individual tracings are shown in Figure 3(a), and average ζ values shown in Figure 3(b). These ζ values are within the potential range expected for airway exosomes due to the high distribution of negatively charged membrane phospholipids.[39] It is remarkable that after thawing from −80°C, the ζ was further diminished to −16.5 mV to −9.88 mV, indicating that the freezing process is extremely disruptive to the exosome structure and physical properties (Figure 3(a), 3(b)). Importantly, at such ζ, the exosomes possess virtually no barrier against fusion processes, providing a physicochemical explanation for the exosome fusion observed in TEM and increased size characterized by DLS. Interestingly, these findings are in agreement with the known structural changes induced by freezing liposomes.[40,41]
Figure 3.
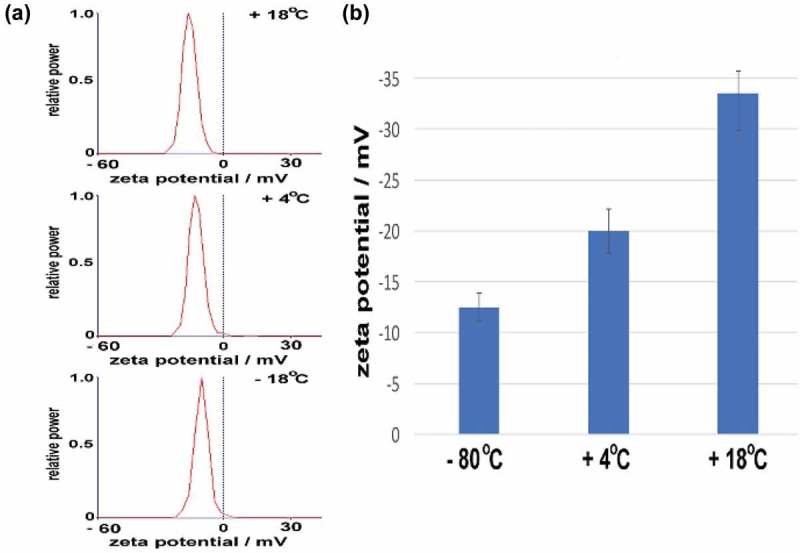
Zeta potential measurements. (a) Individual tracings of BALF exosomes that were stored at + 18°C (fresh), + 4°C or –80°C followed by thawing as indicated. (b) Individual zeta potentials of BAL-derived exosomes for five individual measurements. Note the progressive loss of ζ with storage.
Effects of storage conditions on exosome protein content
To establish a baseline of the exosome content, we conducted unbiased proteomic profiling using LC-MS/MS after lipid depletion using an optimized chloroform/methanol precipitation method.[31] We identified a total of 1140 proteins in freshly isolated exosomes at an FDR of 1% or less. GO Slim analysis of signalling pathways showed significant enrichment of “plasminogen activating cascade”, “cell cycle” and “ubiquitin protein degradation” pathways (Figure 4(a)). Glycolysis and protein translation were identified as the most enriched biological processes in the exosome fractions (Figure 4(b)). The name, identifier, GO annotations, and the fold change of the abundance of the proteins identified are listed in Supplemental Table S1.
Figure 4.
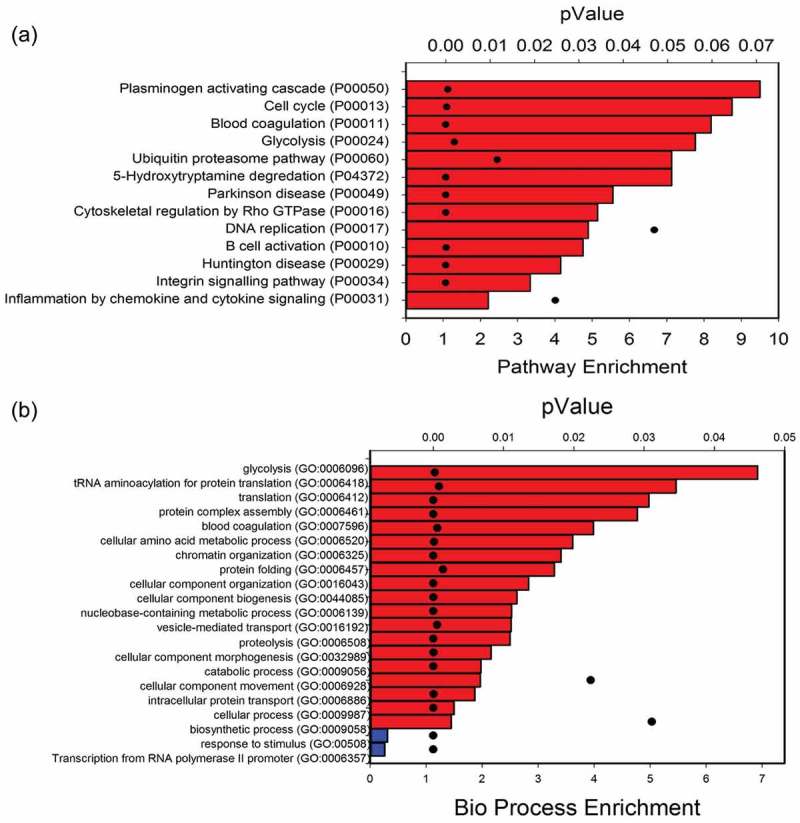
Unbiased proteomics of exosome content in fresh preparations. (a) GO Slim analysis of signalling pathways. A total of 1140 proteins identified in freshly isolated exosomes were mapped to 13 pathways. Bars indicate signalling pathway enrichment (%) over reference human proteome (lower X axis). For each signalling pathway, the p-value of the enrichment is indicated by black dot (top X axis). (b) GO Slim analysis of biological processes. Data are presented as in Figure 4(a). Red bars, biological processes enriched in exosomal fraction; blue, processes depleted.
Fresh vs. +4°C exosomes
To determine whether the different storage conditions affected the exosome protein content, we conducted pairwise comparisons of the freshly isolated exosomes vs. those at +4°C and −80°C storage using label-free LC-MS/MS (Figure 1). Freshly prepared duplicate biological replicates were first profiled vs. exosomes stored at +4°C (representing three independent preparations in two separate biological replicates). In this analysis, differential protein expression was identified using a volcano plot, where −log10 transformed p-value (of two sample t-test) is plotted vs. the fold change in protein abundance of exosomes of the two different storage conditions (fresh vs. +4°C, Figure 5(a)). From this analysis, 544 (47%) of proteins showed no difference in abundance in the exosomes as a result of the storage. However, 457 proteins were changed after +4°C relative to fresh exosomes; of these, 312 were depleted in the exosomes stored at +4°C (Figure 5(a); log2 normalized expression profiles are clustered in Figure 5(c)) (Supplemental Table S1).
Figure 5.
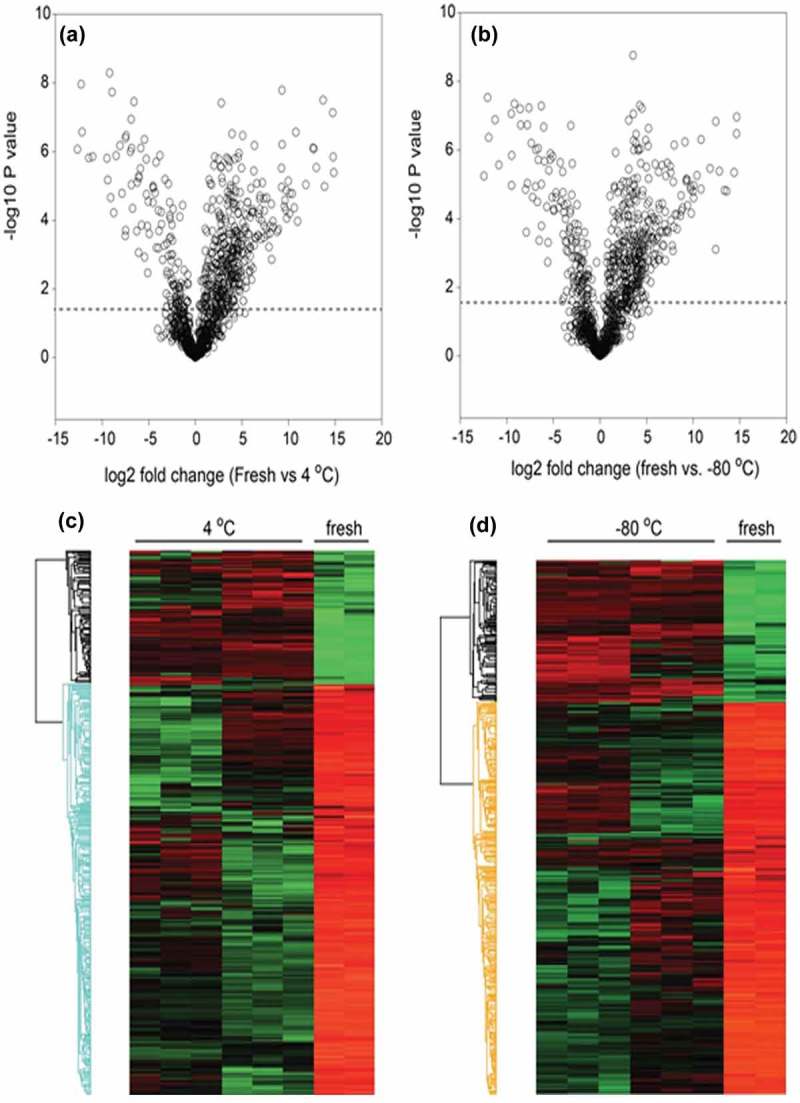
Effect of storage temperatures on exosome protein content. Volcano plots of (a) fresh vs. +4°C; (b) fresh vs. −80°C. (c) Heatmap of significantly changed proteins (fresh vs. +4°C). Log 2 protein abundance was Z-score normalized and subjected to hierarchical clustering. Each row is a protein; columns represent separate experimental replicates. Red, higher level of expression; green, low level of expression. (d) Heatmap of significantly changed proteins (fresh vs. −80°C).
Fresh vs. −80°C exosomes
A similar comparison was performed for freshly isolated exosomes vs. those frozen at −80°C. From this analysis, 527 (46%) of proteins showed no difference in abundance as a result of the storage, and 315 proteins were depleted in exosomes after −80°C storage (Figure 5(b), 5(d) (Supplemental Table S1).
The two groups of storage-depleted proteins were highly overlapping, with 262 proteins in common. Interestingly, these proteins were not statistically enriched in a single GO molecular function, indicating that these storage-labile proteins affect a wide variety of biological processes and molecular functions.
+4°C vs. −80°C exosomes
Finally, differential comparison was also performed for exosomes stored at +4°C vs. −80°C (Figure 6(a)). A total of 848 high-confidence exosome proteins were identified (Table 1). This protein set contained 80 of the top 100 exosome proteins referred in Exocarta and the fractions were enriched in cytoplasmic, ribosomal and vesicular proteins (Table 2). From this analysis, 756 (89%) of proteins showed no difference in abundance as a result of the storage temperature. However, 61 proteins were depleted after +4°C storage (or more abundant in the exosomes stored at −80°C); by contrast, 31 proteins were more abundant in the exosomes stored at +4°C relative to those stored at −80°C, indicating that a small population of exosome proteins was more sensitive to the storage temperature (Figure 6(b)). Consistency in the changes in protein abundance by replicate was analysed by hierarchical clustering of the log2-normalized abundance (Figure 6(b)). A comparison of proteins identified from the +4°C and −80°C storage temperatures is shown by a pie diagram (Figure 6(c)). The name, identifier, GO annotations, and the fold change of the abundance of the proteins identified are listed in Supplemental Table S2.
Figure 6.
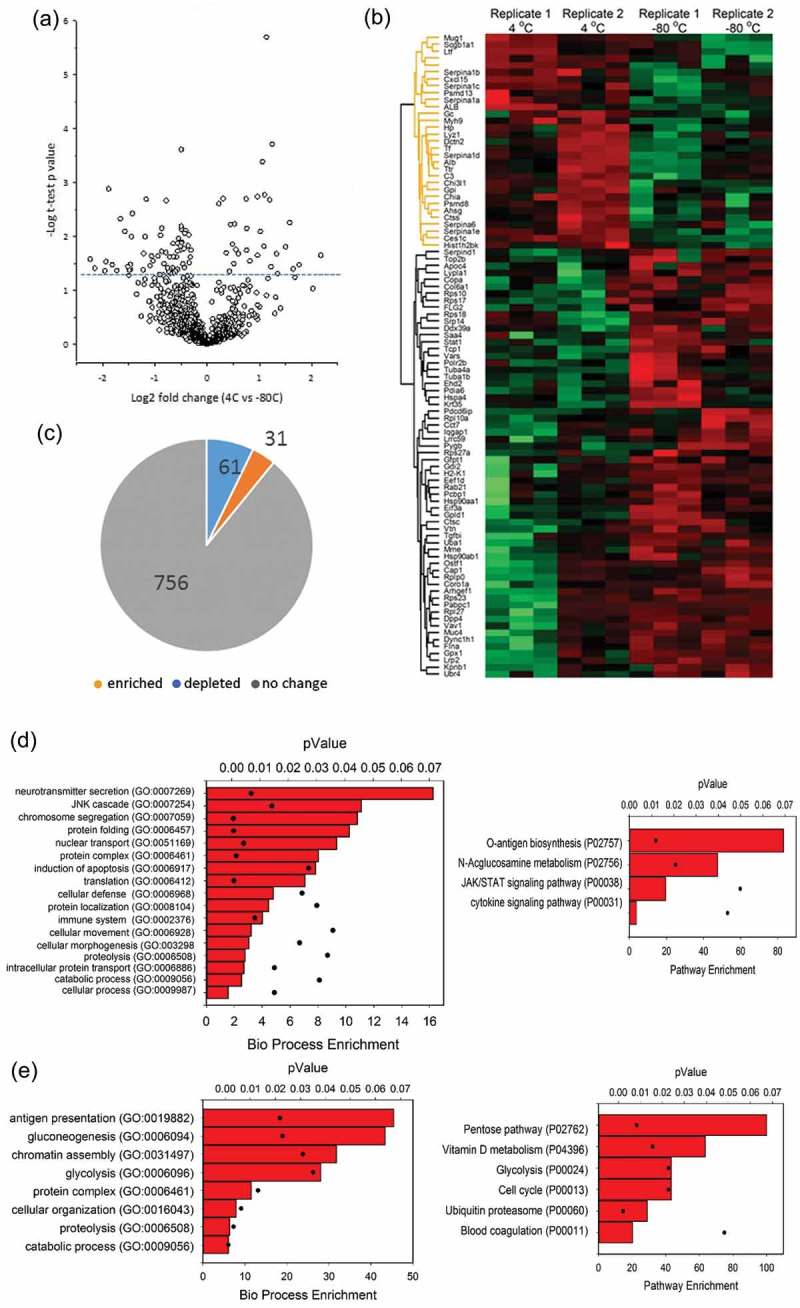
Effects of storage condition on exosome protein content. Unbiased proteomics using label-free LC-MS/MS was conducted on BALF exosomes in six individual samples from two biological replicates. (a) Volcano plot for differentially abundant proteins. Shown is a volcano plot of the differential protein expression. Y axis, – log10 transformed p-value of two sample; X axis, the fold change in protein abundance (+4°C relative to −80°C). (b) Hierarchical clustering as in Figure 4. (c) Pie chart of differentially expressed proteins. (d) Left, GO Slim analysis of biological pathways for 61 proteins depleted from exosomes by storage at 4°C. Each pathway is displayed by % enrichment (bar) and p-value (scatter plot). Right, signalling pathway enrichment. (e) Left, GO analysis of 31 proteins depleted from exosomes by storage at −80°C. Right, signalling pathway enrichment.
Table 1.
Exosomal proteins identified in BALF exosomes. A total of 848 high-confidence exosome proteins identified in stored samples were compared to the Exocarta database. Of the top 100 exosomal proteins, 80 were matched. For each matched protein is listed the gene name, Uniprot identification number (#), characteristics of identification and quantification of changes in abundance by storage condition. Red indicates enrichment and green depletion by comparison of the two storage conditions.
| Protein names | Gene names | Uniprot | Identification |
Quantification |
||||
|---|---|---|---|---|---|---|---|---|
| Razor + unique peptides | Q value | Score | t-test significant | p-value -log10 | Log2 fold change 4°C vs. −80°C |
|||
| Serum albumin | Alb | P07724 | 91 | 0 | 323.31 | + | 1.54 | 0.82 |
| Myosin-9 | Myh9 | Q8VDD5 | 125 | 0 | 323.31 | + | 2.60 | 0.23 |
| Heat shock protein HSP 90-beta | Hsp90ab1 | P11499 | 33 | 0 | 323.31 | + | 1.51 | −0.34 |
| Programmed cell death 6-interacting protein | Pdcd6ip | Q9WU78 | 30 | 0 | 323.31 | + | 1.83 | −0.36 |
| Filamin-A | Flna | Q8BTM8 | 89 | 0 | 323.31 | + | 2.11 | −0.41 |
| Tubulin alpha-1B chain | Tuba1b | P05213 | 34 | 0 | 323.31 | + | 1.89 | −0.48 |
| T-complex protein 1 subunit alpha | Tcp1 | P11983 | 29 | 0 | 297.26 | + | 3.61 | −0.49 |
| Heat shock protein HSP 90-alpha | Hsp90aa1 | P07901 | 13 | 0 | 152.25 | + | 1.34 | −0.70 |
| Importin subunit beta-1 | Kpnb1 | P70168 | 9 | 0 | 41.415 | + | 1.62 | −0.71 |
| Ubiquitin-like modifier-activating enzyme 1 | Uba1 | Q02053 | 22 | 0 | 196.07 | + | 2.02 | −0.89 |
| Rab GDP dissociation inhibitor beta | Gdi2 | Q61598-2 | 9 | 0 | 42.816 | + | 1.63 | −1.06 |
| Ras-related C3 botulinum toxin substrate 1 | Rac1 | P63001 | 4 | 0 | 22.516 | 1.24 | 1.68 | |
| Actin, cytoplasmic 1 | Actb | P60710 | 1 | 0 | 75.629 | 0.87 | 1.32 | |
| Fructose-bisphosphate aldolase A | Aldoa | P05064 | 11 | 0 | 219.1 | 0.53 | 0.96 | |
| Triosephosphate isomerase | Tpi1 | P17751 | 10 | 0 | 75.079 | 0.36 | 0.66 | |
| Peroxiredoxin-1 | Prdx1 | P35700 | 13 | 0 | 119.26 | 0.19 | 0.35 | |
| Annexin A5 | Anxa5 | P48036 | 24 | 0 | 323.31 | 0.46 | 0.33 | |
| Adenosylhomocysteinase | Ahcy | P50247 | 2 | 0 | 4.9712 | 0.32 | 0.31 | |
| EH domain-containing protein 4 | Ehd4 | Q9EQP2 | 8 | 0 | 22.779 | 0.40 | 0.30 | |
| Ras-related protein Rab-1A | Rab1A | P62821 | 2 | 0 | 14.628 | 0.17 | 0.23 | |
| 14-3-3 protein theta | Ywhaq | P68254-2 | 5 | 0 | 18.931 | 0.12 | 0.20 | |
| Alpha-2-macroglobulin | A2m | Q61838 | 94 | 0 | 323.31 | 0.18 | 0.18 | |
| Actin, cytoplasmic 2 | Actg1 | P63260 | 49 | 0 | 323.31 | 0.38 | 0.18 | |
| Clathrin heavy chain 1 | Cltc | Q68FD5 | 42 | 0 | 323.31 | 0.36 | 0.17 | |
| Histone H4 | Hist1h4a | P62806 | 24 | 0 | 323.31 | 0.18 | 0.14 | |
| Annexin A2 | Anxa2 | P07356 | 20 | 0 | 323.31 | 0.24 | 0.12 | |
| Guanine nucleotide-binding protein G(I)/G(S)/G(T) subunit beta-1 | Gnb1 | P62874 | 6 | 0 | 57.544 | 0.28 | 0.10 | |
| L-lactate dehydrogenase A chain | Ldha | P06151 | 12 | 0 | 93.185 | 0.07 | 0.05 | |
| 78 kDa glucose-regulated protein | Hspa5 | P20029 | 14 | 0 | 80.842 | 0.01 | 0.03 | |
| Guanine nucleotide-binding protein G(i) subunit alpha-2 | Gnai2 | P08752 | 8 | 0 | 55.519 | 0.07 | 0.03 | |
| Sodium/potassium-transporting ATPase subunit alpha-1 | Atp1a1 | Q8VDN2 | 14 | 0 | 52.724 | 0.05 | 0.03 | |
| Cofilin-1 | Cfl1 | P18760 | 20 | 0 | 323.31 | 0.05 | 0.02 | |
| Ras-related protein Rap-1b | Rap1b | Q99JI6 | 11 | 0 | 121.29 | 0.07 | 0.01 | |
| Profilin-1 | Pfn1 | P62962 | 17 | 0 | 323.31 | 0.02 | −0.01 | |
| T-complex protein 1 subunit epsilon | Cct5 | P80316 | 25 | 0 | 230.38 | 0.02 | −0.03 | |
| Lactadherin | Mfge8 | P21956-2 | 19 | 0 | 254.73 | 0.07 | −0.05 | |
| T-complex protein 1 subunit gamma | Cct3 | P80318 | 30 | 0 | 323.31 | 0.14 | −0.06 | |
| Lysosome-associated membrane glycoprotein 2 | Lamp2 | P17047-3 | 3 | 0 | 6.5452 | 0.04 | −0.07 | |
| Elongation factor 1-alpha 1 | Eef1a1 | P10126 | 20 | 0 | 323.31 | 0.17 | −0.10 | |
| Transketolase | Tkt | P40142 | 35 | 0 | 323.31 | 0.31 | −0.13 | |
| Glyceraldehyde-3-phosphate dehydrogenase | Gapdh | P16858 | 19 | 0 | 323.31 | 0.32 | −0.13 | |
| T-complex protein 1 subunit beta | Cct2 | P80314 | 41 | 0 | 323.31 | 0.41 | −0.14 | |
| Syntenin-1 | Sdcbp | O08992 | 11 | 0 | 236.88 | 0.39 | −0.14 | |
| Moesin | Msn | P26041 | 44 | 0 | 323.31 | 0.12 | −0.16 | |
| Elongation factor 2 | Eef2 | P58252 | 30 | 0 | 247.09 | 1.09 | −0.18 | |
| Galectin-3-binding protein | Lgals3bp | Q07797 | 27 | 0 | 323.31 | 0.25 | −0.22 | |
| GTP-binding nuclear protein Ran | Ran | P62827 | 11 | 0 | 169.36 | 0.61 | −0.23 | |
| ADP-ribosylation factor 1 | Arf1 | P84078 | 8 | 0 | 51.639 | 0.43 | −0.24 | |
| 14–3-3 protein epsilon | Ywhae | P62259 | 7 | 0 | 73.25 | 0.14 | −0.24 | |
| Phosphoglycerate kinase 1 | Pgk1 | P09411 | 22 | 0 | 323.31 | 0.86 | −0.26 | |
| Major vault protein | Mvp | Q9EQK5 | 56 | 0 | 323.31 | 0.19 | −0.27 | |
| Pyruvate kinase PKM | Pkm | P52480 | 54 | 0 | 323.31 | 0.75 | −0.28 | |
| Transitional endoplasmic reticulum ATPase | Vcp | Q01853 | 54 | 0 | 323.31 | 1.11 | −0.32 | |
| Ras-related protein Rab-7a | Rab7a | P51150 | 13 | 0 | 323.31 | 0.34 | −0.33 | |
| Annexin A11 | Anxa11 | P97384 | 13 | 0 | 86.482 | 0.39 | −0.34 | |
| Guanine nucleotide-binding protein G(I)/G(S)/G(T) subunit beta-2 | Gnb2 | P62880 | 12 | 0 | 121.16 | 0.73 | −0.34 | |
| Heat shock 70 kDa protein 1A | Hspa1a | Q61696 | 9 | 0 | 37.922 | 0.23 | −0.34 | |
| Fatty acid synthase | Fasn | P19096 | 29 | 0 | 141.38 | 1.27 | −0.38 | |
| Cell division control protein 42 homologue | Cdc42 | P60766 | 8 | 0 | 125.08 | 0.66 | −0.38 | |
| Transforming protein RhoA | Rhoa | Q9QUI0 | 9 | 0 | 112.21 | 0.26 | −0.39 | |
| Peroxiredoxin-2 | Prdx2 | Q61171 | 4 | 0 | 6.8609 | 0.46 | −0.41 | |
| Annexin A4 | Anxa4 | P97429 | 15 | 0 | 134.02 | 0.36 | −0.44 | |
| Heat shock cognate 71 kDa protein | Hspa8 | P63017 | 46 | 0 | 323.31 | 1.23 | −0.45 | |
| Alpha-enolase | Eno1 | P17182 | 35 | 0 | 323.31 | 0.32 | −0.49 | |
| Chloride intracellular channel protein 1 | Clic1 | Q9Z1Q5 | 17 | 0 | 187.54 | 1.08 | −0.49 | |
| 14-3-3 protein beta/alpha | Ywhab | Q9CQV8-2 | 5 | 0 | 25.722 | 0.40 | −0.51 | |
| Ras-related protein Rab-5C | Rab5c | P35278 | 6 | 0 | 61.235 | 0.24 | −0.54 | |
| 14-3-3 protein zeta/delta | Ywhaz | P63101 | 13 | 0 | 186.14 | 0.70 | −0.55 | |
| Annexin A1 | Anxa1 | P10107 | 27 | 0 | 323.31 | 0.85 | −0.58 | |
| Ras-related protein Rab-14 | Rab14 | Q91V41 | 9 | 0 | 72.052 | 0.59 | −0.59 | |
| ATP-citrate synthase | Acly | Q91V92 | 23 | 0 | 197.13 | 0.78 | −0.63 | |
| Thrombospondin-1 | Thbs1 | P35441 | 7 | 0 | 34.905 | 0.40 | −0.65 | |
| Ezrin | Ezr | P26040 | 24 | 0 | 323.31 | 0.20 | −0.66 | |
| Erythrocyte band 7 integral membrane protein | Stom | P54116 | 3 | 0 | 14.57 | 0.99 | −0.74 | |
| L-lactate dehydrogenase B chain | Ldhb | P16125 | 3 | 0 | 7.6375 | 0.22 | −0.76 | |
| Alpha-actinin-4 | Actn4 | P57780 | 7 | 0 | 46.719 | 0.66 | −0.81 | |
| Pyruvate kinase PKM | Pkm | P52480-2 | 2 | 0 | 11.758 | 0.79 | −0.84 | |
| Annexin A6 | Anxa6 | P14824 | 17 | 0 | 94.565 | 0.72 | −0.88 | |
| Tubulin alpha-1A chain | Tuba1a | P68369 | 3 | 0 | 66.81 | 0.88 | −0.95 | |
| Peptidyl-prolyl cis-trans isomerase A | Ppia | P17742 | 14 | 0 | 161.63 | 0.79 | −1.11 | |
Table 2.
Subcellular compartment enrichment of exosomal proteins. A total of 848 high-confidence exosome proteins from stored samples were analysed for subcellular component by GO-Slim (Panther database). Shown are the fold enrichment of the pathway and the significance (p-value, Bonferroni correction).
| PANTHER GO-Slim cellular component | Enrichment | p-value |
|---|---|---|
| Ribosome (GO:0005840) | 12.64 | 1.09E-36 |
| Cytosol (GO:0005829) | 7.4 | 9.33E-40 |
| Vesicle coat (GO:0030120) | 6.53 | 2.49E-03 |
| Ribonucleoprotein complex (GO:0030529) | 6.16 | 7.39E-29 |
| Actin cytoskeleton (GO:0015629) | 4.43 | 8.50E-10 |
| Macromolecular complex (GO:0032991) | 2.7 | 2.40E-21 |
| Cytoskeleton (GO:0005856) | 2.47 | 2.05E-06 |
| Cytoplasm (GO:0005737) | 2.43 | 1.58E-23 |
| Extracellular space (GO:0005615) | 2.26 | 4.94E-05 |
| Organelle (GO:0043226) | 2.07 | 8.58E-19 |
| Intracellular (GO:0005622) | 1.92 | 1.34E-23 |
| Cell part (GO:0044464) | 1.89 | 2.08E-22 |
| Extracellular region (GO:0005576) | 1.83 | 1.87E-03 |
| Membrane (GO:0016020) | 0.36 | 9.08E-11 |
| Plasma membrane (GO:0005886) | 0.32 | 2.36E-07 |
| Integral to membrane (GO:0016021) | < 0.2 | 4.91E-15 |
The 61 proteins more abundant in the −80°C storage relative to the +4°C storage condition were further analysed for by GO Slim for biological process and signalling pathways. The top three biological processes of 17 that were enriched included “neurotransmitter secretion”, “JNK cascade” and “chromosomal segregation” (Figure 6(d), left). “O-antigen biosynthesis” was the top-ranked signalling pathway (Figure 6(d), right).
Conversely, 31 proteins were more abundant at +4°C relative to −80°C storage conditions, indicating their depletion by storage at −80°C (Figure 6(b)). The top two biological processes of the eight enriched processes were “antigen presentation” and “gluconeogenesis” (Figure 6(e), left). Two of the top signalling pathways identified were “pentose pathway” and “vitamin D metabolism” (Figure 6(e), right). These data indicate that exosome storage will not only affect vesicular structure and charge density, but also the biological function of its contents.
Protein dissociation and leakage from exosomes into the supernatant upon storage
To further understand the effects of storage, we used LC-MS/MS to identify and quantify the proteins in the supernatant after +4°C and −80°C storage (Figure 1). A total of 699 proteins were identified with high confidence, and functionally analysed by GO classification (Supplemental Table S3). Interestingly, these proteins affect biological pathways that are functionally distinct from those identified in the exosome preparation. For example, the supernatant proteins are enriched in carbohydrate metabolism (gluconeogenesis/glycolysis), TCA cycle and fatty acid biosynthesis pathways (Table 3). These proteins were compared for differential expression by plotting the – log10 transformed p-value vs. the fold change of protein abundance in the volcano plot shown in Figure 7(a). We noted that the expression of 554 proteins is unchanged, appearing in the supernatant independently on the storage conditions. Consistency in the changes in protein abundance by replicate was analysed by hierarchical clustering of the log2-normalized abundance (Figure7(b)), Interestingly, a smaller group of proteins appeared in the supernatants depending on the storage conditions; 67 proteins were enriched in the supernatant from the exosomes stored at −80°C, and a set of 78 unique proteins was enriched in the supernatant from the exosomes stored at +4°C (p < 0.05) (Figure 7(c)).
Table 3.
GO analysis of leak/peri-exosomal proteins. A total of 699 high-confidence proteins appearing in the +4°C and −80°C storage supernatant were analysed for biological processes by GO-Slim (Panther database). Shown are the fold enrichment of the biological process and the significance (p-value, Bonferroni correction).
| PANTHER GO-Slim biological process | Enrichment | p-value |
|---|---|---|
| Gluconeogenesis (GO:0006094) | 10.99 | 5.44E-03 |
| Tricarboxylic acid cycle (GO:0006099) | 10.45 | 1.57E-03 |
| Glycolysis (GO:0006096) | 9.8 | 1.28E-04 |
| Fatty acid biosynthetic process (GO:0006633) | 6.3 | 1.53E-03 |
| Purine nucleobase metabolic process (GO:0006144) | 6.28 | 1.90E-04 |
| Protein complex assembly (GO:0006461) | 5.16 | 4.86E-07 |
| Protein complex biogenesis (GO:0070271) | 5.13 | 5.40E-07 |
| Blood coagulation (GO:0007596) | 4.62 | 9.15E-03 |
| Monosaccharide metabolic process (GO:0005996) | 4.2 | 1.01E-02 |
| Chromatin organization (GO:0006325) | 4.04 | 2.32E-07 |
| Macrophage activation (GO:0042116) | 3.96 | 3.51E-02 |
| Fatty acid metabolic process (GO:0006631) | 3.83 | 7.00E-05 |
| Translation (GO:0006412) | 3.64 | 1.18E-06 |
| Proteolysis (GO:0006508) | 3.59 | 1.14E-13 |
| Cellular component biogenesis (GO:0044085) | 3.45 | 2.17E-09 |
| Cellular amino acid metabolic process (GO:0006520) | 3.34 | 5.79E-04 |
| Generation of precursor metabolites and energy (GO:0006091) | 3.22 | 2.96E-03 |
| Catabolic process (GO:0009056) | 2.98 | 7.38E-11 |
| Lipid metabolic process (GO:0006629) | 2.78 | 1.97E-06 |
| Cellular component organization or biogenesis (GO:0071840) | 2.58 | 4.22E-18 |
| Cellular component organization (GO:0016043) | 2.45 | 4.05E-14 |
| Cellular component morphogenesis (GO:0032989) | 2.21 | 2.02E-02 |
| Organelle organization (GO:0006996) | 2.15 | 1.30E-03 |
| Protein metabolic process (GO:0019538) | 2.12 | 3.65E-12 |
| Immune system process (GO:0002376) | 1.79 | 3.12E-03 |
| Primary metabolic process (GO:0044238) | 1.69 | 2.39E-18 |
| Transport (GO:0006810) | 1.61 | 3.94E-03 |
| Metabolic process (GO:0008152) | 1.58 | 2.75E-16 |
| Localization (GO:0051179) | 1.55 | 9.11E-03 |
| Cellular process (GO:0009987) | 1.24 | 1.05E-03 |
| Multicellular organismal process (GO:0032501) | 0.58 | 2.03E-02 |
| Unclassified (UNCLASSIFIED) | 0.57 | 0.00E+00 |
| RNA metabolic process (GO:0016070) | 0.53 | 1.81E-02 |
| Developmental process (GO:0032502) | 0.5 | 7.71E-03 |
| Cell surface receptor signalling pathway (GO:0007166) | 0.42 | 4.02E-03 |
| Neurological system process (GO:0050877) | 0.34 | 4.45E-05 |
| Transcription from RNA polymerase II promoter (GO:0006366) | 0.27 | 2.92E-04 |
| Regulation of transcription from RNA polymerase II promoter (GO:0006357) | 0.25 | 3.13E-03 |
| Sensory perception (GO:0007600) | 0.25 | 7.18E-05 |
| G-protein coupled receptor signalling pathway (GO:0007186) | 0.25 | 1.22E-02 |
| Transcription, DNA-dependent (GO:0006351) | 0.21 | 3.82E-07 |
Figure 7.
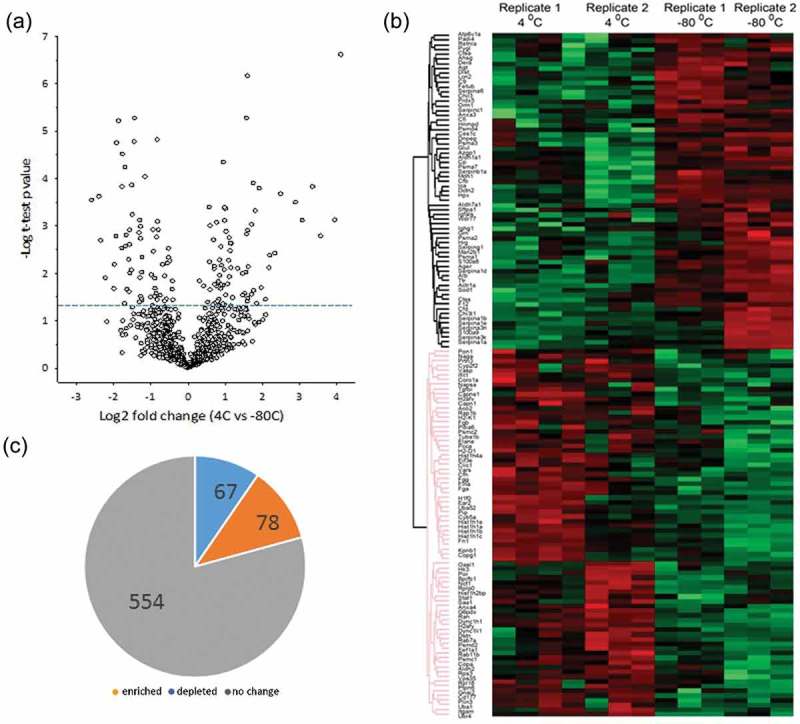
Effect of storage condition on leakage and dissociation of peri-exosomal proteins. Unbiased proteomics using label-free LC-MS/MS were conducted on peri-exosomal proteins (supernatants after storage) of six individual samples from two biological replicates. (a) Volcano plot for proteins differentially expressed. Y axis, – log10 transformed p-value of two samples; the X axis is the fold change in protein abundance. (b) Hierarchical clustering. Log 2 protein abundance was Z-score normalized and subjected to hierarchical clustering. Each row is a protein; columns represent separate experimental replicates. (c) Pie chart of differentially expressed proteins.
We next analysed the supernatant fractions for the presence of the 61 proteins depleted from the exosome preparations stored at +4°C. We found that 22 proteins depleted during +4°C storage did not appear in the supernatant. We interpret these data to mean that these proteins were metabolized or degraded at +4°C. Conversely, 29 of the 31 proteins depleted from the exosome preparations stored at −80°C appeared in the soluble supernatant. These proteins included cytokines (CXCL15, CC10) and serine proteases (Serpina-1c and -1d, shown in heat map in Figure 6(b)). We interpret this finding to indicate that the majority of the proteins lost at −80°C leaked into the supernatant due to membrane fusion and/or membrane disruption.
Identification of proteins in the supernatant during storage
To further exclude the possibility that the proteins appearing in the storage supernatants were due to nonspecific contamination, we conducted a quantitative proteomic analysis of the “wash” sample from the 100,000 × g centrifugation (Figure 1). By “volcano plot” analysis, the protein abundance of 224 proteins were significantly increased in the exosome supernatant after +4°C storage relative to the starting wash buffer (Figure 8(a), Table 4, Supplemental Table S4), clearly demonstrating that these proteins were not due to carryover from inadequate washing. These proteins represent a combination of: (1) proteins initially tightly associated with exosomes later dissociate during storage; (2) proteins that are secreted during storage; or (3) proteins that are released due to exosome lysis/leakage. It is important to note that the biological processes of these supernatant proteins are distinct from those of the parent exosome, arguing against nonspecific exosome leakage. For example the top two enriched biological processes were “transcriptional regulation” and “chromatin organization” (compare Table 4 and Supplemental Table S4 with Table 3). As discussed further on, we suggest that the most cogent explanation is that these proteins represent dissociated, “peri-exosomal” proteins.
Figure 8.
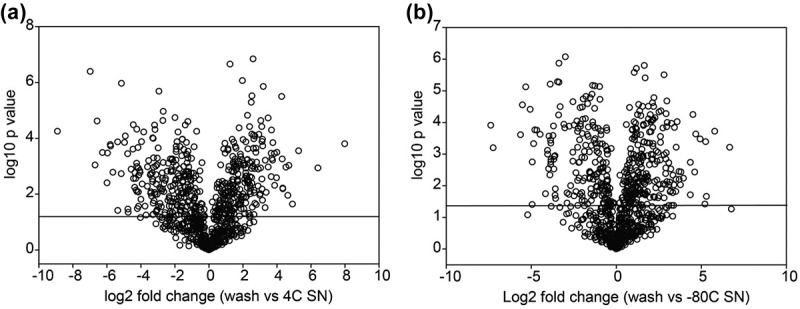
Relationship of differentially expressed exosome proteins with leakage/peri-exosomal proteins. (a) Volcano plot for proteins differentially increased in 4°C storage supernatant vs. the original wash. Y axis, – log10 transformed p value of two samples; the X axis is the fold change of protein abundance. (b) Volcano plot for proteins differentially increased in −80°C storage supernatant vs. the wash.
Table 4.
Biological processes of leak/peri-exosomal proteins enriched at 4°C storage. A total of 224 high-confidence proteins enriched in the supernatant after 4°C storage were analysed for biological processes by GO-Slim (Panther database). Shown are the fold enrichment of the pathway and the p-value (Bonferroni correction).
| PANTHER GO-Slim biological process | Enrichment | p-value |
|---|---|---|
| Transcription initiation from RNA polymerase II promoter (GO:0006367) | 11.63 | 1.98E-02 |
| Chromatin organization (GO:0006325) | 10 | 1.52E-14 |
| Protein complex assembly (GO:0006461) | 8.51 | 6.49E-06 |
| Protein complex biogenesis (GO:0070271) | 8.46 | 6.93E-06 |
| Translation (GO:0006412) | 5.79 | 6.35E-06 |
| Cellular component biogenesis (GO:0044085) | 5.21 | 9.74E-08 |
| Organelle organization (GO:0006996) | 4.55 | 1.35E-09 |
| Cellular component organization or biogenesis (GO:0071840) | 4.15 | 1.01E-20 |
| Cellular component organization (GO:0016043) | 3.86 | 7.44E-16 |
| Proteolysis (GO:0006508) | 3.33 | 2.44E-03 |
| Catabolic process (GO:0009056) | 2.97 | 3.98E-03 |
| Protein metabolic process (GO:0019538) | 2.52 | 5.65E-07 |
| Primary metabolic process (GO:0044238) | 1.88 | 9.00E-10 |
| Metabolic process (GO:0008152) | 1.72 | 2.16E-08 |
| Cellular process (GO:0009987) | 1.38 | 6.49E-03 |
| Unclassified (UNCLASSIFIED) | 0.67 | 0.00E+00 |
Conversely, 194 proteins were significantly increased in the exosome supernatant after −80°C storage relative to the starting wash buffer (Figure 8(b), Supplemental Table S5). The major biological processes encoded by these proteins were “chromatin organization” and “protein folding” (Table 5), functions also distinct from those of the parent exosome. We note that the abundance of the proteins increased in the supernatants in either condition was greater than the number of proteins depleted from the exosomes during storage (cf. Figure 6(c)).
Table 5.
Biological processes of leak/peri-exosomal proteins enriched at −80°C storage. A total of 194 high-confidence proteins enriched in the supernatant after −80°C storage were analysed for biological processes by GO-Slim (Panther database). Shown are the fold enrichment of the pathway and the p-value (Bonferroni correction).
| PANTHER GO-Slim biological process | Enrichment | p- value |
|---|---|---|
| Chromatin organization (GO:0006325) | 10.58 | 1.91E-14 |
| Protein folding (GO:0006457) | 8.62 | 1.27E-03 |
| Protein complex assembly (GO:0006461) | 8.6 | 2.18E-05 |
| Protein complex biogenesis (GO:0070271) | 8.55 | 2.31E-05 |
| Organelle organization (GO:0006996) | 4.68 | 3.26E-09 |
| Cellular component biogenesis (GO:0044085) | 4.18 | 4.50E-04 |
| Proteolysis (GO:0006508) | 3.88 | 1.44E-04 |
| Cellular component organization or biogenesis (GO:0071840) | 3.41 | 1.23E-11 |
| Cellular component organization (GO:0016043) | 3.15 | 1.61E-08 |
| Catabolic process (GO:0009056) | 2.79 | 3.64E-02 |
| Protein metabolic process (GO:0019538) | 2.49 | 5.96E-06 |
| Primary metabolic process (GO:0044238) | 1.84 | 6.66E-08 |
| Metabolic process (GO:0008152) | 1.68 | 1.39E-06 |
| Unclassified (UNCLASSIFIED) | 0.68 | 0.00E+00 |
| Response to stimulus (GO:0050896) | 0.38 | 3.02E-02 |
Discussion
Exosomes have been implicated in the progression of diseases of the airway mucosa, including asthma and chronic obstructive lung diseases.[25,26,42,43] In addition, we have recently demonstrated that exosome secretion is a significant component of the epithelial innate immune response.[18] Understanding how airway epithelial exosomes influence viral induced inflammation and remodelling will be dependent on isolation conditions that preserve exosomes in biologically active and native states. Here we report our studies on the systematic effects of storage on airway exosome characteristics and content. Prepared by a standard ultracentrifugation technique, our exosome preparations meet the International Society for Extracellular Vesicles (ISEV) definitions of exosome-enriched fractions [44] by their isolation from an extracellular fluid (BALF), composition as membrane-bound vesicles, size distribution and enrichment of established exosome markers by comparison to the ExoCarta database and Western blot (see Figure 2, Supplemental Figure 1, Tables 1 and 2). Using this exosome-enriched preparation, our study indicates that different methods of storage have significant effects on exosome structure, surface characteristics and protein content. Our findings also identify the presence of storage-labile external proteins coating airway exosomes, proteins we refer to as “peri-exosomal”. We will discuss potential mechanisms for these storage phenomena and their implications for exosome diagnostics.
The most significant finding of our study is that freezing airway exosomes results in increased size, promoting multilamellar vesicle formation and aggregation. These findings are consistent with others that have observed size changes in exosomes subjected to freeze/thaw treatment.[45] As membrane-coated vesicles, we contend that studies on liposome behaviour are relevant to exosomal behaviour. Previous work showed that freezing liposomes induces the formation of multilamellar vesicles.[40,41] Freezing induces multilamellar vesicles by a process involving expansion of ice nano- or micro-crystals in the lipid bilayer and consequent membrane disruption.[46] These microcrystals produce de-mixing of biological surfactants, resulting in fusion between miscible membranes.[47,48] These phenomena are clearly reflected in the morphological changes of frozen exosomes observed in our study (Figure 2(c) and Supplementary Figure 2). Structural disruption and fusion of exosomes has significant impact on advancing airway diagnostics. For example, our studies discovered that exosome content varies by epithelial cell type.[18] Fusion and subsequent mixing of biological molecules produced by freezing and thawing will have profound consequences for the ability of microfluidic [49] and magnetic-bead based technologies [50] to monitor these individual exosome populations. The addition of trehalose has recently been suggested to block the formation of ice nano- micro-crystals.[51] However, this problem has not been solved because strategies for avoiding the de-mixing phenomena have yet to be developed.
Another finding of our study is that storage conditions affects the proteomic content of airway exosomes. Analysis of cell-culture derived exosomes has shown that storage at +4°C has a significant impact on CD63 and Hsp70 content,[46] a finding validated the relative depletion of CD63 by Western blot in our stored samples (Supplemental Figure 1). Our unbiased LC-MS/MS studies have significantly extended the spectrum of proteins depleted by storage at +4°C and −80°C. Interestingly to us, distinct populations of proteins are lost under these two storage conditions. These differences map to specific biological functions encoding coagulation, ubiquitin-mediated proteolysis and chemokine inflammatory pathways. Consequently, storage conditions may have a significant effect on biological functions of airway exosomes, a conclusion supported by the findings that one day of storage at either −20°C or +4°C affected the anti-bacterial effect of neutrophilic exosomes.[47] We are aware that others have found that storage at −80°C prior to exosome isolation does not have a significant effect on protein contents by MS, or change in exosome morphology.[28] In that study, whole plasma was frozen before exosome isolation, whereas in our study, storage occurred after purification. One explanation for this discrepancy is that the presence of concentrated plasma proteins could help to minimize the effects of freezing on exosomal fusion.
In experiments designed to understand the effects of storage conditions on exosome protein leakage, we identified over 224 high-confidence proteins that appear in the storage supernatant that were not initially present in the initial wash. These may represent proteins that are initially tightly associated with the exosomes that later dissociate, or proteins that are secreted from the exosome, or those that may be released from lysis. Because the biological functions of the storage supernatant proteins are distinct from that of the exosome population, we think it unlikely that exosome lysis is the explanation. Similarly, we know of no studies that have demonstrated that exosomes secrete proteins actively. Rather, we interpret the appearance of proteins in storage solutions as most likely due to dissociation of non-plasma membrane-integrated “peri-exosomal proteins”. Exosome preparations isolated from complex biological fluids are coated with proteins in the biological fluids from which they are found. For example, exosomes isolated from human ciliated tracheal bronchial epithelial cells are associated with filamentous mucins (MUCs) 1 and 4, proteins uniquely found within the airway fluid.[25,39] By contrast, exosomes isolated from plasma are bound by serum proteins, including albumin.[48] Because exosomal charge density is influenced by the presence of surface-associated proteins, this phenomenon may be explained by our finding that 194 proteins dissociate from the frozen exosomes. Since exosomes are thought to mediate intercellular signal transduction by direct fusion or endosomal uptake by target cells,[1,2] we think our findings have important implications for the experimental design of studies to understand how airway exosomes participate in cell–cell communication. These peri-exosomal proteins may influence exosome targeting and biological behaviour in ways that are not presently fully understood.
In conclusion, we believe these findings are important for informing approaches for functional studies and biosensing assays of airway exosomes. Specifically, the freeze–thaw cycle leads to drastic changes in biophysical properties, content and biomarkers present on the external surfaces of exosomes. Our studies provide critical information for how airway exosomes can be stored to best preserve their biological function and content, enabling their use as biomarkers and/or therapeutic targets.
Supplementary Material
Acknowledgements
Core laboratory support was provided by the Sealy Center for Molecular Medicine Selected Reaction Monitoring facility and the UTMB Optical imaging and Histochemistry Facilities. We thank Dr David Konkel for editing the manuscript.
Biography
RM, YZ, MJ, HW, MK, YZ, JL, HS performed and interpreted experiments. YZ, CC, SB, MM and ARB conceived and designed experiments. ARB, RM, YZ, MJ, SB, and MM wrote the manuscript. All authors approved the final submitted manuscript.
Funding Statement
Research support was provided by the Sealy Center for Molecular Medicine, NIAID Signaling in Airway inflammation PO1 AI068865 (ARB), UTMB CTSA UL1TR001439 (ARB), NIEHS P30 ES006676 (ARB), and DMS-1361411/DMS-1361318 (ARB). SHB and CTC acknowledge support from the Johnson Cancer Center at Kansas State University.
Disclosure statement
No potential conflict of interest was reported by the authors.
Supplemental data
Supplemental data for this article can be accessed here.
References
- [1].Thery C, Zitvogel L, Amigorena S.. Exosomes: composition, biogenesis and function. Nat Rev Immunol. 2002;2:569–18. [DOI] [PubMed] [Google Scholar]
- [2].Colombo M, Raposo G, Théry C. Biogenesis, secretion, and intercellular interactions of exosomes and other extracellular vesicles. Annu Rev Cell Dev Biol. 2014;30:255–289. [DOI] [PubMed] [Google Scholar]
- [3].Stremersch S, De Smedt SC, Raemdonck K. Therapeutic and diagnostic applications of extracellular vesicles. J Control Release. 2016;244:167–183. [DOI] [PubMed] [Google Scholar]
- [4].Busse WW, Lemanske RF. Asthma. New England J Med. 2001;344:350–362. [DOI] [PubMed] [Google Scholar]
- [5].Akinbami LJ, Moorman JE, Bailey C, et al. Trends in asthma prevalence, health care use, and mortality in the USA, 2001-2010. NCHS Data Brief. 2012;94:1–8. [PubMed] [Google Scholar]
- [6].Lambrecht BN, Hammad H. The airway epithelium in asthma. Nat Med. 2012;18:684–692. [DOI] [PubMed] [Google Scholar]
- [7].Johnston SL. Overview of virus-induced airway disease. Proc Am Thorac Soc. 2005;2:150–156. [DOI] [PubMed] [Google Scholar]
- [8].Al-Muhsen S, Johnson JR, Hamid Q. Remodeling in asthma. J Allergy Clin Immunol. 2011;128:451-462; quiz 463-454. [DOI] [PubMed] [Google Scholar]
- [9].Tian B, Patrikeev I, Ochoa L, et al. NFkappaB mediates mesenchymal transition, remodeling and pulmonary fibrosis in response to chronic inflammation by viral RNA patterns. Am J Respir Cell Mol Biol. 2017;56:506–520. [DOI] [PMC free article] [PubMed] [Google Scholar]
- [10].Knight DA, Holgate ST. The airway epithelium: structural and functional properties in health and disease. Respirology. 2003;8:432–446. [DOI] [PubMed] [Google Scholar]
- [11].Whitsett JA, Alenghat T. Respiratory epithelial cells orchestrate pulmonary innate immunity. Nat Immunol. 2015;16:27–35. [DOI] [PMC free article] [PubMed] [Google Scholar]
- [12].Starkhammar M, Kumlien Georén S, Swedin L, et al. Intranasal Administration of poly(I:C) and LPS in BALB/c Mice induces airway hyperresponsiveness and inflammation via different pathways. PLoS ONE. 2012;7:e32110. [DOI] [PMC free article] [PubMed] [Google Scholar]
- [13].Guillot L, Le Goffic R, Bloch S, et al. Involvement of toll-like receptor 3 in the immune response of lung epithelial cells to double-stranded RNA and influenza A virus. J Biol Chem. 2005;280:5571–5580. [DOI] [PubMed] [Google Scholar]
- [14].Garofalo R, Mei F, Manganaro M, et al. Upregulation of class I major histocompatibility complex (MHC) molecules on respiratory syncytial virus (RSV)-infected airway epithelial cells. Am J Respir Crit Care Med. 1994;149:A987. [Google Scholar]
- [15].Jamaluddin M, Wang S, Garofalo RP, et al. IFN-beta mediates coordinate expression of antigen-processing genes in RSV-infected pulmonary epithelial cells. Am J Physiol Lung Cell Mol Physiol. 2001;280:L248–L257. [DOI] [PubMed] [Google Scholar]
- [16].Tian B, Zhao Y, Kalita M, et al. CDK9-dependent transcriptional elongation in the innate interferon-stimulated gene response to respiratory syncytial virus infection in airway epithelial cells. J Virol. 2013;87:7075–7092. [DOI] [PMC free article] [PubMed] [Google Scholar]
- [17].Zhang Y, Luxon BA, Casola A, et al. Expression of respiratory syncytial virus-induced chemokine gene networks in lower airway epithelial cells revealed by cDNA microarrays. J Virol. 2001;75:9044–9058. [DOI] [PMC free article] [PubMed] [Google Scholar]
- [18].Zhao Y, Jamaluddin M, Zhang Y, et al. Systematic analysis of cell-type differences in the epithelial secretome reveals insights into the pathogenesis of respiratory syncytial virus-induced lower respiratory tract infections. J Immunol. 2017;198:3345–3364. [DOI] [PMC free article] [PubMed] [Google Scholar]
- [19].Bertolusso R, Tian B, Zhao Y, et al. Dynamic cross talk model of the epithelial innate immune response to double-stranded rna stimulation: coordinated dynamics emerging from cell-level noise. PLoS ONE. 2014;9:e93396. [DOI] [PMC free article] [PubMed] [Google Scholar]
- [20].Fang L, Choudhary S, Tian B, et al. Ataxia telangiectasia mutated kinase mediates NF-kappaB serine 276 phosphorylation and interferon expression via the IRF7-RIG-I amplification loop in paramyxovirus infection. J Virol. 2015;89:2628–2642. [DOI] [PMC free article] [PubMed] [Google Scholar]
- [21].Choudhary S, Boldogh I, Brasier AR. Inside-out signaling pathways from nuclear reactive oxygen species control pulmonary innate immunity. J Innate Immun. 2016;8:143–155. [DOI] [PMC free article] [PubMed] [Google Scholar]
- [22].Wiktorowicz JE, Jamaluddin M. Proteomic analysis of the asthmatic airway. Adv Exp Med Biol. 2014;795:221–232. [DOI] [PubMed] [Google Scholar]
- [23].Levanen B, Bhakta NR, Torregrosa Paredes P, et al. Altered microRNA profiles in bronchoalveolar lavage fluid exosomes in asthmatic patients. J Allergy Clin Immunol. 2013;131:894–903. [DOI] [PMC free article] [PubMed] [Google Scholar]
- [24].Torregrosa Paredes P, Esser J, Admyre C, et al. Bronchoalveolar lavage fluid exosomes contribute to cytokine and leukotriene production in allergic asthma. Allergy. 2012;67:911–919. [DOI] [PubMed] [Google Scholar]
- [25].Kesimer M, Scull M, Brighton B, et al. Characterization of exosome-like vesicles released from human tracheobronchial ciliated epithelium: a possible role in innate defense. FASEB J. 2009;23:1858–1868. [DOI] [PMC free article] [PubMed] [Google Scholar]
- [26].Kulshreshtha A, Ahmad T, Agrawal A, et al. Proinflammatory role of epithelial cell-derived exosomes in allergic airway inflammation. J Allergy Clin Immunol. 2013;131:1194-1203, 1203.e1191-e1114. [DOI] [PubMed] [Google Scholar]
- [27].Schageman J, Zeringer E, Li M, et al. The complete exosome workflow solution: from isolation to characterization of RNA cargo. Biomed Res Int. 2013;2013:253957. [DOI] [PMC free article] [PubMed] [Google Scholar]
- [28].Sarker S, Scholz-Romero K, Perez A, et al. Placenta-derived exosomes continuously increase in maternal circulation over the first trimester of pregnancy. J Transl Med. 2014;12:204. [DOI] [PMC free article] [PubMed] [Google Scholar]
- [29].Thery C, Amigorena S, Raposo G, et al. Isolation and characterization of exosomes from cell culture supernatants and biological fluids In Current protocols in cell biology /editorial board, Juan S. Bonifacino … [et al.] 30:3.22:3.22.1–3.22.29 2006. Available from: http://onlinelibrary.wiley.com/doi/10.1002/0471143030.cb0322s30/full [DOI] [PubMed] [Google Scholar]
- [30].Cvjetkovic A, Lotvall J, Lasser C. The influence of rotor type and centrifugation time on the yield and purity of extracellular vesicles. J Extracell Vesicles. 2014;3 DOI: 10.3402/jev.v3.23111 [DOI] [PMC free article] [PubMed] [Google Scholar]
- [31].Wessel D, Flugge UI. A method for the quantitative recovery of protein in dilute solution in the presence of detergents and lipids. Anal Biochem. 1984;138:141–143. [DOI] [PubMed] [Google Scholar]
- [32].Cox J, Hein MY, Luber CA, et al. Accurate proteome-wide label-free quantification by delayed normalization and maximal peptide ratio extraction, termed MaxLFQ. Mol Cell Proteomics. 2014;13:2513–2526. [DOI] [PMC free article] [PubMed] [Google Scholar]
- [33].Cox J, Mann M. MaxQuant enables high peptide identification rates, individualized p.p.b.-range mass accuracies and proteome-wide protein quantification. Nat Biotechnol. 2008;26:1367–1372. [DOI] [PubMed] [Google Scholar]
- [34].Tyanova S, Temu T, Sinitcyn P, et al. The Perseus computational platform for comprehensive analysis of (prote)omics data. Nat Methods. 2016;13:731–740. [DOI] [PubMed] [Google Scholar]
- [35].Gaudet P, Livstone MS, Lewis SE, et al. Phylogenetic-based propagation of functional annotations within the Gene Ontology consortium. Brief Bioinform. 2011;12:449–462. [DOI] [PMC free article] [PubMed] [Google Scholar]
- [36].Perera AS, Wang H, Basel MT, et al. Channel Blocking of MspA Revisited. Langmuir. 2013;29:308–315. [DOI] [PubMed] [Google Scholar]
- [37].Consortium E-T, Van Deun J, Mestdagh P, et al. EV-TRACK: transparent reporting and centralizing knowledge in extracellular vesicle research. Nat Methods. 2017;14:228–232. [DOI] [PubMed] [Google Scholar]
- [38].Raposo G, Stoorvogel W. Extracellular vesicles: exosomes, microvesicles, and friends. J Cell Biol. 2013;200:373–383. [DOI] [PMC free article] [PubMed] [Google Scholar]
- [39].Kesimer M, Gupta R. Physical characterization and profiling of airway epithelial derived exosomes using light scattering. Methods. 2015;87:59–63. [DOI] [PMC free article] [PubMed] [Google Scholar]
- [40].Basel MT, Shrestha TB, Troyer DL, et al. Protease-sensitive, polymer-caged liposomes: a method for making highly targeted liposomes using triggered release. ACS Nano. 2011;5:2162–2175. [DOI] [PubMed] [Google Scholar]
- [41].Podaru G, Ogden S, Baxter A, et al. Pulsed magnetic field induced fast drug release from magneto liposomes via ultrasound generation. J Phys Chem B. 2014;118:11715–11722. [DOI] [PubMed] [Google Scholar]
- [42].Fujita Y, Yoshioka Y, Ito S, et al. Intercellular communication by extracellular vesicles and their microRNAs in asthma. Clin Ther. 2014;36:873–881. [DOI] [PubMed] [Google Scholar]
- [43].Takahashi T, Kubo H. The role of microparticles in chronic obstructive pulmonary disease. Int J Chron Obstruct Pulmon Dis. 2014;9:303–314. [DOI] [PMC free article] [PubMed] [Google Scholar]
- [44].Lötvall J, Hill AF, Hochberg F, et al. Minimal experimental requirements for definition of extracellular vesicles and their functions: a position statement from the international society for extracellular vesicles. J Extracellular Vesicles. 2014;3: DOI: 10.3402/jev.v3.26913. [DOI] [PMC free article] [PubMed] [Google Scholar]
- [45].Wu Y, Deng W, Klinke DJ 2nd. Exosomes: improved methods to characterize their morphology, RNA content, and surface protein biomarkers. Analyst. 2015;140:6631–6642. [DOI] [PMC free article] [PubMed] [Google Scholar]
- [46].Lee M, Ban -J-J, Im W, et al. Influence of storage condition on exosome recovery. Biotechnol Bioprocess Eng. 2016;21:299–304. [Google Scholar]
- [47].Lorincz AM, Timar CI, Marosvari KA, et al. Effect of storage on physical and functional properties of extracellular vesicles derived from neutrophilic granulocytes. J Extracell Vesicles. 2014;3:25465. [DOI] [PMC free article] [PubMed] [Google Scholar]
- [48].Boing AN, Van Der Pol E, Grootemaat AE, et al. Single-step isolation of extracellular vesicles by size-exclusion chromatography. J Extracell Vesicles. 2014;3: DOI: 10.3402/jev.v3.2343. [DOI] [PMC free article] [PubMed] [Google Scholar]
- [49].Dudani JS, Gossett DR, Tse HT, et al. Rapid inertial solution exchange for enrichment and flow cytometric detection of microvesicles. Biomicrofluidics. 2015;9:014112. [DOI] [PMC free article] [PubMed] [Google Scholar]
- [50].Oksvold MP, Neurauter A, Pedersen KW. Magnetic bead-based isolation of exosomes. Methods Mol Biol. 2015;1218:465–481. [DOI] [PubMed] [Google Scholar]
- [51].Bosch S, De Beaurepaire L, Allard M, et al. Trehalose prevents aggregation of exosomes and cryodamage. Sci Rep. 2016;6:36162. [DOI] [PMC free article] [PubMed] [Google Scholar]
Associated Data
This section collects any data citations, data availability statements, or supplementary materials included in this article.