Abstract
We used cryo-electron tomography in conjunction with single-particle averaging techniques to study the structures of frozen-hydrated envelope glycoprotein (Env) complexes on intact Moloney murine leukemia retrovirus particles. Cryo-electron tomography allows 3D imaging of viruses in toto at a resolution sufficient to locate individual macromolecules, and local averaging of abundant complexes substantially improves the resolution. The averaging of repetitive features in electron tomograms is hampered by a low signal-to-noise ratio and anisotropic resolution, which results from the “missing-wedge” effect. We developed an iterative 3D averaging algorithm that compensates for this effect and used it to determine the trimeric structure of Env to a resolution of 2.7 nm, at which individual domains can be resolved. Strikingly, the 3D reconstruction is shaped like a tripod in which the trimer penetrates the membrane at three distinct locations ≈4.5 nm apart from one another. The Env reconstruction allows tentative docking of the x-ray crystal structure of the receptor-binding domain. This study thus provides 3D structural information regarding the prefusion conformation of an intact unstained retrovirus surface protein.
Keywords: cryo-electron microscopy, single-particle analysis, Moloney murine leukemia virus
The surfaces of retroviruses are studded with a trimeric, type I transmembrane glycoprotein complex called “Env.” During infection, Env mediates binding of virus to its receptor in the cell plasma membrane and subsequent fusion of the viral and cellular membranes. Env undergoes large-scale conformational changes during these events (1, 2). Although the high-resolution structures of Env fragments from various retroviruses have been determined (3-9), the structure of intact Env on the virion surface is known only on a gross morphological level as a trimeric projection (10-12). The quaternary structure of Env on fresh virions is the starting point for the structural rearrangements that enable entry of the virus into cells and is therefore key to our understanding of the mechanism of retrovirus infection.
Certain features of intact retroviral Env hamper its structural analysis by x-ray crystallography. For example, glycosylation, which can exceed 50% of the mass of Env, is an impediment to crystallization. Single-pass transmembrane proteins are notoriously difficult to crystallize; therefore attempts to replace the transmembrane region have been made by fusing the Env ectodomain to carrier proteins (13, 14). Generation of a soluble Env ectodomain lacking transmembrane segments has typically involved removal of a proteolytic processing site (13), which prevents subunit dissociation but also prevents maturation of the complex into its final functional form. The large quantities of soluble Env necessary for crystallization attempts are difficult to prepare, and the material is often unstable and heterogeneous. Electron microscopy (EM) avoids many of these difficulties and provides useful structural information albeit at lower resolution.
In EM “single-particle” analysis, large numbers of 2D views of a macromolecule are combined to yield a 3D structure (e.g., see ref. 15). These views must be aligned before the reconstruction, typically by means of cross-correlation. However, these single-particle averaging techniques can also be problematic because they typically require solubilization and purification of the macromolecule of interest, which in turn can cause structural changes. To overcome some of these problems, cross-linking was performed before solubilization in a 2D study of Env from another retrovirus, simian immunodeficiency virus (SIV), revealing structures with a triangular, or trilobed morphology (11). Negatively stained human foamy virus (HFV) was used as the basis for 3D reconstruction of Env in situ by the single-particle approach (10), but the drying and staining effects limited the resolution and interpretability severely.
Electron tomography (ET) of whole viruses avoids the solubilization of complexes or the need to engineer fusion proteins. This technique involves collecting a tilt series of micrographs of the specimen and combining them computationally to reconstruct a 3D density map: the tomogram (16). ET of dried negatively stained simian immunodeficiency virus and subsequent characterization of the Env complexes in 2D provided a glimpse of Env in the prefusion state (12). However, possible artifacts resulting from drying and heavy metal staining made an in-depth structural characterization impossible. As recently demonstrated (17), cryo-ET (CET), i.e., ET of frozen-hydrated specimens, offers the opportunity to study the 3D structures of individual macromolecular complexes in their natural biological settings (16). The technology of ET matured only recently to allow imaging of vitrified viruses or cells in toto. The resolution of CET is ultimately limited by the radiation sensitivity of samples. Moreover, the restricted tilt range causes a missing wedge of data in Fourier space (16), and the resulting anisotropic resolution makes an accurate 3D alignment difficult. We have used a “constrained correlation function” to overcome this problem.
The subject of this study is the trimeric Env glycoprotein complex of Moloney murine leukemia virus (MoMuLV) in the prefusion state. We used CET to obtain 3D reconstructions of entire retrovirus particles, from which subtomograms containing individual Env trimers were extracted. Env is only ≈270 kDa in total, at the lower size limit for practical application of conventional single-particle averaging. In this article we present the structure of the MoMuLV Env complex in situ at a resolution better than 3 nm. This density map gives us an overall view of the morphology and domain organization of Env, and we have attempted to fit the high-resolution model of the Env receptor-binding domain (4) within the trimeric complex.
Materials and Methods
Virus Production. MoMuLV particles were produced in CL-1 cells (gift of James Cunningham, Harvard Medical School) and purified from cell culture supernatant by banding on sucrose gradients. A step gradient (0.8 ml each step) from 60% to 10% sucrose in PBS was prepared in 14 × 89 mm polyallomer ultracentrifuge tubes (Beckman). Cell culture supernatant was filtered through a 0.45-μm filter and layered on top of the gradient. Samples were centrifuged at 20,000 rpm in an SW41 Ti rotor (Beckman) for 45 min, and virus bands were removed through the side of the tube by using a needle and syringe. Virus was dialyzed against 10 mM Tris·HCl, pH 7.5.
Grid Preparation, Electron Tomography Data Collection, and 3D Reconstruction of Viruses. Grids for cryo-electron microscopy were prepared by placing 3-μl solutions of virus and gold nanoparticles successively on lacey carbon grids (Ted Pella, Inc., Redding, CA). Excess liquid was blotted, and the grids were vitrified in liquid ethane as described (18). Samples were viewed in a CM300 transmission electron microscope equipped with a field-emission gun (FEI, Eindhoven, The Netherlands) and a Gatan postcolumn GIF 2002 energy filter (Pleasanton, CA). Tilt series were collected covering an angular range of -66° to 66°, with increments between 1.5° and 3°. The defocus level Δ ranged from ≈6 to 4 μm. The data recorded at Δ = 6 μm were used for visualization of the virions and generation of an initial model of the Env complex. The Env model was then refined and symmetry was verified from tomographic data at Δ = 5 μm, and the final average was accomplished by using data at Δ = 4 μm. The effective magnification was ×55,000, which resulted in a pixel size of 5.5 Å at the specimen level. The micrographs were aligned to a common origin by using gold markers. To minimize the effect of systematic alignment errors, the gold marker in closest vicinity to a single virion was kept fixed; the coordinates of the other gold markers were optimized in a least-squares fit as implemented in the tom package (19). Subsequently, the 3D reconstruction was computed by means of weighted back-projection using the em image-processing software package (20).
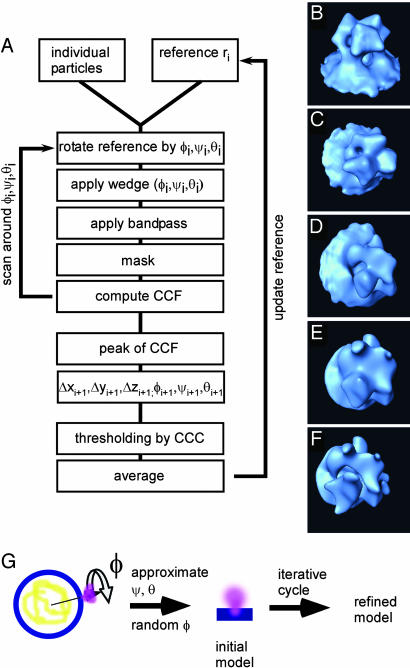
Image Analysis. Features presumed to be Env protein complexes were located manually in tomograms that had been low-pass filtered to facilitate detection. Subtomograms containing 40 × 40 × 40 voxels were extracted, and an initial reference was created. By assuming that the symmetry axis of the Env complexes is oriented perpendicular to the viral membrane, which has an approximately spherical shape, the ψ and θ Eulerian angles could be estimated. The polar angle ϕ was chosen randomly for each individual complex. The appropriate transformations were applied to Env trimers, which were then averaged to yield the initial reference. The subtomograms were then subjected to the alignment scheme described in Fig. 3 and implemented in the scripting language MATLAB (MathWorks, Natick, MA) using modules of the tom package (19). After three iterations of the spatial and angular alignment procedure, the particles were aligned to a common ϕ as described in Results and Supporting Text, which is published as supporting information on the PNAS web site. Spatial and angular alignment was then resumed until the procedure converged. During alignment, only the particles that contributed significantly to the average, the 75% that yielded the highest cross-correlation value, were incorporated into the average (Fig. 7, which is published as supporting information on the PNAS web site). The resolution was determined by Fourier-ring correlation using a coefficient of 0.5 as a threshold (Fig. 8, which is published as supporting information on the PNAS web site). During alignment, data beyond the first zero of the contrast transfer function (CTF) were cut off. The data were not corrected for the CTF because the signal-to-noise ratio (SNR) of the micrographs is too low to determine it very accurately. For visualization of whole virions, the data were denoised by using nonlinear anisotropic diffusion (21). All computations were carried out on a dual processor PC equipped with 1.8-GHz Opteron processors (AMD, Sunnyvale, CA) and 8 gigabytes of memory.
Fig. 3.
Summary of 3D averaging procedure. (A) Iterative “tomogram-matching” scheme. (B-F) Illustrations of the individual steps of reference preparation. For the subtomogram (for example, B), the reference is rotated into an orientation (ϕ, ψ, θ)(C). It is Fourier transformed, and a wedge-shaped function, corresponding to the imaging conditions, is multiplied (D). Back in real space, the reference and the subtomogram are masked (E), and the shifts (Δxi, Δyi, and Δzi) are considered for the subtomogram. Both data are band-pass filtered (F) before subtraction of the mean value and normalization according to the standard deviation within the masked area. Eventually, the cross-correlation function (CCF) is computed. The peak of the CCF with respect to orientation and location (maximum cross-correlation coefficient CCCmax) determines the Eulerian angles and shifts for the next iteration i + 1. As a criterion for exclusion of particles, the height of CCCmax relative to average CCCmax can be used. The final step is the averaging of the aligned subtomograms, which includes correct weighting according to the data coverage in Fourier space. This average is used as a reference for iteration i + 1. (G) Approximate a priori determination of two of three Euler angles for initial reference. The initial reference is created by assuming that the Env particles are oriented perpendicular to the viral membrane, which fixes ψ and θ; the polar angle ϕ is chosen randomly initially.
Fitting of X-Ray Structures. Fitting of the x-ray structures into the EM density map was performed by cross-correlation using the tom package. An EM density map of the receptor-binding domain was obtained by summation of the atomic numbers noted in the protein data bank (PDB) file 1AOL within each volume element on a Cartesian grid. The density was subsequently convoluted with the assumed CTF (see Supporting Text) and band-pass filtered according to a resolution of 2.7 nm. Finally, a six-dimensional cross-correlation was computed whereby the Euler angles were exhaustively scanned with an increment of 5°. The maximum correlation was about 0.5.
Results
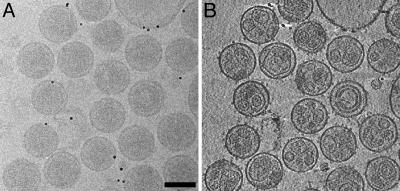
Cryo-Tomograms of MoMuLV Virions. Reconstructions of about 100 virions originating from 14 tomograms were obtained. Virions are ≈100 nm in diameter (Fig. 1) but are somewhat heterogeneous in size (approximately ±10 nm) (22). The SNR of the tomograms was sufficient to perform a manual segmentation of the virions into core, lipid bilayer membrane, and Env complexes (Fig. 2). As reported for mouse mammary tumor virus (23), the cores are located eccentrically and have irregular shapes, and virions with several cores per particle were often observed.
Fig. 1.
Cyro-electron tomograms of MoMuLV. (A) Conventional transmission electron micrograph (0° tilt projection) of vitrified MoMuLV. (Bar, 100 nm.) The micrograph is taken at a defocus of 5 μm. (B)An x-y slice of a tomogram, 11 nm thick in z. Because the reconstruction incorporates the data of different views, SNR is clearly improved compared with the raw micrograph, which enables identification of the Env particles. At this magnification, Env complexes are visible as dots coating the viral membrane.
Fig. 2.
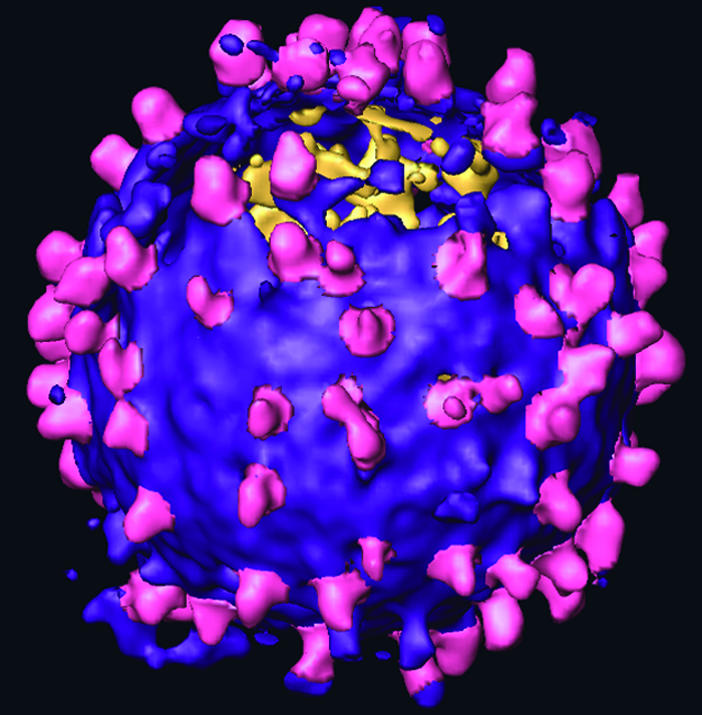
Surface rendered tomogram of an individual MoMuLV virion that possesses particularly many spikes. Env complexes (magenta) are located at the lipid surface of the virus (purple). The segmentation of the Env particles was performed interactively. The tomogram was denoised by using nonlinear anisotropic diffusion for visualization purposes (22).
In our unstained frozen-hydrated samples, Env glycoprotein complexes could be seen radiating from the surfaces of the viruses (Fig. 1). About 50 ± 20 spikes ≈10 nm in height were located manually on each of 59 virions from four tilt series. This number is likely to underestimate the real number by up to 50% because Env complexes around the upper and lower poles of the virions are difficult to recognize because of the missing-wedge effect. The Env complexes appear to be randomly distributed on the membrane, i.e., lacking the regularity observed for human foamy virus (10). Several individual Env particles showed a trimeric assembly already without averaging.
3D Alignment and Averaging of Env Complexes. Macromolecules in a tomogram usually have arbitrary orientations, and their locations can be manually determined only approximately. The task of 3D alignment is to align the individual subtomograms with respect to a common frame by determining the Eulerian angles ϕ, ψ, and θ, and spatial shifts Δx, Δy, and Δz in each case. The criterion used to optimize the alignment is the cross-correlation coefficient (CCC) of the individual particles with some reference structure. An iterative algorithm for tomographic data similar to procedures used in single-particle averaging has been described (24). We have developed this procedure further; in particular, our approach accounts for the missing wedge.
The iterative alignment scheme is outlined and explained in Fig. 3 A-F. As an initial reference, either a synthetic reference can be used or an ab initio model can be created if geometrical knowledge is available as in our studies (Fig. 3G). In contrast to the previous approach (24), we considered the missing wedge in Fourier space before computing the CCF, which is the basis of the alignment (see Supporting Text). Alignment procedures neglecting this effect tend to orient subtomograms according to the missing wedge, which is the dominant feature at low SNRs. As a consequence, the angles assigned to subtomograms are heavily biased by the orientation of the subtomogram relative to the coordinate system of the full tomogram. In essence, our approach bypasses this difficulty by constraining the correlation to the experimentally sampled data.
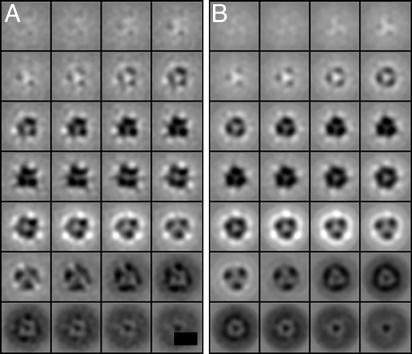
The above procedure scans for the optimal orientation of particles with respect to a reference in the proximity of an initial orientation. An exhaustive rotational scan is required only for the polar angle ϕ, because the other angles are approximately known a priori. To determine ϕ, a different alignment step is performed after preliminary convergence of the above procedure (see Supporting Text). In this procedure, an Env particle that possesses high SNR and protrudes approximately parallel to the z axis of the tomogram is chosen as a first reference to which a randomly chosen particle is aligned according to ϕ. Both particles are averaged, a third one is aligned and added to the average, and so forth. The average showed clear threefold rotational symmetry along the z axis (Fig. 4).
Fig. 4.
Env structure visualized as x-y slices along the z axis (normal to the membrane) before (A) and after (B) imposing threefold along the z axis. The reconstructions are obtained from 1,114 individual Env subtomograms acquired at 5-μm defocus. The scale bar is equivalent to 10 nm, and each square (slice) corresponds to 0.55-nm thickness. The last z sections (bottom left to right) correspond to the viral membrane.
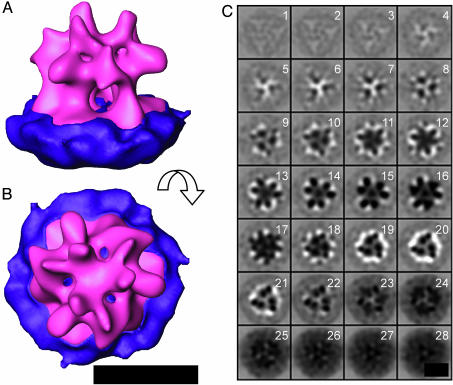
Env Structure. The final reconstruction of MoMuLV Env yielded a trimeric structure with a height and diameter of ≈10 nm (Fig. 5). The overall size, shape, and symmetry are consistent with previously published 2D structures of Env from simian immunodeficiency virus (11, 12, 14). MoMuLV Env is somewhat broader and squatter than the 3D structure of human foamy virus Env, which appears to be only 7 nm, as opposed to 10 nm, wide (10). The absolute handedness of the structure is unambiguous, because the tilt axis of the EM is known. A surface rendered view of the 3D structure after applying symmetry is shown in Fig. 5A. Env consists of an extraviral body, which exhibits pronounced handedness, as was observed previously for simian immunodeficiency virus Env particles in the prefusion state (12). Hardly any density can be observed on the viroplasmic side of the lipid bilayer, consistent with the sequence of MoMuLV Env, which predicts less than 4 kDa (≈4% of the entire mass of Env) to be present carboxyl terminal to the transmembrane region. The extraviral body is connected to the viral membrane by three legs, which enclose a central cavity.
Fig. 5.
Final Env structure. (A and B) Isosurface representation of the resulting average at 4-μm defocus of Env as seen from the side (A) and the top (B). Manual segmentation of the viral membrane (purple) and the complex (magenta) was performed to visualize the complex. (C) Env visualized as in Fig. 4. (The scale bar corresponds to 10 nm.)
The 3D map of MoMuLV Env contains a number of notable features, which can be seen in 2D slices through the reconstruction normal to the membrane (Fig. 5C). The diffuse gray structure visible in z sections 26-28 corresponds to the lipid bilayer membrane. z sections 27 and 28, which are approximately midway through the membrane, contain three dense points spaced ≈4.5 nm from one another. Although the resolution of the final reconstruction is about 2.7 nm, the dense and globular appearance of these points suggests that they originate from a substructure with a diameter of 1.0-1.5 nm, roughly consistent with the diameter of an α-helix. The pattern becomes more complex in the z sections that represent the outer leaflet of the membrane. Here, in z sections 23-25, a second, indistinct, feature starts to appear at a greater distance from the central axis of the trimer. As one proceeds farther along z out of the viral membrane, some features disappear, and the map density begins to resolve into distinct compact substructures. In z sections 18-21, two dense features per protomer in the trimer are clearly seen, consistent with each having a diameter of about 1.5 nm. The three interior features, which perhaps continue into the membrane, appear to be about 3 nm long. The three exterior features are about 4 nm long. Continuing along the z axis away from the membrane, the pattern again becomes complicated, but in z sections 13-16, the density resolves again into two domains, each larger than the two substructures located closer to the membrane (≈2.5-3.5 nm in diameter).
Retrovirus Env consists of two protein subunits, SU for “surface” and TM for “transmembrane,” derived from a polyprotein by proteolytic processing in the infected cell. The structures of two portions of MoMuLV Env have been determined by x-ray crystallography. One, which consists of the ≈30-kDa receptor-binding domain (RBD), is from SU (4). The second is a 5.6-kDa fragment derived from TM (3) but lacking the amino-terminal “fusion-peptide” segment and the carboxyl-terminal transmembrane region of this subunit. Considering the working model for Env activity, in which the TM subunit is proposed to undergo large-scale conformational changes between its structure in intact native Env and the postfusion conformation represented by the x-ray crystal structures (1, 2), no attempts were made to dock the TM fragment into the tomographic map. However, the RBD of SU binds receptor both in isolation (25) and in the context of intact Env, and it may therefore be in the same conformation on the surface of virions and in the crystallized domain. RBD is 6 nm across in its largest dimension. It is roughly L-shaped and consists of a β-sandwich measuring 4 × 3 × 2 nm and a helical subdomain ≈3 nm in diameter. RBD clearly fits only into the distal part of the Env structure, although we cannot rule out different orientations and locations.
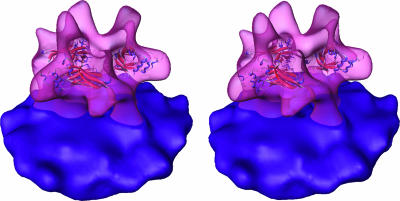
To localize RBD more precisely in the context of the Env structure, we fitted the x-ray structure into our density map by means of cross-correlation. The location of RBD suggested by this procedure (Fig. 6) appears to be plausible: RBD fits into the envelope of the Env complex, the putative receptor-binding subdomain (4) is exposed to the exterior, evolutionarily well conserved residues point to the interior of the structure, and additional density is present to accommodate the continuation of the polypeptide chain at the carboxyl terminus of RBD. However, the resolution of the Env map, as well as the significance of the CCF as a measure of the quality of the fit, do not allow us to regard the proposed location as unambiguous.
Fig. 6.
Stereoview of the proposed fitting of the RBD structure (2) into the electron density map of the Env trimer.
Discussion
Studying MoMuLV Env by CET in situ has a number of advantages over other approaches. There is no risk of disrupting the structure of Env, as seems to occur when Env is solubilized and removed from the virion surface. The native protein-lipid relationship is maintained, and the quaternary structure of the glycoprotein complex is unperturbed. In addition, the Env particles do not need to be overexpressed and purified. Finally, this approach is applicable to the study of Env complexes at different and well defined stages of the infection cycle (e.g., see ref. 26).
Structure. The CET approach used here revealed a structure of MoMuLV that consists of large domains located ≈5 nm from the surface of the viral membrane. This mass is connected to the membrane by three legs per trimer. Each leg could be further resolved into two distinct but closely associated substructures. The morphology of MoMuLV Env differs somewhat from the only known high-resolution structures of surface spike protein complexes from enveloped viruses putatively in their native, prefusogenic states: the hemagglutinin (HA) complex from the orthomyxovirus influenza virus (27) and the F protein from the paramyxovirus Newcastle disease virus (28). These protein complexes are relatively compact structures shaped roughly like inverted bowling pins, and the complexes do not contain substantial internal cavities. Although MoMuLV Env is also a type I fusion protein, the presence of a cavity on its symmetry axis is a feature shared with type II fusion proteins such as those of alphaviruses and flaviviruses (29, 30).
The lack of density on the trimer axis near the viral membrane lends support to the relevance of the “spring-loaded” model (31) for retrovirus envelope proteins. This model was originally proposed to describe the conformational changes of influenza hemagglutinin upon activation of its membrane-fusion mechanism. Should it apply to retroviruses as well, it would predict that the coiled coil seen in the structure of retroviral TM peptides in isolation would not be present in the native prefusogenic Env structure. Instead, the coiled coil would form only once the membrane-fusion mechanism was triggered. Because the coiled coil is a compact, tightly packed, rod-shaped structure (3), it would have to lie directly on the trimer axis in native Env if symmetry is maintained. Our structure of MoMuLV Env is incompatible with such a trimeric coiled coil existing within the first 5 nm above the outer leaflet of the viral membrane. Although formally possible, it is not likely that the coiled coil is farther than this distance above the membrane, because only ≈40 amino acid residues connect the crystallized coiled-coil domain with the transmembrane region. Instead, it is possible that the TM polypeptide contributes to the separate legs in some alternate structure, and only after a conformational change forms the three-stranded coiled coil.
The dimensions of the two substructures constituting each of the legs that jointly enclose the internal cavity at the base of Env (z sections 18-22 of Fig. 5C) are similar to those of the structure that penetrates the membrane (z section 28), which is expected to be an α-helix. Retrovirus TM is predicted from its sequence to be highly helical, and high-resolution structures of TM fragments lacking the fusion peptide and transmembrane regions are helical (3, 6-9). One possible model is that the leg structures consist of a pair of antiparallel helices, with the outer helix composed of the sequence just downstream of the fusion peptide. This helix, which will eventually form the three-stranded coiled coil, would be oriented with its amino terminus close to the membrane. In this orientation, the Cys-Xaa6-Cys-Cys motif (in which Xaa represents a noncysteine amino acid) at the carboxyl terminus of this helix (3) would be well positioned to form a covalent bond with a cysteine in the carboxyl-terminal portion of SU, which presumably lies above the legs. The TM structure would change directions at this point, continuing back toward the membrane through a second helix predicted from the TM sequence. It must be noted, however, that the center-to-center distance of the two features in z sections 18-22 is about 2.5 nm, as opposed to the 1.2-1.5 nm observed for tight-packed helices.
About 5-6 nm above the membrane, two substantial domains per unit of the Env trimer are clearly visible in the map. The relative sizes of these two domains assessed by their diameters in z sections 14 and 15 in Fig. 5C correspond roughly to the number of amino acids in the amino-terminal RBD (≈240) and the carboxyl-terminal (≈180) portions of SU. It has been demonstrated already that MoMuLV RBD is an independently folding and functional unit (25), and it is therefore expected to account for one of these domains. The portion of SU carboxyl terminal to RBD has not been produced as an isolated domain and is not predicted from its sequence to be as compact as a domain. Nevertheless, the carboxyl-terminal portion of SU is predicted to contain a substantial amount of β-sheet (www.emblheidelberg.de/predictprotein/predictprotein.html; ref. 32) and may be globular in the context of intact Env. It should be noted that the docking solution of RBD represents the best location and orientation of the domain for maximizing correlation with all unassigned density in the Env reconstruction. The solution with the highest CCC does not necessarily indicate the correct location, because the fitting by cross-correlation considers only one domain and can be biased by neighboring domains. Nevertheless, the docking solution places the putative receptor-contacting helical subdomain (4) into a sensible, solvent-exposed protrusion in the bulky distal portion of the Env structure.
Method. The structure determination by CET and subsequent averaging described here is a method suitable for resolving large membrane-bound complexes in their close-to-native states, as shown by its successful application to the nuclear-pore complex (33). The procedure is facilitated by the fact that Env complexes, which might be difficult to identify in isolation, could be readily located on the surfaces of virions. Furthermore, the geometrical constraints on the orientation of Env imposed by the roughly spherical structure of the virus could be exploited to obtain an initial alignment; because the particles are membrane bound, they possess to a first approximation only one rotational degree of freedom (34). In addition, inclusion of the embedding membrane increases the effective particle mass to >300 kDa, facilitating alignment by cross-correlation. It should be noted, however, that the inherent flexibility of membranes limits the extent to which this last fact can be exploited, so only the membrane mass directly surrounding the protein transmembrane region can be included in the alignment. Finally, averaging of tomographic data offers an advantage over single-particle averaging in that the angular assignment of individual particles on 3D volumes is easier than that based on 2D projections. 2D projections of particles from different directions can be very similar. This fact can cause severe errors, such as incorrectly classifying together and incoherently averaging particle images that actually consist of +90° and -90° rotations, resulting in pseudo mirror symmetric reconstructions (35).
The approach presented here still holds potential to extend the attainable resolution. The resolution of our structure is essentially limited by two factors. First, the usable information is limited to the data coverage within the first zero of the CTF. An extension would require a tomographic CTF correction, which was realized, for example, by Winkler and Taylor (36). However, under cryo-conditions, the low SNR of the individual micrographs does not allow reliable determination of the required parameters for a CTF correction. Significantly improved charge-coupled device cameras can possibly overcome this shortcoming (for a recent review see ref. 37). Second, the alignment of the individual micrographs limits the achievable resolution. For a very accurate alignment of the projections, highly precise EM stages and alignment procedures are necessary. There is room for improvement of both, which will make in situ structure determination to resolutions beyond 2 nm feasible. This resolution in turn will result in the possibility of fitting x-ray structures into EM maps unambiguously in many cases (38).
Supplementary Material
Acknowledgments
We thank Alasdair Steven, Reiner Hegerl, and Sharon Wolf for critically reading the manuscript. F.F. was supported, in part, by the Bundesministerium für Bildung und Forschung and the Stiftung Stipendien-Fonds der Chemischen Industrie. D.F. is incumbent of the Lilian and George Lyttle Career Development Chair.
Author contributions: W.B. and D.F. designed research; F.F. and O.M. performed research; F.F., N.Z., and D.F. analyzed data; and F.F. and D.F. wrote the paper.
This paper was submitted directly (Track II) to the PNAS office.
Abbreviations: ET, electron tomography; CET, cryo-ET; CCF, cross-correlation function; MoMuLV, Moloney murine leukemia virus; CTF, contrast transfer function; SNR, signal-to-noise ratio; CCC, cross-correlation coefficient; RBD, receptor-binding domain.
References
- 1.Eckert, D. M. & Kim, P. S. (2001) Annu. Rev. Biochem. 70, 777-810. [DOI] [PubMed] [Google Scholar]
- 2.Colman, P. M. & Lawrence, M. C. (2003) Nature Rev. Mol. Cell Biol. 4, 309-319. [DOI] [PubMed] [Google Scholar]
- 3.Fass, D., Harrison, S. C. & Kim, P. S. (1996) Nat. Struct. Biol. 3, 465-469. [DOI] [PubMed] [Google Scholar]
- 4.Fass, D., Davey, R. A., Hamson, C. A., Kim, P. S., Cunningham, J. M. & Berger, J. M. (1997) Science 277, 1662-1666. [DOI] [PubMed] [Google Scholar]
- 5.Kwong, P. D., Wyatt, R., Robinson, J., Sweet, R. W., Sodroski, J. & Hendrickson, W. A. (1998) Nature 393, 648-659. [DOI] [PMC free article] [PubMed] [Google Scholar]
- 6.Kobe, B., Center, R. J., Kemp, B. E. & Poumbourios, P. (1999) Proc. Natl. Acad. Sci. USA 96, 4319-4950. [DOI] [PMC free article] [PubMed] [Google Scholar]
- 7.Caffrey, M., Cai, M., Kaufman, J., Stahl, S. J., Wingfield, P. T., Covell, D. G., Gronenborn, A. M. & Clore, G. M. (1998) EMBO J. 17, 4572-4584. [DOI] [PMC free article] [PubMed] [Google Scholar]
- 8.Chan, D. C., Fass, D., Berger, J. M. & Kim, P. S. (1997) Cell 89, 263-273. [DOI] [PubMed] [Google Scholar]
- 9.Weissenhorn, W., Dessen, A., Harrison, S. C., Skehel, J. J. & Wiley, D. C. (1997) Nature 387, 426-430. [DOI] [PubMed] [Google Scholar]
- 10.Wilk, T., de Haas, F., Wagner, A., Rutten, T., Fuller, S., Flugel, R. M. & Lochelt, M. (2000) J. Virol. 74, 2885-2887. [DOI] [PMC free article] [PubMed] [Google Scholar]
- 11.Center, R. J., Schuck, P., Leapman, R. D., Arthur, L. O., Earl, P. L., Moss, B. & Lebowitz, J. (2001) Proc. Natl. Acad. Sci. USA 98, 14877-14882. [DOI] [PMC free article] [PubMed] [Google Scholar]
- 12.Zhu, P., Chertova, E., Bess, J., Jr., Lifson, J. D., Arthur, L. O., Liu, J., Taylor, K. A. & Roux, K. H. (2003) Proc. Natl. Acad. Sci. USA 100, 15812-15817. [DOI] [PMC free article] [PubMed] [Google Scholar]
- 13.Chen, B., Zhou, G., Kim, M., Chishti, Y., Hussey, R. E., Ely, B., Skehel, J. J., Reinherz, E. L., Harrison, S. C. & Wiley, D. C. (2000) J. Biol. Chem. 275, 34946-34953. [DOI] [PubMed] [Google Scholar]
- 14.Chen, B., Cheng, Y., Calder, L., Harrison, S. C., Reinherz, E. L., Skehel, J. J. & Wiley, D. C. (2004) J. Virol. 78, 4508-4516. [DOI] [PMC free article] [PubMed] [Google Scholar]
- 15.Frank, J. (2002) Annu. Rev. Biophys. Biomol. Struct. 31, 303-319. [DOI] [PubMed] [Google Scholar]
- 16.Baumeister, W. (2002) Curr. Opin. Struct. Biol. 12, 679-684. [DOI] [PubMed] [Google Scholar]
- 17.Grunewald, K., Desai, P., Winkler, D. C., Heymann, J. B., Belnap, D. M., Baumeister, W. & Steven, A. C. (2003) Science 302, 1396-1398. [DOI] [PubMed] [Google Scholar]
- 18.Dubochet, J., Adrian, M., Chang, J., Homo, J.-C., Lepault, J., McDowall, A. W. & Schultz, P. (1988) Q. Rev. Biophys. 21, 129-228. [DOI] [PubMed] [Google Scholar]
- 19.Nickell, S., Förster, F., Linaroudis, A., Del Net, W., Beck, F., Hegerl, R., Baumeister, W. & Plitzko, J. M. (2005) J. Struct. Biol. 149, 227-234. [DOI] [PubMed] [Google Scholar]
- 20.Hegerl, R. (1996) J. Struct. Biol. 116, 30-34. [DOI] [PubMed] [Google Scholar]
- 21.Frangakis, A. S. & Hegerl, R. (2001) J. Struct. Biol. 135, 239-250. [DOI] [PubMed] [Google Scholar]
- 22.Yeager, M., Wilson-Kubalek, E. M., Weiner, S. G., Brown, P. O. & Rein, A. (1998) Proc. Natl. Acad. Sci. USA 95, 7299-7304. [DOI] [PMC free article] [PubMed] [Google Scholar]
- 23.Briggs, J. A. G., Watson, B. E., Gowen, B. E. & Fuller, S. D. (2004) J. Virol. 78, 2606-2608. [DOI] [PMC free article] [PubMed] [Google Scholar]
- 24.Walz, J., Typke, D., Nitsch, M., Koster, A. J., Hegerl, R. & Baumeister, W. (1997) J. Struct. Biol. 120, 387-395. [DOI] [PubMed] [Google Scholar]
- 25.Davey, R. A., Hamson, C. A., Healey, J. J. & Cunningham, J. M. (1997) J. Virol. 71, 8096-8102. [DOI] [PMC free article] [PubMed] [Google Scholar]
- 26.Heymann, J. B., Cheng, N., Newcomb, W. W., Trus, B. L., Brown, J. C. & Steven, A. C. (2003) Nat. Struct. Biol. 10, 334-341. [DOI] [PubMed] [Google Scholar]
- 27.Wilson, I. A., Skehel, J. J. & Wiley, D. C. (1981) Nature 289, 366-373. [DOI] [PubMed] [Google Scholar]
- 28.Chen, L., Gorman, J. J., McKimm-Breschkin, J., Lawrence, L. J., Tulloch, P. A., Smith, B. J., Colman, P. M. & Lawrence, M. C. (2001) Structure 9, 255-266. [DOI] [PubMed] [Google Scholar]
- 29.Lescar, J., Roussel, A., Wien, M. W., Navaza, J., Fuller, S. D., Wengler, G. & Rey, F. A. (2001) Cell 105, 137-148. [DOI] [PubMed] [Google Scholar]
- 30.Zhang, W., Mukhopadhyay, S., Pletnev, S. V., Baker, T. S., Kuhn, R. J. & Rossmann, M. G. (2002) J. Virol. 76, 11645-11658. [DOI] [PMC free article] [PubMed] [Google Scholar]
- 31.Carr, C. M. & Kim, P. S. (1993) Cell 73, 823-832. [DOI] [PubMed] [Google Scholar]
- 32.Rost, B. (1996) Methods Enzymol. 266, 525-539. [DOI] [PubMed] [Google Scholar]
- 33.Beck, M., Förster, F., Ecke, M., Plitzko, J. M., Melchior, F., Gerisch, G., Baumeister, W. & Medalia, O. (2004) Science 306, 1387-1390. [DOI] [PubMed] [Google Scholar]
- 34.Jiang, Q.-X., Chester, D. W. & Sigworth, F. J. (2001) J. Struct. Biol. 133, 119-131. [DOI] [PubMed] [Google Scholar]
- 35.Rubinstein, J. L., Walker, J. E. & Henderson, R. (2003) EMBO J. 22, 6182-6192. [DOI] [PMC free article] [PubMed] [Google Scholar]
- 36.Winkler, H. & Taylor, K. A. (2003) J. Struct. Biol. 143, 24-32. [DOI] [PubMed] [Google Scholar]
- 37.Fan, G. Y. & Ellisman, M. H. (2000) J. Microsc. 200, 1-13. [DOI] [PubMed] [Google Scholar]
- 38.Wriggers, W. & Chácon, P. (2001) Structure 9, 779-788. [DOI] [PubMed] [Google Scholar]
Associated Data
This section collects any data citations, data availability statements, or supplementary materials included in this article.


